. 2016 Dec;8(4):1868-1891.
doi: 10.1002/2016MS000748. Epub 2016 Nov 16.

The tropical rain belts with an annual cycle and a continent model intercomparison project: TRACMIP

Affiliations

The tropical rain belts with an annual cycle and a continent model intercomparison project: TRACMIP

Aiko Voigt et al. J Adv Model Earth Syst. 2016 Dec.

Abstract

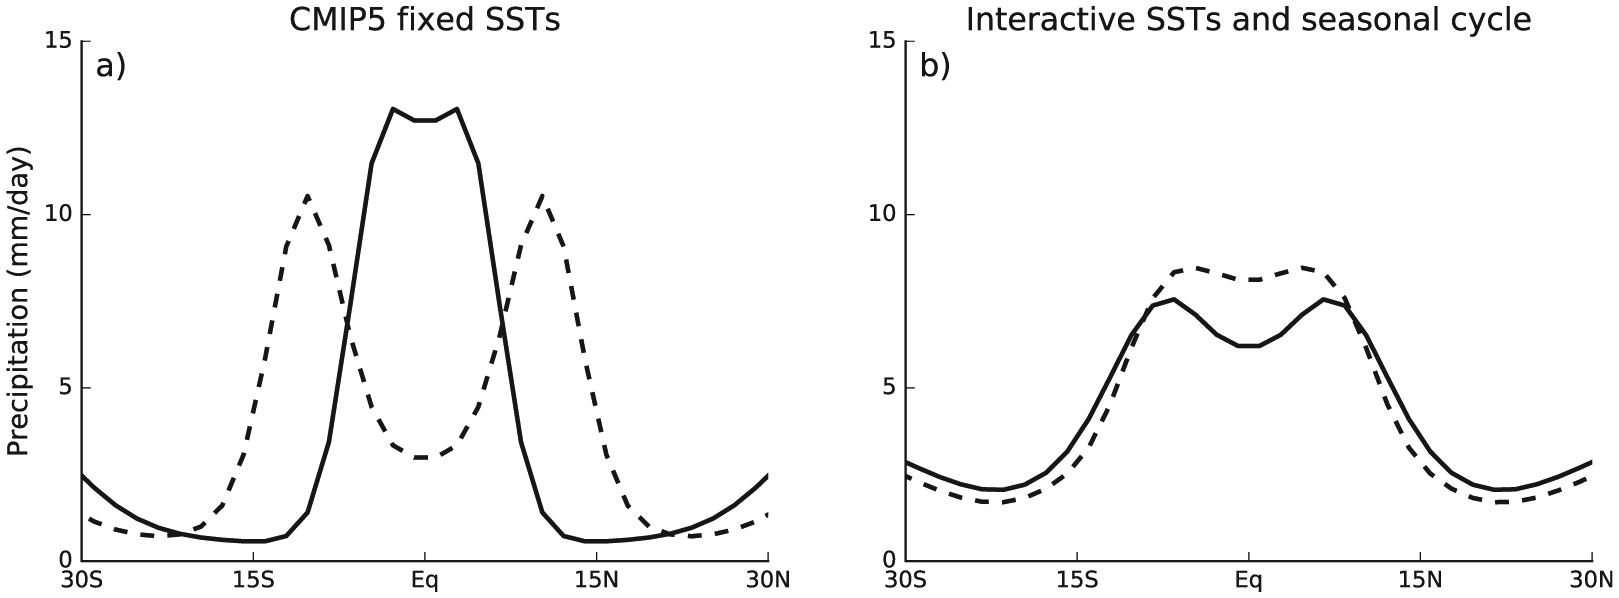
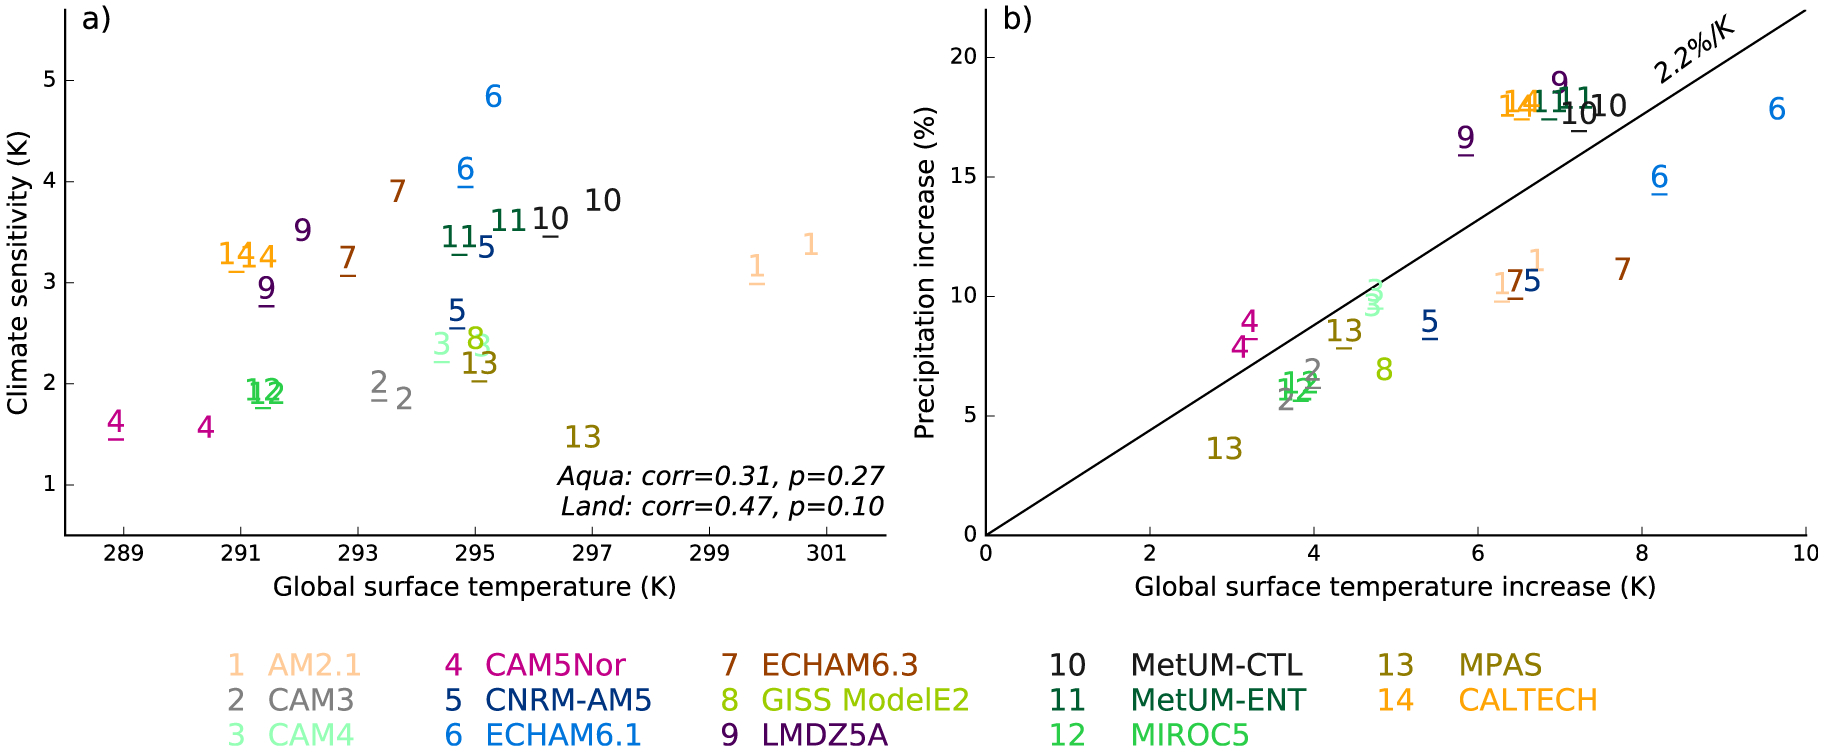
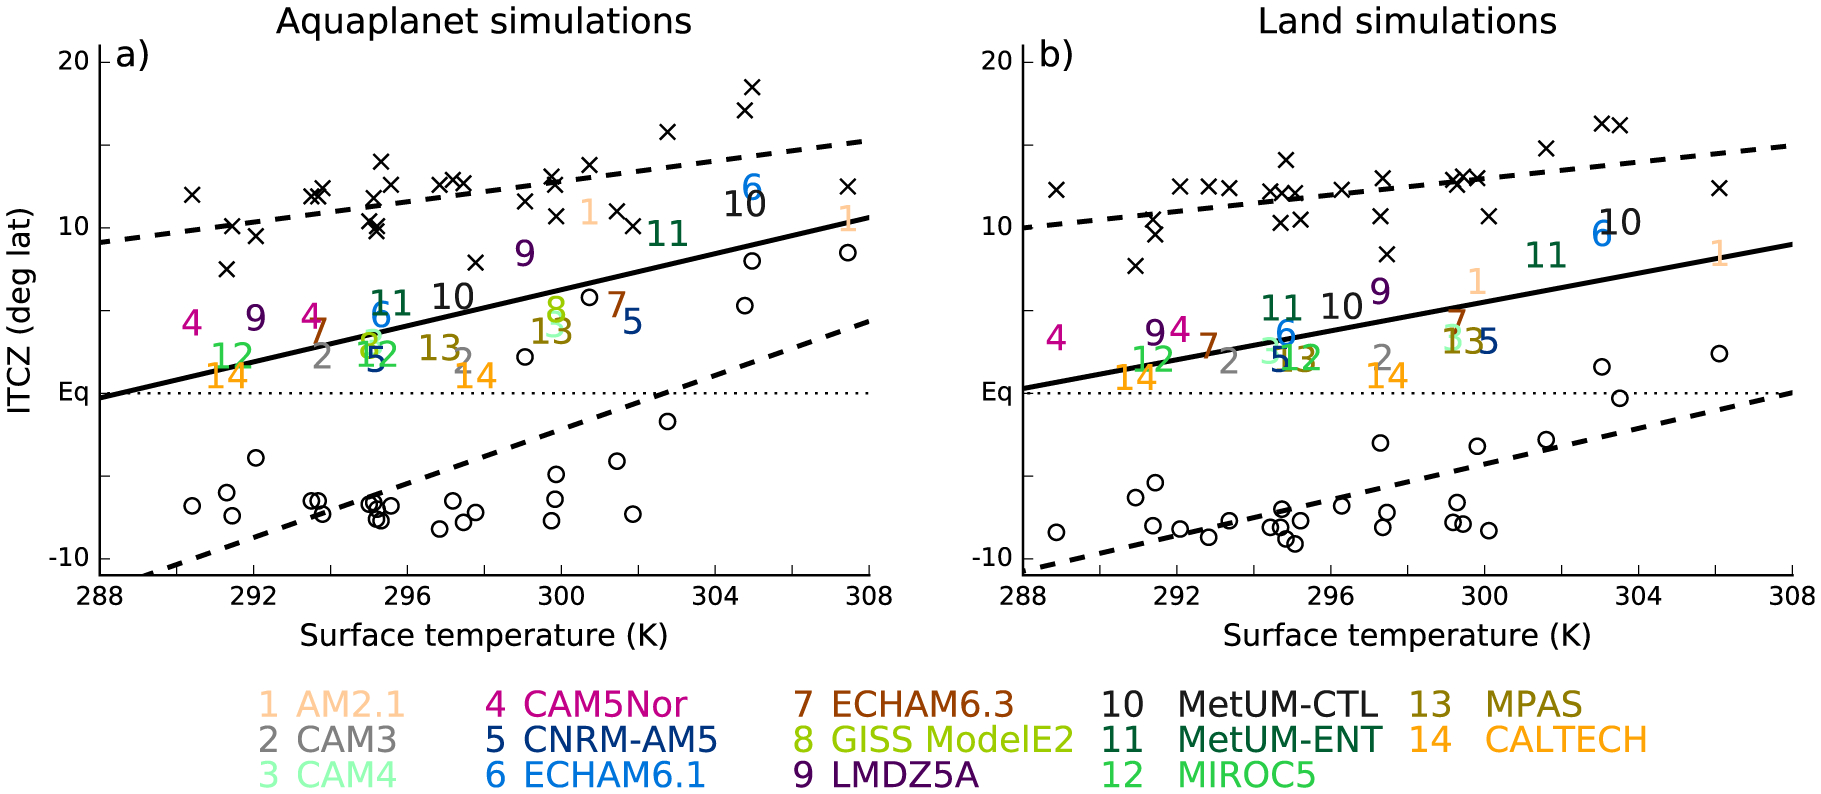
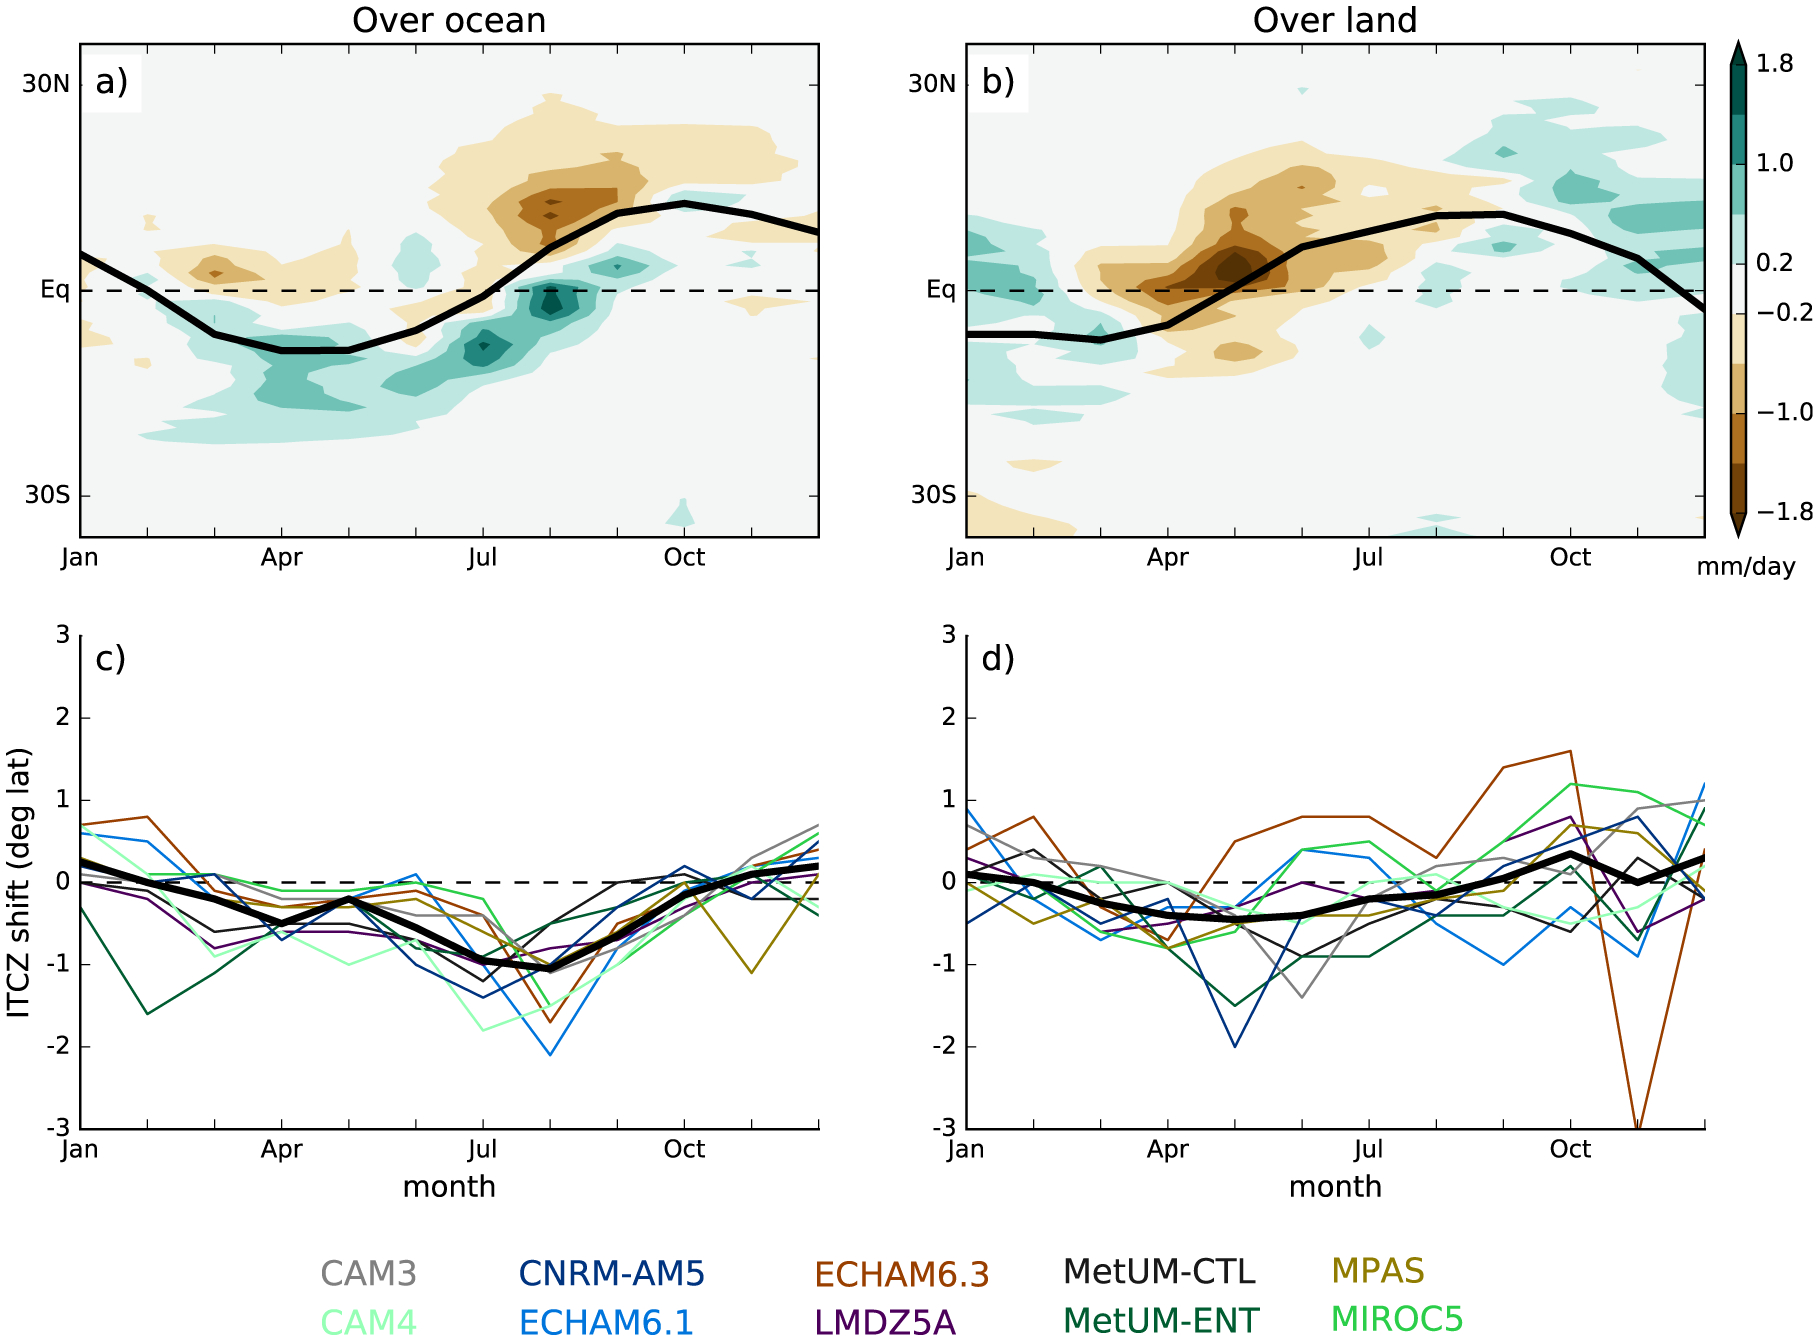
This paper introduces the Tropical Rain belts with an Annual cycle and a Continent Model Inter-comparison Project (TRACMIP). TRACMIP studies the dynamics of tropical rain belts and their response to past and future radiative forcings through simulations with 13 comprehensive and one simplified atmosphere models coupled to a slab ocean and driven by seasonally varying insolation. Five idealized experiments, two with an aquaplanet setup and three with a setup with an idealized tropical continent, fill the space between prescribed-SST aquaplanet simulations and realistic simulations provided by CMIP5/6. The simulations reproduce key features of present-day climate and expected future climate change, including an annual-mean intertropical convergence zone (ITCZ) that is located north of the equator and Hadley cells and eddy-driven jets that are similar to present-day climate. Quadrupling CO2 leads to a northward ITCZ shift and preferential warming in Northern high latitudes. The simulations show interesting CO2-induced changes in the seasonal excursion of the ITCZ and indicate a possible state dependence of climate sensitivity. The inclusion of an idealized continent modulates both the control climate and the response to increased CO2; for example, it reduces the northward ITCZ shift associated with warming and, in some models, climate sensitivity. In response to eccentricity-driven seasonal insolation changes, seasonal changes in oceanic rainfall are best characterized as a meridional dipole, while seasonal continental rainfall changes tend to be symmetric about the equator. This survey illustrates TRACMIP's potential to engender a deeper understanding of global and regional climate and to address questions on past and future climate change.


Figures

Figure 1.
Figure 1.
Equilibrium zonal-mean tropical precipitation in two different aquaplanet setups and two versions of the ECHAM6.1 atmosphere general circulation model. (a) CMIP5 aquaplanet setup with fixed SSTs and no seasonal cycle. (b) Aquaplanet setup coupled to a slab ocean with a seasonal cycle. The model versions only differ in their representation of moist convection (Nordeng convection for solid line, Tiedtke convection for dashed line; see Moebis and Stevens [2012] for details). While this difference has a large impact for fixed SSTs, its impact is strongly muted for interactive SSTs and a seasonal cycle. The simulations in Figure 1a use the CMIP5 aquaplanet setup [Medeiros et al., 2015], those in Figure 1b the setup of Voigt et al. [2014a, 2014b] with a slab ocean depth of 30 m and a peak ocean heat transport of about 2 PW in the subtropics.
Figure 2.
Figure 2.
Global surface albedo and surface temperature in the AquaControl experiment. The surface albedo is calculated as the ratio of the global and time mean upward and downward shortwave radiative fluxes at the surface.
Figure 3.
Figure 3.
Model median seasonal insolation in (a) LandControl, (b) the difference between LandOrbit and LandControl, and (c) highlighted for the Northern and Southern Hemisphere summer months. Models slightly differ in the seasonal insolation changes because of different calendars, for which reason the model median is shown.
Figure 4.
Figure 4.
(a) q-flux over ocean grid boxes and (b) associated total meridional ocean heat transport. The TRACMIP q-flux is a fourth-order polynomial fit to the observed q-flux shown in gray. The q-flux for simulations with land is set to zero over land, which requires a small decrease of q-flux compared to the aquaplanet simulations to ensure that the global-mean q-flux is zero. As a result of replacing some of the tropical ocean grid boxes with land, the total ocean energy transport is slightly reduced in simulations with land compared to aquaplanet simulations.
Figure 5.
Figure 5.
Model median of annual-mean surface temperature for the five TRACMIP experiments. The continental boundaries for the simulations with land (right column) are indicated by the gray rectangle.
Figure 6.
Figure 6.
Model median of annual-mean precipitation for the five TRACMIP experiments. The continental boundaries for the simulations with land (right column) are indicated by the gray rectangle. The red line is the ITCZ position calculated as the latitude of the model median precipitation centroid between 30°N and 30°S.
Figure 7.
Figure 7.
Model median of annual-mean zonal-mean zonal wind and mass stream function in the five TRACMIP experiments. The zonal wind is shown in colors and the mass stream function in contours. For the mass stream function, solid contours indicate clockwise flow, dashed contours indicate counterclockwise flow, and the contour interval is 20×109 kg s−1.
Figure 8.
Figure 8.
Global precipitation as function of global surface temperature in the AquaControl (no underscore) and LandControl (with underscore) experiments. The cross indicates the present-day (1979–2010) surface temperature of 14.3°C (taken from HadCRUT4) [Morice et al., 2012] and precipitation of 2.7 mm/d (taken from GPCPv2.2) [Adler et al., 2003]. The triangle is the extrapolation of present-day precipitation to warmer climates assuming a 2–3% precipitation increase per degree surface warming.
Figure 9.
Figure 9.
Zonal-mean characteristics of the AquaControl experiment. (a) Annual-mean surface temperature, (b) annual-mean precipitation, (c) seasonal evolution of the ITCZ position, and (d) annual-mean zonal wind at 850 hPa. Individual models are shown by the colored lines, the model median is shown by the thick black line. In Figure 9b the vertical lines show the annual-mean ITCZ position.
Figure 10.
Figure 10.
Impact of the tropical continent on surface temperature: annual-mean surface temperature difference between LandControl and AquaControl. The continent is indicated by the gray box.
Figure 11.
Figure 11.
Impact of the tropical continent on precipitation: annual-mean precipitation temperature difference between LandControl and AquaControl. The continent is indicated by the gray box. To highlight the impact on tropical precipitation, the plot is restricted to latitudes between 40°N and 40°S. The blue and red lines show the location of the precipitation centroid (defined between 30°N/30°S) at every longitude in AquaControl and LandControl, respectively.
Figure 12.
Figure 12.
Climate sensitivity and hydrological sensitivity in the TRACMIP ensemble. (a) Climate sensitivity as estimated by halving the global surface temperature change between the Control and 4xCO2 experiments for aquaplanet simulations (no underscore) and land simulations (with underscore). The numbers give the correlation coefficient and P value. For the aquaplanet simulations, excluding the MPAS model (model 13) leads to an increased correlation coefficient to 0.54 that is statistically significant (P = 0.06). (b) Precipitation change in response to quadrupling CO2 relative to the control precipitation. The line corresponds to a 2.2%/K precipitation increase, which is obtained from a linear regression of the precipitation change on temperature change.
Figure 13.
Figure 13.
Response of the zonal-mean climate to a quadrupling of CO2 in the aquaplanet simulations. The difference between Aqua4xCO2 and AquaControl is shown. (a) Annual-mean surface temperature, (b) annual-mean precipitation, (c) seasonal evolution of the ITCZ position, and (d) annual-mean zonal wind at 850 hPa. Individual models are shown by the colored lines, the model median is shown by the thick black line.
Figure 14.
Figure 14.
ITCZ position as a function of global-mean annual-mean surface temperature in (a) the aquaplanet simulations and (b) the simulations with land. The plot shows both the Control and 4xCO2 simulations. The numbers give the annual-mean ITCZ position for individual models, and the thick solid line is the linear regression of the annual-mean ITCZ position on surface temperature (regression slopes 0.55°/K for aquaplanet and 0.43°/K with land). For each model the 4xCO2 simulation is located to the right of the Control simulation. Moreover, the most northern ITCZ position occurring over the seasonal cycle is shown for each model and for both the Control and 4xCO2 simulation by the crosses, and the regression line through these most northern ITCZ excursions is shown by the upper dashed line (regression slopes 0.30°/K for aquaplanet and 0.24°/K with land). Similarly, the circles are the most southern ITCZ positions and the regression through these is shown by the lower dashed line (regression slopes 0.81°/K for aquaplanet and 0.54°/K with land).
Figure 15.
Figure 15.
Annual-mean precipitation response between 40°N and 40°S to increased CO2 in aquaplanet and land simulations. (a) Zonal-mean response in the aquaplanet setup, (b) longitude-latitude response of the model-median precipitation in the land setup, (c) zonal-mean response in the land setup, and (d) difference between zonal-mean response in the land versus aquaplanet setup. In Figures 15a, 15c, and 15d models are colored according to the color coding introduced in Figure 2; the model median is shown by the thick black line. In Figure 15b, the black line is the model-median ITCZ in LandControl.
Figure 16.
Figure 16.
Response of seasonal precipitation and ITCZ location to a seasonal insolation change (LandOrbit-LandControl) averaged zonally over ocean longitudes (180°W–0°E, 45°E–180°E; left) and land longitudes (0°E–45°E; right). For Figures 16a and 16b the model median is shown and the black lines are the model median LandControl ITCZ calculated over ocean and land longitudes, respectively. For Figures 16c and 16d, the thick black line is the model median change.

References

    1. Adam O, Bischoff T, and Schneider T (2016a), Seasonal and interannual variations of the energy flux equator and ITCZ. Part I: Zonally averaged ITCZ position, J. Clim, 29, 3219–3230, doi:10.1175/JCLI-D-15-0512.1. - DOI
    1. Adam O, Bischoff T, and Schneider T (2016b), Seasonal and interannual variations of the energy flux equator and ITCZ. Part II: Zonally varying shifts of the ITCZ, J. Clim, 29(20), 7281–7293, doi:10.1175/JCLI-D-15-0710.1. - DOI
    1. Adler R, et al. (2003), The version-2 global precipitation climatology project (GPCP) monthly precipitation analysis (1979-present), J. Hydrometeorol, 4(6), 1147–1167, doi:10.1175/1525-7541(2003)004〈1147:TVGPCP〉2.0.CO;2. - DOI
    1. Anderson J, et al. (2004), The new GFDL global atmosphere and land model AM2-LM2: Evaluation with prescribed SST simulations, J. Clim, 17(24), 4641–4673.
    1. Armour KC, Marshall J, Scott JR, Donohoe A, and Newsom ER (2016), Southern Ocean warming delayed by circumpolar upwelling and equatorward transport, Nat. Geosci, doi:10.1038/ngeo2731. - DOI

LinkOut - more resources