. 2020 Aug 7:8:685.
doi: 10.3389/fcell.2020.00685. eCollection 2020.

Inhibiting Heat Shock Protein 90 Protects Nucleus Pulposus-Derived Stem/Progenitor Cells From Compression-Induced Necroptosis and Apoptosis

Affiliations

Inhibiting Heat Shock Protein 90 Protects Nucleus Pulposus-Derived Stem/Progenitor Cells From Compression-Induced Necroptosis and Apoptosis

Binwu Hu et al. Front Cell Dev Biol. .

Abstract

Nucleus pulposus-derived stem/progenitor cells (NPSCs) provide novel prospects for the regeneration of degenerated intervertebral disc (IVD). Nevertheless, with aging and degeneration of IVD, the frequency of NPSCs markedly decreases. Excessive cell death could be the main reason for declined frequency of NPSCs, however, the exact mechanisms remain elusive. Thus, the present study was undertaken to explore the mechanisms of compression-induced NPSCs death, and the effects of heat shock protein 90 (HSP90) on NPSCs survival. Here, we found that compression could trigger receptor-interacting protein kinase 1 (RIPK1)/receptor-interacting protein kinase 3 (RIPK3)/mixed lineage kinase domain-like protein (MLKL)-mediated necroptosis of NPSCs. Furthermore, we found that elevated expression of HSP90 was involved in compression-induced NPSCs death, and inhibiting HSP90 could dramatically attenuate compression-induced necroptosis of NPSCs via regulating the expression and activity of RIPK1/RIPK3/MLKL, and alleviating the mitochondrial dysfunction (mitochondrial membrane potential loss and ATP depletion) and oxidative stress [production of mitochondrial reactive oxygen species (ROS), cellular total ROS and malondialdehyde, and downregulation of superoxide dismutase 2]. Besides necroptosis, compression-induced apoptosis of NPSCs was also attenuated by HSP90 inhibition. In addition, we found that enhanced expression of HSP70 contributed to the cytoprotective effects of inhibiting HSP90. More encouragingly, our results demonstrated that inhibiting HSP90 could also mitigate the exhaustion of NPSCs in vivo. In conclusion, RIPK1/RIPK3/MLKL-mediated necroptosis participates in compression-induced NPSCs death. Furthermore, targeting HSP90 to simultaneously inhibit necroptosis and apoptosis of NPSCs might be an efficient strategy for preventing the death of NPSCs, thus rescuing the endogenous repair capacity of NP tissue.

Keywords: apoptosis; compression; heat shock protein 90; intervertebral disc degeneration; necroptosis; nucleus pulposus-derived stem/progenitor cells.


Figures

FIGURE 1
FIGURE 1
Compression induced necrotic cell death of NPSCs. (A) IHC staining of Tie2 for marking NPSCs in non-degenerated (37 years old, male, grade II) and degenerated (43 years old, male, grade IV) human NP tissues (original magnification: ×400). (B) Cell viability of NPSCs examined by CCK-8 assays. (C) The relative release of LDH at different time points. (D) Representative dot plots of PI staining obtained from flow cytometry analysis of NPSCs. (E) The statistical analysis of PI positive ratio of NPSCs. (F) The morphological ultrastructural appearance of NPSCs observed by TEM. The NPSCs exposed to 48 h of compression displayed necrotic morphological changes, such as severe vacuolation, swelling of organelles and disruption of the plasma membrane. The data were expressed as mean ± SD from at least three independent experiments, and they were analyzed by a two-tailed t-test or ANOVA. (**P < 0.01, ***P < 0.001 vs. 0 h).
FIGURE 2
FIGURE 2
RIPK1/RIPK3/MLKL-mediated necroptosis was involved in compression-induced death of NPSCs. (A) Representative WB graphs of the expression of RIPK1, P-RIPK1, RIPK3, P-RIPK3, MLKL, and P-MLKL. (B) Quantitation of the expression levels of RIPK1, P-RIPK1, RIPK3, P-RIPK3, MLKL, and P-MLKL. (C) The effects of different concentrations of Nec-1, GSK′872 and NSA on cell viability of NPSCs exposed to 0, 24, 36, and 48 h compression measured by CCK-8 assays. (D) Representative dot plots of PI staining obtained from flow cytometry analysis of NPSCs. (E) The statistical analysis of PI positive ratio of NPSCs. The data were expressed as mean ± SD from at least three independent experiments, and they were analyzed by a two-tailed t-test. (*P < 0.05, **P < 0.01, ***P < 0.001 vs. 0 h, 0 μM or control, NS, not significant).
FIGURE 3
FIGURE 3
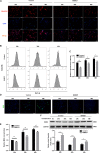
Inhibition of HSP90 attenuated compression-induced NPSCs death. (A,B) The expression levels of HSP90AA1 (A) and HSP90AB1 (B) measured by RT-PCR in human NPSCs. Data were normalized to GAPDH. (C) Representative WB graphs and quantitation of the expression level of HSP90. (D) The effects of different concentrations of BIIB021 on cell viability of NPSCs exposed to 0, 24, 36, and 48 h compression measured by CCK-8 assays. (E) Typical fluorescence photomicrograph of live/dead cell staining of NPSCs. Green fluorescent signaling (Calcien-AM) indicates live cells and red fluorescent signaling (PI) indicates dead cells (original magnification: ×200). (F) The effects of SiHSP90β on cell viability of NPSCs exposed to 24, 36, and 48 h compression measured by CCK-8 assays. The data were expressed as mean ± SD from at least three independent experiments, and they were analyzed by a two-tailed t-test. (*P < 0.05, **P < 0.01, ***P < 0.001 vs. 0 h, 0 μM or NC, NS, not significant).
FIGURE 4
FIGURE 4
Enhanced expression of HSP70 contributed to the cytoprotective effects of inhibiting HSP90. (A) Representative WB graphs and quantitation of the expression levels of HSP70. (B) The representative fluorescence photomicrograph of HSP70 expression detected by immunofluorescence staining (original magnification: ×400). (C) Representative WB graphs and quantitation of the expression levels of JNK and P-JNK. (D) Ver partly reversed the protective effects of BIIB021 on NPSCs exposed to 24, 36, and 48 h compression measured by CCK-8 assay. The data were expressed as mean ± SD from at least three independent experiments, and they were analyzed by a two-tailed t-test. (*P < 0.05, **P < 0.01, ***P < 0.001 vs. control or Ver 0 nM+BIIB021 100 nM group, NS, not significant).
FIGURE 5
FIGURE 5
Inhibiting HSP90 suppressed compression-induced necroptosis of NPSCs. (A) The representative fluorescence photomicrograph of HSP90 and P-MLKL expression detected by immunofluorescence staining (original magnification: ×400). (B) Representative dot plots of PI staining obtained from flow cytometry analysis of NPSCs. (C) The statistical analysis of PI positive ratio of NPSCs. (D) The morphological ultrastructural appearance of NPSCs exposed to 48 h compression observed by TEM. (E,F) Representative WB graphs and quantitation of the expression levels of RIPK1, P-RIPK1, RIPK3, P-RIPK3, MLKL, and P-MLKL. (G,H) Representative WB graphs and quantitation of the expression levels of RIPK1, P-RIPK1, RIPK3, P-RIPK3, MLKL, and P-MLKL. The data were expressed as mean ± SD from three independent experiments, and they were analyzed by a two-tailed t-test. [*P < 0.05, **P < 0.01, ***P < 0.001 vs. control or BIIB021 (G,H)].
FIGURE 6
FIGURE 6
Inhibiting HSP90 attenuated compression-induced mitochondrial dysfunction of NPSCs. (A) Representative dot plots of JC-1 staining obtained from flow cytometry analysis of NPSCs for detecting the MMP. (B) The statistical analysis of MMP which was expressed as the ratio of JC-1 monomer. (C) Typical fluorescence photomicrograph of JC-1 staining in NPSCs (original magnification: ×200). (D) The protective effects of BIIB021 on compression-induced ATP depletion of NPSCs. The data were expressed as mean ± SD from three independent experiments, and they were analyzed by a two-tailed t-test. (*P < 0.05, **P < 0.01, ***P < 0.001 vs. control).
FIGURE 7
FIGURE 7
Inhibiting HSP90 alleviated compression-induced oxidative stress of NPSCs. (A) Typical fluorescence photomicrograph of mtROS in NPSCs probed by MitoSOX red (original magnification: ×200). (B) Representative dot plots of DCFH-DA staining obtained from flow cytometry analysis of NPSCs for detecting cellular ROS. (C) The statistical analysis of cellular ROS. (D) Typical fluorescence photomicrograph of cellular ROS in NPSCs (original magnification: ×200). (E) The relative content of intracellular MDA. (F) Representative WB graphs and quantitation of the expression levels of SOD2. The data were expressed as mean ± SD from three independent experiments, and they were analyzed by a two-tailed t-test. (*P < 0.05, **P < 0.01, ***P < 0.001 vs. control).
FIGURE 8
FIGURE 8
Inhibiting HSP90 protected NPSCs from compression-induced apoptosis. (A) Representative dot plots of Annexin V-FITC/PI staining obtained from flow cytometry analysis of NPSCs. The Annexin + /PI- and Annexin + /PI+ represent apoptotic cells. (B) The statistical analysis of apoptosis ratio of NPSCs. (C) Typical fluorescence photomicrograph of TUNEL staining of NPSCs (original magnification: ×200). (D) Representative WB graphs of the expression of Bcl-2, Bax, PARP, cleaved PARP, caspase3, and cleaved caspase3. (E) Quantitation of the ratio of Bcl-2/Bax and the expression levels of cleaved PARP, and cleaved caspase3. The data were expressed as mean ± SD from three independent experiments, and they were analyzed by a two-tailed t-test. (*P < 0.05, **P < 0.01, ***P < 0.001 vs. control, NS, not significant).
FIGURE 9
FIGURE 9
Inhibiting HSP90 attenuated the exhaustion of NPSCs in vivo. Hematoxylin and eosin staining (original magnification: ×25) and the IHC staining of Tie2 (original magnification: ×25 and 400) for labeling endogenous NPSCs of IVDs.
FIGURE 10
FIGURE 10
The schematic representation of the effects of HSP90 on compression-induced NPSCs death.

Similar articles

Cited by

References

    1. Alani B., Salehi R., Sadeghi P., Zare M., Khodagholi F., Arefian E., et al. (2014). Silencing of Hsp90 chaperone expression protects against 6-hydroxydopamine toxicity in PC12 cells. J. Mol. Neurosci. 52 392–402. 10.1007/s12031-013-0163-9 - DOI - PubMed
    1. Arya R., Mallik M., Lakhotia S. C. (2007). Heat shock genes - integrating cell survival and death. J. Biosci. 32 595–610. 10.1007/s12038-007-0059-3 - DOI - PubMed
    1. Buckwalter J. A. (1995). Aging and degeneration of the human intervertebral disc. Spine 20 1307–1314. 10.1097/00007632-199506000-00022 - DOI - PubMed
    1. Chen S., Lv X., Hu B., Shao Z., Wang B., Ma K., et al. (2017). RIPK1/RIPK3/MLKL-mediated necroptosis contributes to compression-induced rat nucleus pulposus cells death. Apoptosis 22 626–638. 10.1007/s10495-017-1358-2 - DOI - PubMed
    1. Chen S., Lv X., Hu B., Zhao L., Li S., Li Z., et al. (2018). Critical contribution of RIPK1 mediated mitochondrial dysfunction and oxidative stress to compression-induced rat nucleus pulposus cells necroptosis and apoptosis. Apoptosis 23 299–313. 10.1007/s10495-018-1455-x - DOI - PubMed