. 2020 Aug 12;6(33):eaaz6477.
doi: 10.1126/sciadv.aaz6477. eCollection 2020 Aug.

EED-mediated histone methylation is critical for CNS myelination and remyelination by inhibiting WNT, BMP, and senescence pathways

Affiliations

EED-mediated histone methylation is critical for CNS myelination and remyelination by inhibiting WNT, BMP, and senescence pathways

Jiajia Wang et al. Sci Adv. .

Abstract

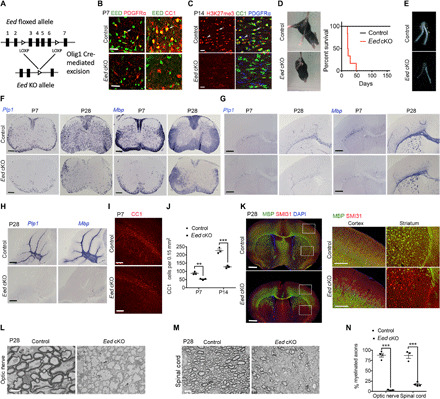
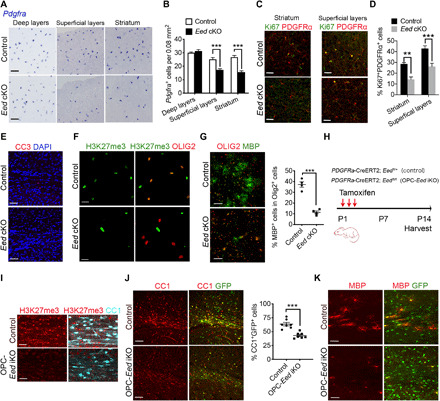
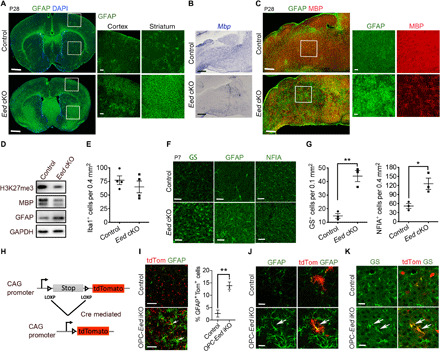
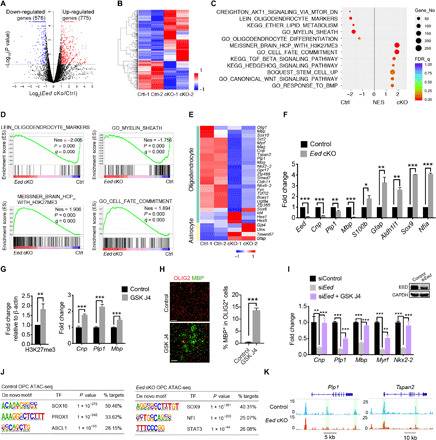
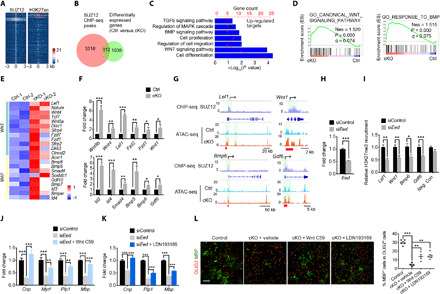
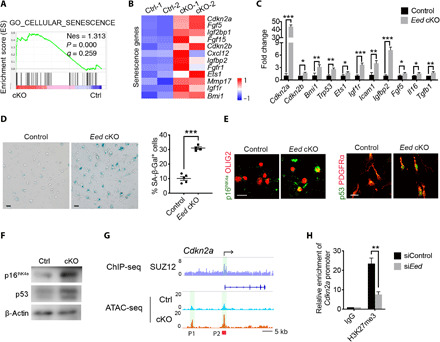
Mutations in the polycomb repressive complex 2 (PRC2) can cause Weaver-like syndrome, wherein a patient cohort exhibits abnormal white matter; however, PRC2 functions in CNS myelination and regeneration remain elusive. We show here that H3K27me3, the PRC2 catalytic product, increases during oligodendrocyte maturation. Depletion of embryonic ectoderm development (EED), a core PRC2 subunit, reduces differentiation of oligodendrocyte progenitors (OPCs), and causes an OPC-to-astrocyte fate switch in a region-specific manner. Although dispensable for myelin maintenance, EED is critical for oligodendrocyte remyelination. Genomic occupancy and transcriptomic analyses indicate that EED establishes a chromatin landscape that selectively represses inhibitory WNT and bone morphogenetic protein (BMP) signaling, and senescence-associated programs. Blocking WNT or BMP pathways partially restores differentiation defects in EED-deficient OPCs. Thus, our findings reveal that EED/PRC2 is a crucial epigenetic programmer of CNS myelination and repair, while demonstrating a spatiotemporal-specific role of PRC2-mediated chromatin silencing in shaping oligodendrocyte identity and lineage plasticity.


Figures

Fig. 1
Fig. 1. Eed cKO mice develop myelination defects in the CNS.
(A) Diagram depicting generation of Eed cKO mice. (B) Immunostaining for EED, PDGFRα, and CC1 in control and Eed cKO spinal cords at P7. (C) Immunostaining for H3K27me3, CC1, and PDGFRα in control and Eed cKO brains at P14. Arrows indicate H3K27me3+CC1+ OLs; arrowheads indicate H3K27me3+ PDGFRα+ OPCs. (D and E) Photographs of control and Eed cKO mice, survival curves, and optic nerves at P28. (F to H) In situ hybridization analyses for Plp1 and Mbp in the spinal cord, brain, and cerebellum from control and Eed cKO mice. (I and J) Immunostaining for CC1 (I) and quantification of CC1+ OLs (J) in control and Eed cKO brains (n = 3 animals per genotype). (K) P28 control and Eed cKO brains immunolabeled for MBP and SMI31 are shown on the left. Boxed regions are magnified to the right. (L to N) Electron micrographs (L and M) and quantification of myelinated axons (N) in P28 control and Eed cKO optic nerves and spinal cords (n > 3 animals per genotype). Scale bars, 20 μm (B and C), 200 μm (F to I), 1 mm (K), 1 μm (L), and 4 μm (M). Data are means ± SEM. **P < 0.01, ***P < 0.001. DAPI, 4′,6-diamidino-2-phenylindole. Photo credit: Jiajia Wang, CCHMC.
Fig. 2
Fig. 2. Eed deletion impairs OPC proliferation and differentiation.
(A and B) In situ hybridization for Pdgfra (A) and quantification of Pdgfra+ OPCs (B) in different brain regions from control and Eed cKO mice at P7 (n = 4 animals per genotype). (C and D) Immunolabeled for Ki67 and PDGFRα (C) and quantification of Ki67+ PDGFRα+ cells (D) in the striatum and superficial layers from P7 control and Eed cKO brains (n = 4 animals per genotype). (E) P14 control and Eed cKO brains labeled for cleaved caspase 3 (CC3) and DAPI. (F) Immunostaining for H3K27me3 and OLIG2 in OPCs isolated from control and Eed cKO cortices. (G) Control and Eed cKO OPCs treated with T3 for 3 days and immunostained for OLIG2, MBP (left). The percentages of MBP+ cells relative to OLIG2+ cells (right, n = 4 independent experiments). (H) Diagram depicting tamoxifen administration strategy on control and OPC-Eed iKO mice. (I) Control and OPC-Eed iKO brains at P14 stained for H3K27me3 and CC1. (J) Immunolabeling for CC1 (left) and quantification of CC1+GFP+ cells (right) in control and OPC-Eed iKO brains at P14 (n = 7 animals per genotype). (K) The white matter of control and OPC-Eed iKO mice at P7 stained for MBP. Scale bars, 50 μm (A), 60 μm (C, I, and K), 100 μm (E, G, and J), and 20 μm (F). Data are means ± SEM. **P < 0.01, ***P < 0.001. Photo credit: Jiajia Wang, CCHMC.
Fig. 3
Fig. 3. EED regulates OPC and astrocyte fate switch.
(A) Control and Eed cKO forebrains at P28 stained for GFAP are shown on the left. Boxed areas are magnified to the right. (B) In situ hybridization for Mbp in brainstems from control and Eed cKO mice at P28. (C) The brainstems of control and Eed cKO mice at P28 immunostained for MBP and GFAP are shown on the left. Boxed areas are magnified to the right. (D) Western blot of H3K27me3, MBP, and GFAP from control and Eed cKO brains at P14. (E) Quantification of Iba1+ cells in control and Eed cKO cortices at P28 (n = 4 animals per genotype). (F and G) Immunolabeling for glutamine synthetase (GS), GFAP, and NFIA (F) and quantification of GS+ and NFIA+ astrocytes (G) in control and Eed cKO cortices at P7 (n = 3 animals per genotype). (H) Diagram showing Cre-mediated activation of Tomato after tamoxifen administration. (I) Immunostaining for GFAP (left) and quantification of GFAP+Tomato+ astrocytes (right) in the cortices of control and OPC-Eed iKO mice at P14 (n = 3 animals per genotype). (J and K) Control and OPC-Eed iKO cortices at P14 stained for GFAP (J) or GS (K). Scale bars, 1 mm (A, left; C, left), 100 μm (A, right; B and C, right), 60 μm (F and I), and 20 μm (J and K). Data are means ± SEM. *P < 0.05, **P < 0.01. Photo credit: Jiajia Wang, CCHMC.
Fig. 4
Fig. 4. EED is required for remyelination after LPC injury.
(A) Immunostaining for EED or H3K27me3 in control and LPC-treated spinal cords. (B and C) Control or LPC-treated spinal cords immunolabeled for EED, H3K27me3, and OLIG2 or PDGFRα or CC1 or GFAP or CD11b. (D) Diagram showing tamoxifen and LPC administration schedule. (E) Immunostaining for H3K27me3 in control and OPC-Eed iKO lesions at dpl 14. (F) In situ hybridization for Mbp and Plp1 (left) and quantification of Plp1+ cells (right) in control and OPC-Eed iKO lesions at dpl 14 (n > 3 animals per genotype). (G) Lesions from control and OPC-Eed iKO spinal cords stained for MBP. (H) Immunostaining for CC1 (left) and quantification of CC1+ cells (right) in lesions from control and OPC-Eed iKO spinal cords (n > 3 animals per genotype). (I) Electron micrographs of LPC lesions (left) and quantification of remyelinated axons (right) in control and OPC-Eed iKO spinal cords at dpl 14 (n > 3 animals per genotype). (J) In situ hybridization for Pdgfra (left) and quantification of Pdgfra+ cells (right) in lesions from control and OPC-Eed iKO mice at dpl 14 (n > 3 animals per genotype). (K) Control and OPC-Eed iKO lesions at dpl 14 stained for GFAP; arrows indicate GFAP+Tomato+ cells. Scale bars, 60 μm (A, E, G, and H), 30 μm (B, C, and K), 100 μm (F and J), and 2 μm (I). Data are means ± SEM. *P < 0.05, ***P < 0.001. Photo credit: Jiajia Wang, CCHMC.
Fig. 5
Fig. 5. EED controls a regulatory network necessary for OPC differentiation.
(A) Volcano plot of genes differentially regulated in Eed cKO OPCs (n = 2 experiments; fold change, >1.5; P < 0.05). (B) Heatmap of differentially expressed genes in Eed cKO OPCs from six animals per genotype. (C) GSEA of genes enriched in control or Eed cKO OPCs; NES, net enrichment score. (D) GSEA plots of indicated signature genes. (E and F) Heatmap (E) and quantitative real-time PCR (qRT-PCR) analyses (F, n = 3 experiments) of representative OL and astrocyte genes that are differentially expressed in Eed cKO OPCs. (G) Normalized expression of H3K27me3 relative to β-actin in control and GSK J4–treated Oli-neu cells for 48 hours (left). qRT-PCR analyses of myelination-associated genes (right), n = 3 experiments. (H) Immunostaining for OLIG2 and MBP (left) and quantification of MBP+ cells (right) in mouse OPCs treated with GSK J4 for 48 hours (n = 3 experiments). Scale bars, 100 μm. (I) qRT-PCR analyses of myelination-associated genes in Oli-neu cells treated with siEed or with siEed and GSK-J4 for 48 hours (n = 3 experiments). Western blot of EED to show the knockdown efficiency. (J) De novo motif analysis of ATAC-seq data of control and Eed cKO OPCs. (K) Representative ATAC-seq tracks for OL differentiation genes in control and Eed cKO OPCs. Data are means ± SEM. *P < 0.05, **P < 0.01, ***P < 0.001. Photo credit: Jiajia Wang, CCHMC.
Fig. 6
Fig. 6. Wnt and BMP signaling pathways are up-regulated in Eed-deficient OPCs.
(A) Heatmaps of ±3 kb around SUZ12 and H3K27ac ChIP-seq peak centers from WT OPCs. (B) Venn diagram showing the overlap between SUZ12-bound and differentially expressed genes in Eed cKO OPCs. (C) Enrichment analyses of EED targets that up-regulated in Eed-deleted OPCs. (D) GSEA plots of WNT and BMP pathway signatures. (E and F) Heatmap (E) and qRT-PCR analyses (F, n = 3 experiments) of genes associated with WNT and BMP pathways up-regulated in Eed cKO OPCs. (G) Representative SUZ12 ChIP-seq in rat OPCs and ATAC-seq tracks of indicated genes in control and Eed cKO OPCs. (H) qRT-PCR analyses of Eed in Oli-neu cells at 48 hours after transfection with siControl or siEed (n = 3 experiments). (I) ChIP-qPCR analyses for H3K27me3 enrichment at the promoters of indicated genes in Oli-neu cells treated with siControl or siEed (n = 3 experiments). (J and K) qRT-PCR analyses of myelination-associated genes in Oli-neu cells treated with siControl, siEed, or siEed together with either Wnt C59 or LDN193189 for 48 hours (n = 3 experiments). (L) Immunostaining for OLIG2 and MBP (left) or quantification of MBP+ cells (right) in control and Eed cKO OPCs treated with Wnt C59 or LDN193189 for 3 days (n > 3 experiments). Scale bars, 100 μm. Data are means ± SEM. *P < 0.05, **P < 0.01, ***P < 0.001. Photo credit: Jiajia Wang, CCHMC.
Fig. 7
Fig. 7. Cell senescence pathways are elevated in Eed-deficient OPCs.
(A) GSEA plots of cellular senescence genes enriched in Eed cKO OPCs. (B) Heatmaps of senescence-associated genes up-regulated in Eed cKO OPCs. (C) qRT-PCR analyses of senescence-associated genes and SASP genes in control and Eed cKO mouse OPCs acutely isolated from cortices at P5 (n = 3 experiments). (D) Representative images of control and Eed cKO OPCs subjected to 5-bromo-4-chloro-3-indolyl-b-D-galactopyranoside (X-Gal) staining. Blue cells are senescence cells (left). Quantification of the percentage of SA-β-Gal+ OPCs (right, n = 5 experiments). (E) Representative images of control and Eed cKO mouse OPCs stained for p16INK4a, OLIG2, p53, and PDGFRα. (F) Western blot of p53, p16INK4a, and β-actin from lysates of OPCs from control and Eed cKO mice. (G) Representative SUZ12 ChIP-seq in rat OPCs and ATAC-seq tracks at the promoter of Cdkn2a in the control and Eed cKO OPCs. P1 and P2, open chromatin sites. (H) ChIP-qPCR analysis of H3K27me3 enrichment at the promoter region of the Cdkn2a gene in control and siEed-treated Oli-neu cells (n = 3 experiments). Scale bars, 20 μm (D and E). Data are means ± SEM. *P < 0.05, **P < 0.01, ***P < 0.001. IgG, immunoglobulin G. Photo credit: Jiajia Wang, CCHMC.

References

    1. Chen T., Dent S. Y. R., Chromatin modifiers and remodellers: Regulators of cellular differentiation. Nat. Rev. Genet. 15, 93–106 (2014). - PMC - PubMed
    1. Laugesen A., Helin K., Chromatin repressive complexes in stem cells, development, and cancer. Cell Stem Cell 14, 735–751 (2014). - PubMed
    1. Yu J.-R., Lee C.-H., Oksuz O., Stafford J. M., Reinberg D., PRC2 is high maintenance. Genes Dev. 33, 903–935 (2019). - PMC - PubMed
    1. Margueron R., Justin N., Ohno K., Sharpe M. L., Son J., Drury W. J. III, Voigt P., Martin S. R., Taylor W. R., De Marco V., Pirrotta V., Reinberg D., Gamblin S. J., Role of the polycomb protein EED in the propagation of repressive histone marks. Nature 461, 762–767 (2009). - PMC - PubMed
    1. Cao R., Wang L., Wang H., Xia L., Erdjument-Bromage H., Tempst P., Jones R. S., Zhang Y., Role of histone H3 lysine 27 methylation in Polycomb-group silencing. Science 298, 1039–1043 (2002). - PubMed

Publication types