. 2020 Aug 14;6(33):eabb5093.
doi: 10.1126/sciadv.abb5093. eCollection 2020 Aug.

3D bioprinting spatiotemporally defined patterns of growth factors to tightly control tissue regeneration

Affiliations

3D bioprinting spatiotemporally defined patterns of growth factors to tightly control tissue regeneration

Fiona E Freeman et al. Sci Adv. .

Abstract

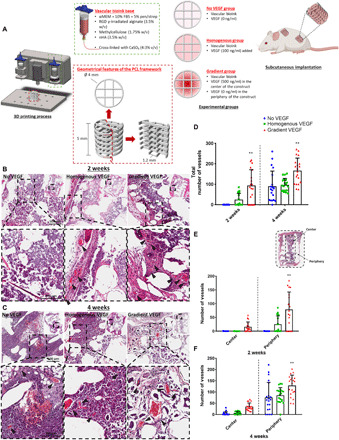
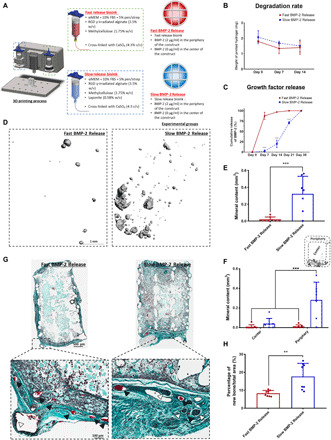
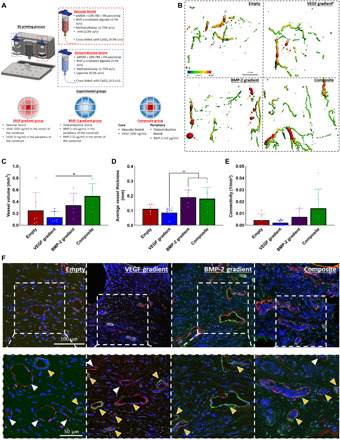
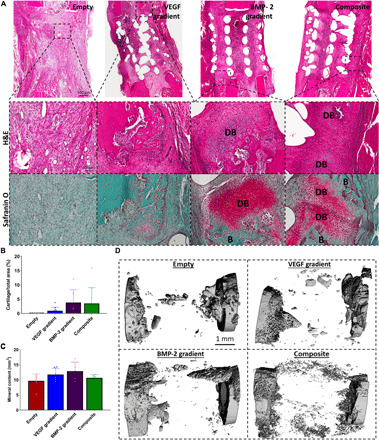
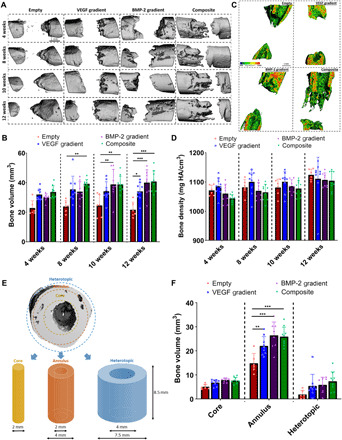
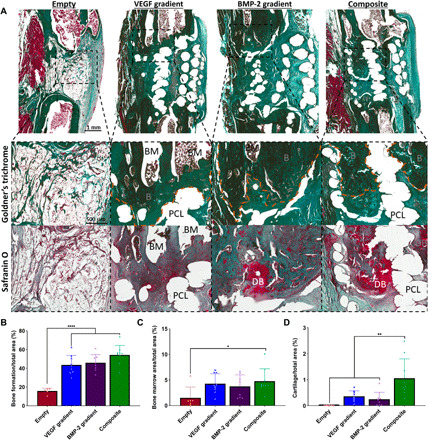
Therapeutic growth factor delivery typically requires supraphysiological dosages, which can cause undesirable off-target effects. The aim of this study was to 3D bioprint implants containing spatiotemporally defined patterns of growth factors optimized for coupled angiogenesis and osteogenesis. Using nanoparticle functionalized bioinks, it was possible to print implants with distinct growth factor patterns and release profiles spanning from days to weeks. The extent of angiogenesis in vivo depended on the spatial presentation of vascular endothelial growth factor (VEGF). Higher levels of vessel invasion were observed in implants containing a spatial gradient of VEGF compared to those homogenously loaded with the same total amount of protein. Printed implants containing a gradient of VEGF, coupled with spatially defined BMP-2 localization and release kinetics, accelerated large bone defect healing with little heterotopic bone formation. This demonstrates the potential of growth factor printing, a putative point of care therapy, for tightly controlled tissue regeneration.


Figures

Fig. 1
Fig. 1. Enhanced vessel infiltration and angiogenesis due to distinct VEGF gradient.
(A) Schematic of the 3D printed scaffold and experimental groups. Construct design (4 mm in diameter, 5 mm in height). H&E-stained sections of the three experimental groups at (B) 2 and (C) 4 weeks in vivo. Images were taken at 20×. Arrows denote vessels. (D) Total number of vessels of the experimental groups at 2 and 4 weeks in vivo. Number of vessels present in the center versus the periphery at (E) 2 and (F) 4 weeks in vivo. **P < 0.01. Error bars denote SDs (n = 8 animals; n = 5 slices per animal). FBS, fetal bovine serum; pen/strep, penicillin/streptomycin.
Fig. 2
Fig. 2. Localized-temporal delivery of BMP-2 led to controlled bone formation.
(A) Schematic of the experimental groups. Construct design (4 mm in diameter, 5 mm in height). αMEM, alpha minimum essential medium. (B) Degradation of the two bioinks. (C) Cumulative release of BMP-2 of the fast release bioink versus the slow release bioink. (D) 3D reconstructions of the μCT data for each group at 8 weeks. (E) μCT analysis on total mineral deposition of each of the groups after 8 weeks in vivo. (F) μCT analysis on the location of mineral deposition of each of the groups after 8 weeks in vivo. ***P < 0.001; error bars denote SDs (n = 8 animals). (G) Goldner’s trichrome–stained sections of both groups after 8 weeks in vivo. Images were taken at 20×. White arrows denote developing bone tissue, and black arrows denote blood vessels. (H) Quantification of the amount of new bone formation per total area. Error bars denote SDs; **P < 0.01 (n = 8 animals, n = 6 slices per animal).
Fig. 3
Fig. 3. Spatiotemporal delivery of both VEGF and BMP-2 led to enhanced angiogenesis.
(A) Schematic of the 3D printed experimental groups including key features of the developed bioinks and the segmental defect procedure. Construct design (4 mm in diameter, 5 mm in height). (B) μCT angiography representative images of vessel diameter. Red arrows denote leaky blood vessels denoted by pools of contrast agent. Quantification on (C) total vessel volume, (D) average vessel diameter, and (E) connectivity for all groups after 2 weeks in vivo. *P < 0.05 and **P < 0.01; error bars denote SDs (n = 9 animals). (F) Immunohistochemical staining of nuclei (blue), vWF (red), and α–SMA (green) of the experimental groups at 2 weeks after implantation. Images were taken at 40× and 63×. Yellow arrows denote vessels with α–SMA and vWF dual staining; white arrows denote slightly less mature vessels with only vWF positive staining.
Fig. 4
Fig. 4. Temporal delivery of exogenous BMP-2 induces early bone healing via an endochondral ossification process.
(A) H&E- and Safranin O–stained sections of all groups after 2 weeks in vivo. Images were taken at 20×. DB denotes cartilage undergoing endochondral ossification to become developing bone, and B denotes positive new bone tissue. Quantification of the amount of (B) bone formation and (C) developing bone per total area. Error bars denote SDs (n = 9 animals). (D) μCT reconstructed images of the defect site.
Fig. 5
Fig. 5. Spatiotemporal delivery of both VEGF and BMP-2 led to enhanced bone tissue distribution 12 weeks after scaffold implantation.
(A) Reconstructed in vivo μCT analysis of bone formation in the defects. (B) Quantification of total bone volume (mm3) in the defects at each time point. (C) Representative images of μCT bone densities in the defects at 12 weeks halfway through the defect (scale bar, 1 mm throughout). (D) Average bone density (mg HA/cm3) in the defects at each time point. (E) Outline of ROI bone volume analysis including definitions of core, annulus, and heterotopic regions. (F) Total bone volume (mm3) in each region at 12 weeks. **P < 0.01, ***P < 0.001, and ****P < 0.0001; error bars denote SDs (n = 9 animals).
Fig. 6
Fig. 6. Spatiotemporal delivery of both VEGF and BMP-2 led to enhanced bone healing and tissue morphology 12 weeks after scaffold implantation.
(A) Goldner’s trichrome– and Safranin O–stained sections of all groups after 12 weeks in vivo. Images were taken at 20×. BM denotes bone marrow. PCL denotes areas where the PCL frame was. DB denotes cartilage undergoing endochondral ossification to become new bone, and B denotes positive bone tissue. Quantification of the amount of (B) bone formation, (C) bone marrow, and (D) developing bone per total area. Error bars denote SDs. *P < 0.05, **P < 0.01, and ****P < 0.0001 (n = 9 animals).

References

    1. Simons M., Ware J. A., Therapeutic angiogenesis in cardiovascular disease. Nat. Rev. Drug Discov. 2, 863–871 (2003). - PubMed
    1. Henry T. D., Annex B. H., McKendall G., Azrin M. A., Lopez J. J., Giordano F. J., Shah P. K., Willerson J. T., Benza R. L., Berman D. S., Gibson C. M., Bajamonde A., Rundle A. C., Fine J., McCluskey E.; VIVA Investigators , The VIVA trial: Vascular endothelial growth factor in ischemia for vascular angiogenesis. Circulation 107, 1359–1365 (2003). - PubMed
    1. Epstein N. E., Complications due to the use of BMP/INFUSE in spine surgery: The evidence continues to mount. Surg. Neurol. Int. 4, S343–S352 (2013). - PMC - PubMed
    1. Shields L. B. E., Raque G. H., Glassman S. D., Campbell M., Vitaz T., Harpring J., Shields C. B., Adverse effects associated with high-dose recombinant human bone morphogenetic protein-2 use in anterior cervical spine fusion. Spine 31, 542–547 (2006). - PubMed
    1. Lee K., Silva E. A., Mooney D. J., Growth factor delivery-based tissue engineering: General approaches and a review of recent developments. J. R. Soc. Interface 8, 153–170 (2011). - PMC - PubMed

Publication types

LinkOut - more resources