

Collaborative Cross mice reveal extreme epilepsy phenotypes and genetic loci for seizure susceptibility
- PMID: 32852103
- PMCID: PMC8011945
- DOI: 10.1111/epi.16617
Collaborative Cross mice reveal extreme epilepsy phenotypes and genetic loci for seizure susceptibility
Abstract
Objective: Animal studies remain essential for understanding mechanisms of epilepsy and identifying new therapeutic targets. However, existing animal models of epilepsy do not reflect the high level of genetic diversity found in the human population. The Collaborative Cross (CC) population is a genetically diverse recombinant inbred panel of mice. The CC offers large genotypic and phenotypic diversity, inbred strains with stable genomes that allow for repeated phenotypic measurements, and genomic tools including whole genome sequence to identify candidate genes and candidate variants.
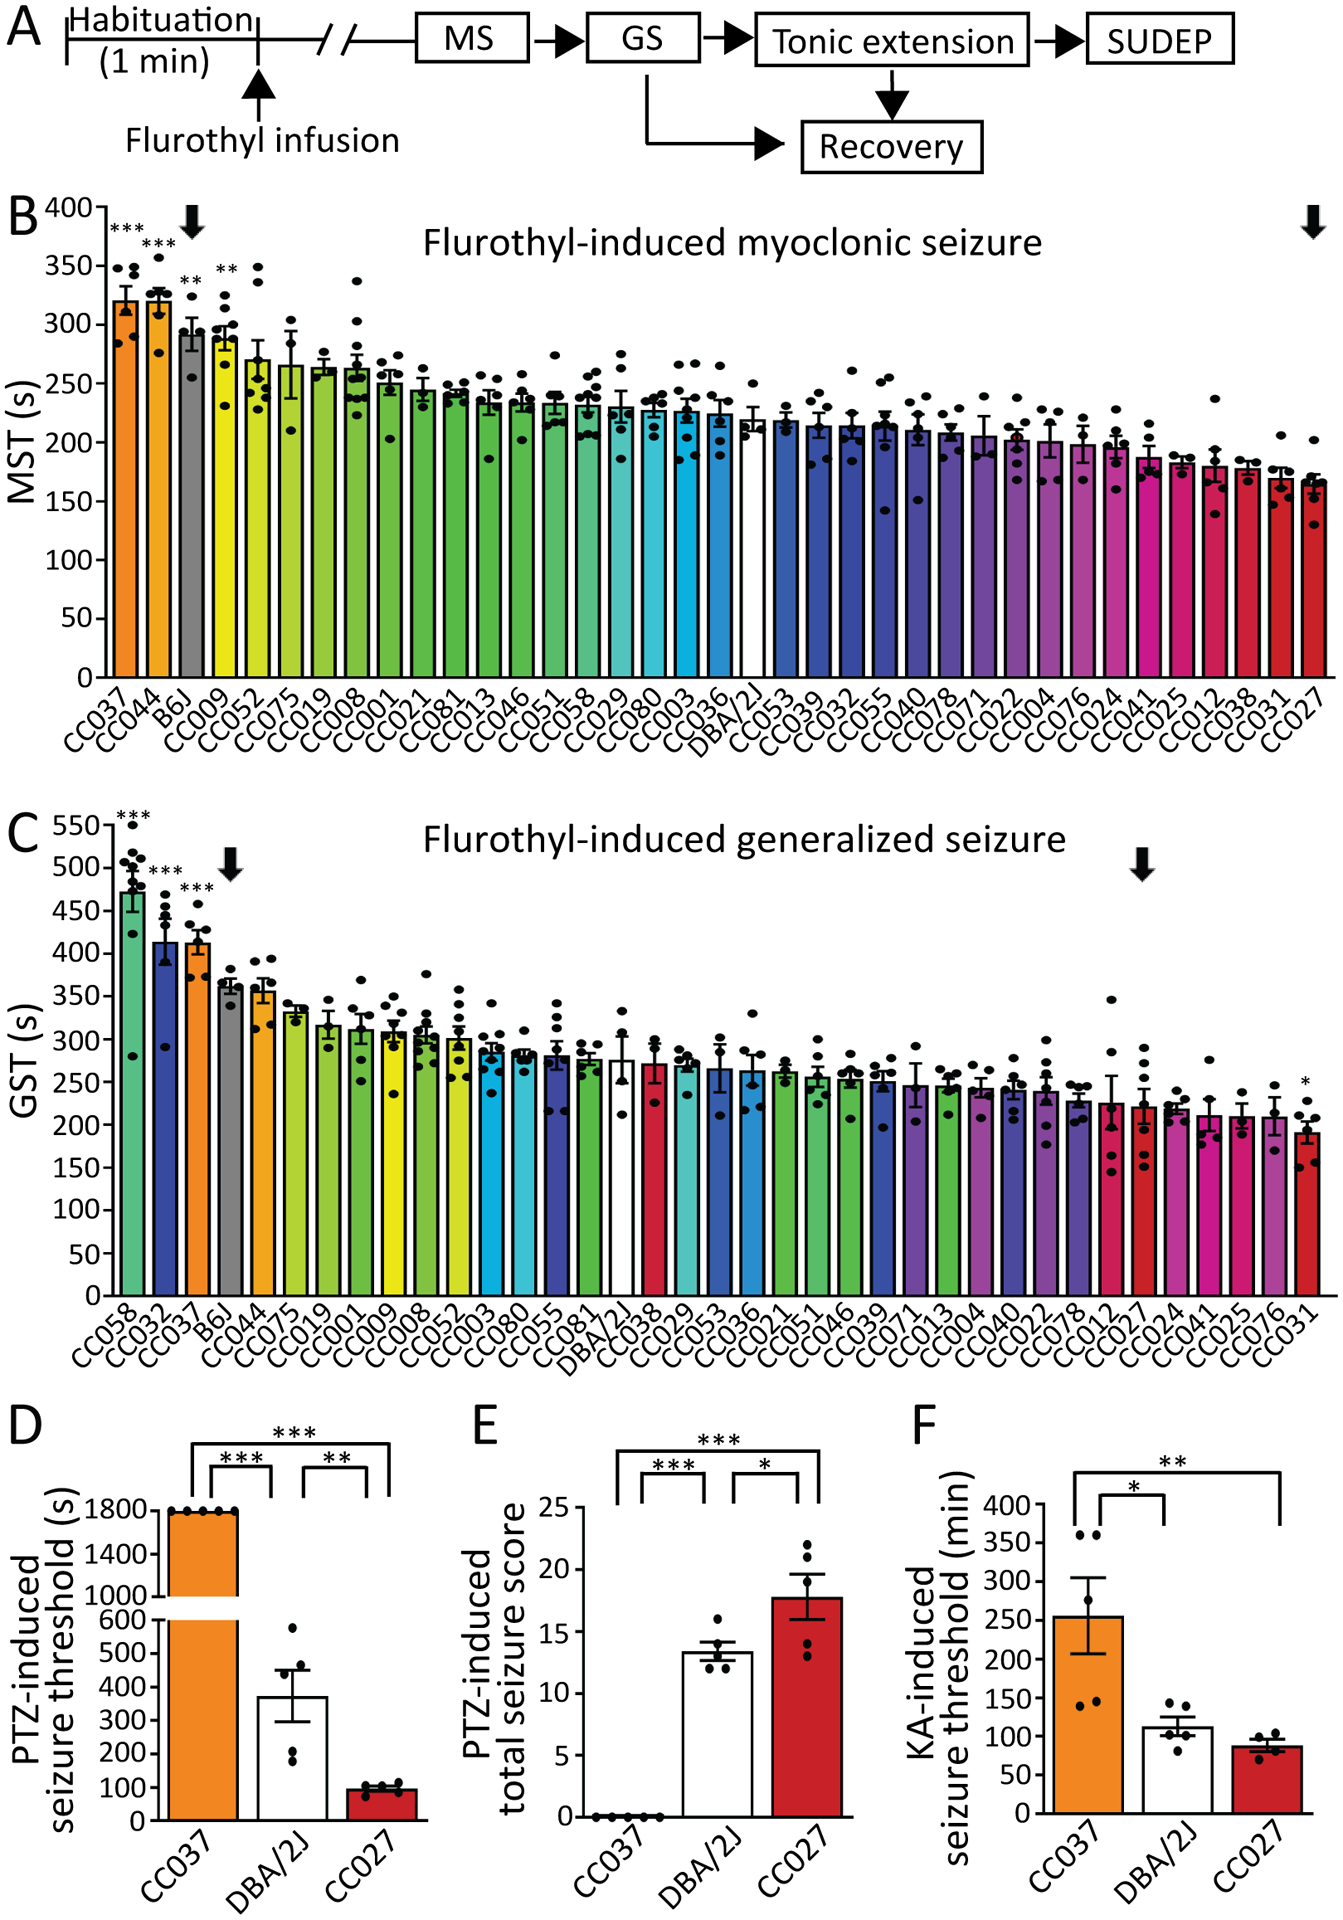
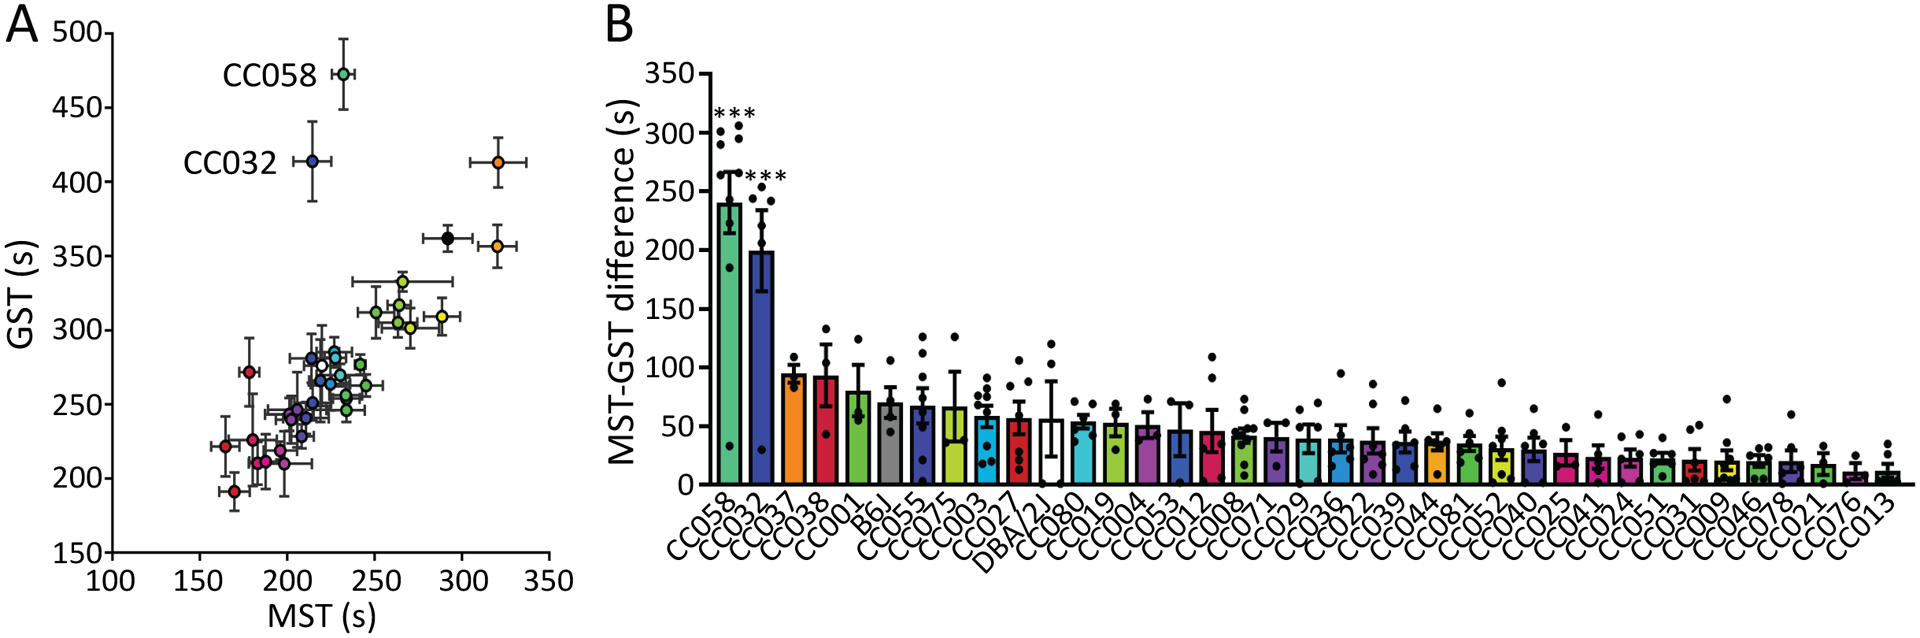
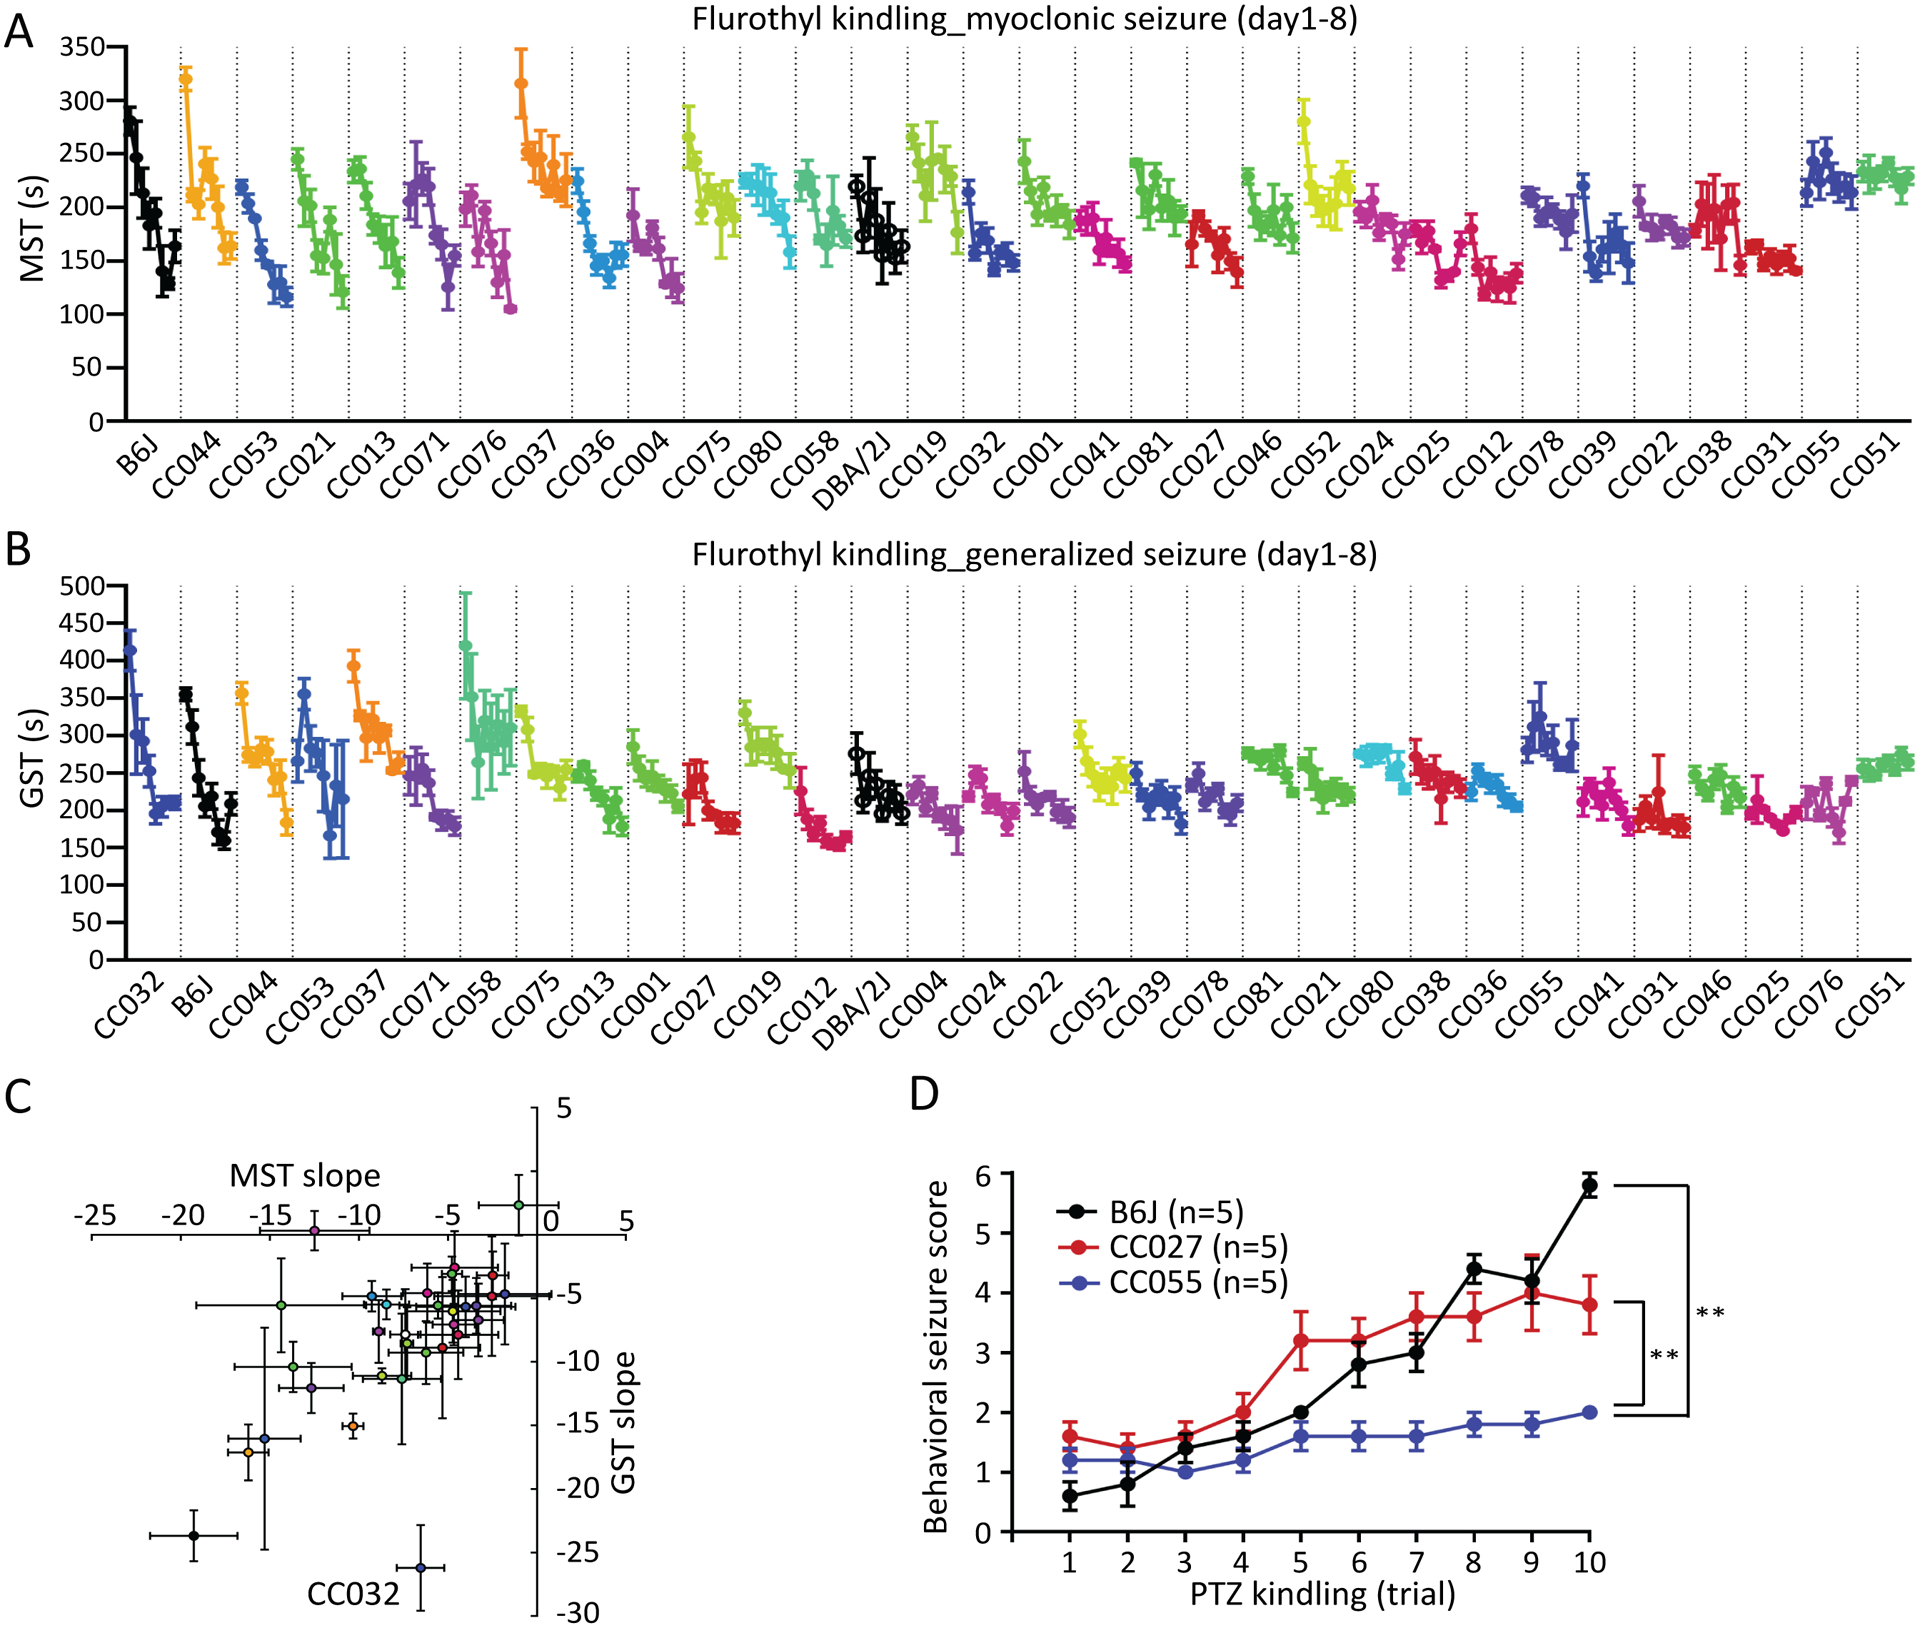
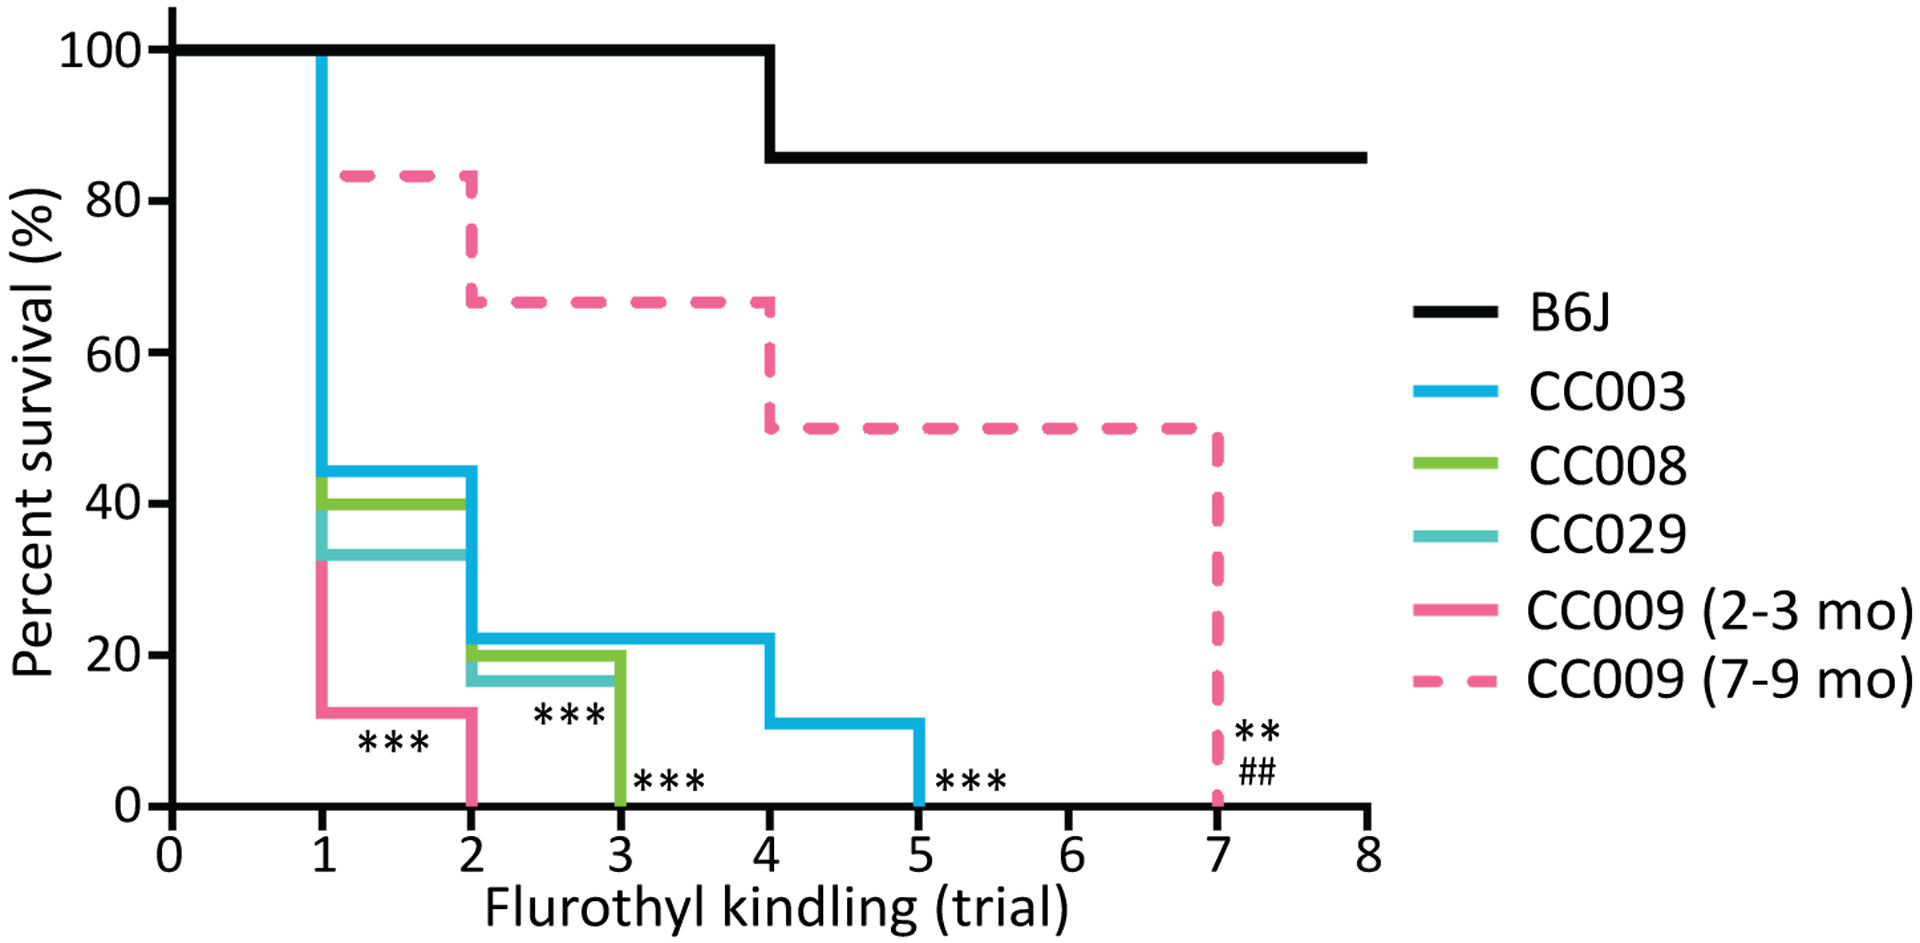
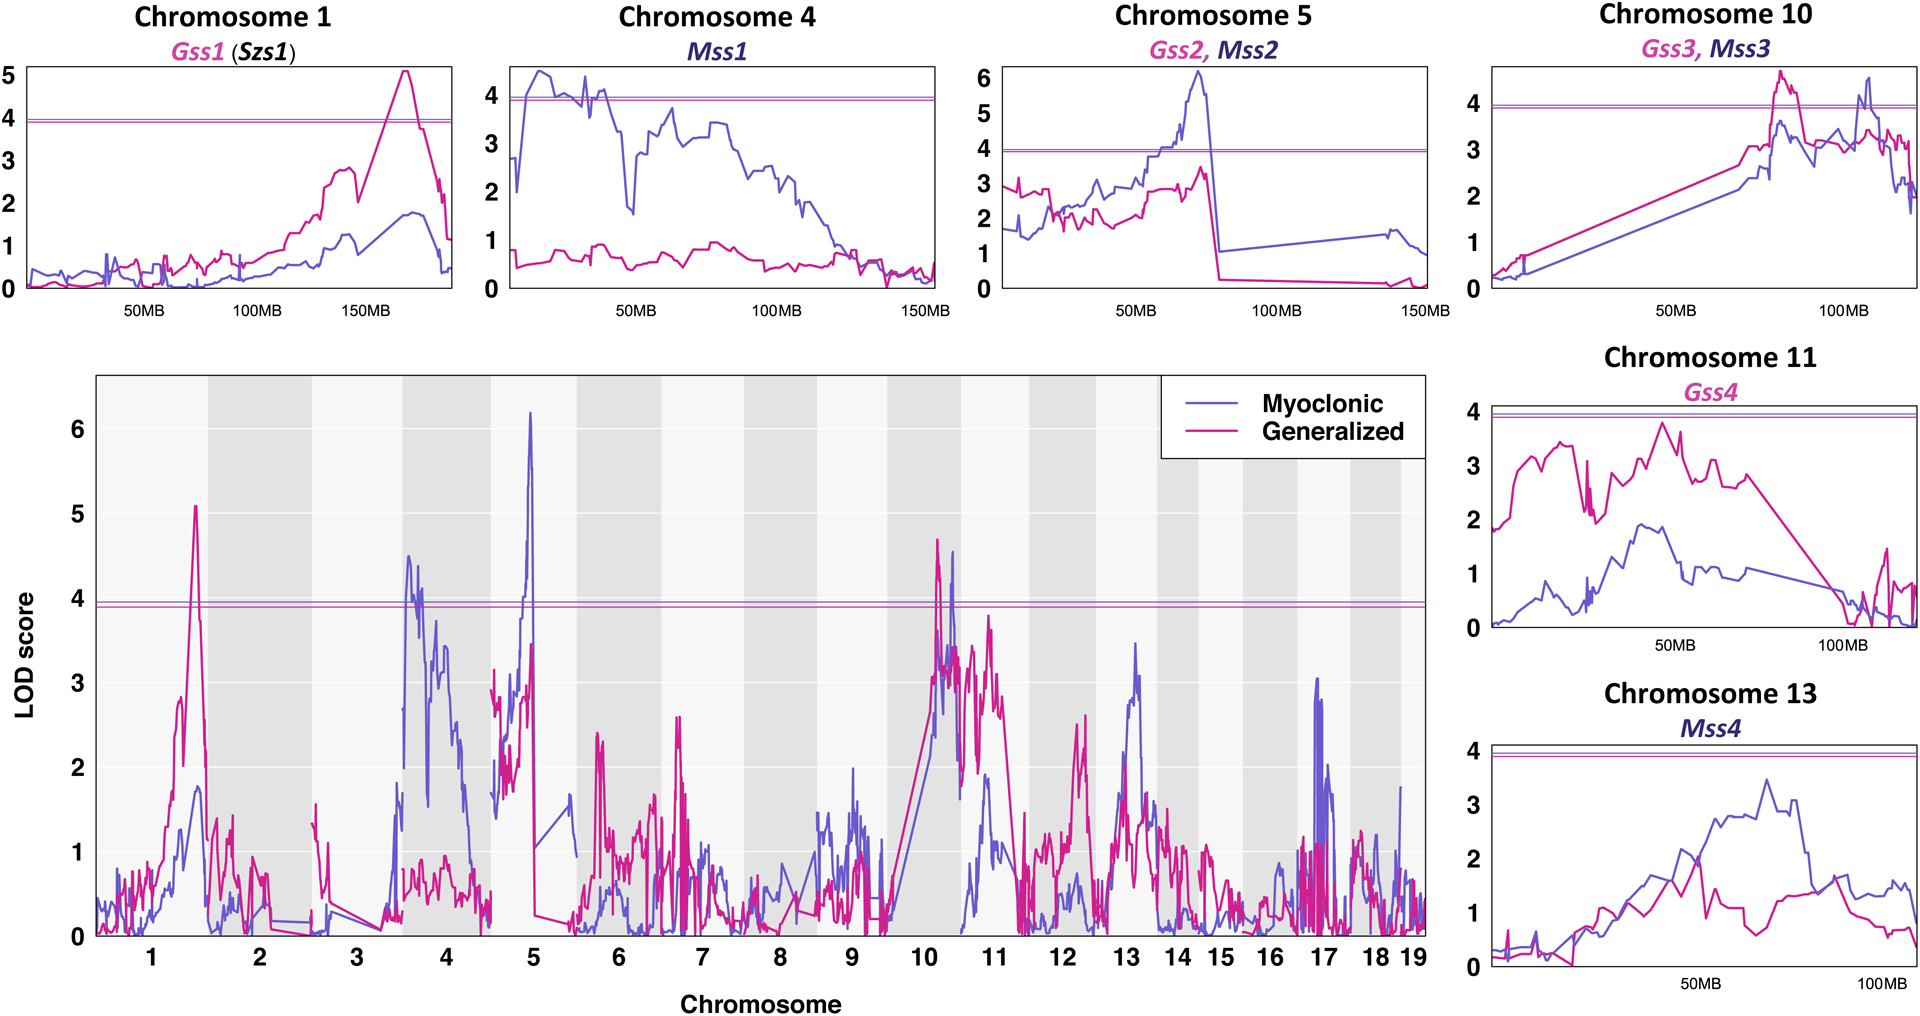
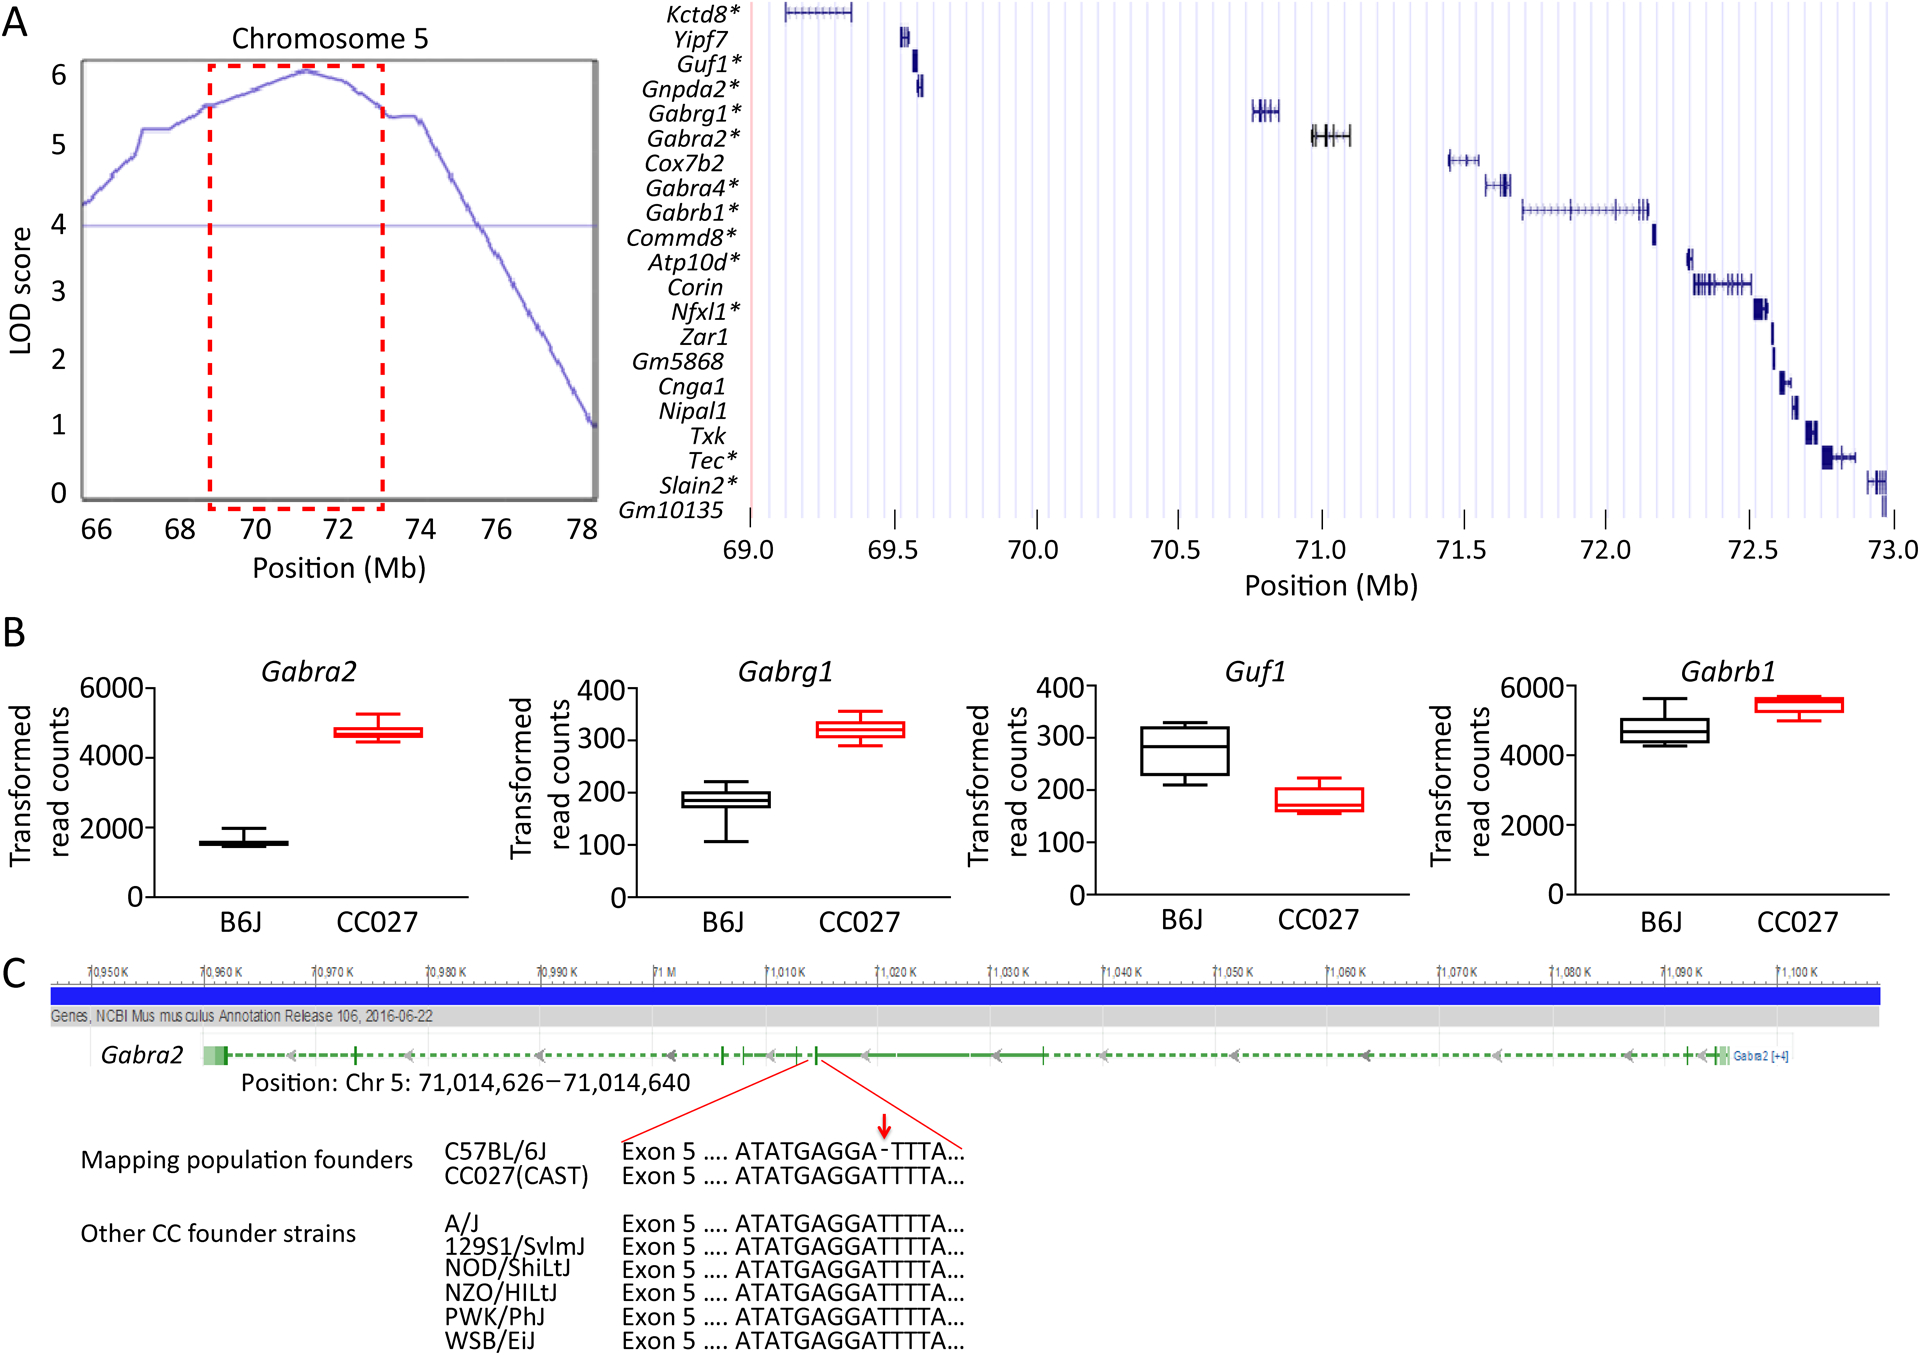
Methods: We evaluated multiple complex epileptic traits in a sampling of 35 CC inbred strains using the flurothyl-induced seizure and kindling paradigm. We created an F2 population of 297 mice with extreme seizure susceptibility and performed quantitative trait loci (QTL) mapping to identify genomic regions associated with seizure sensitivity. We used quantitative RNA sequencing from CC hippocampal tissue to identify candidate genes and whole genome sequence to identify genetic variants likely affecting gene expression.
Results: We identified new mouse models with extreme seizure susceptibility, seizure propagation, epileptogenesis, and SUDEP (sudden unexpected death in epilepsy). We performed QTL mapping and identified one known and seven novel loci associated with seizure sensitivity. We combined whole genome sequencing and hippocampal gene expression to pinpoint biologically plausible candidate genes (eg, Gabra2) and variants associated with seizure sensitivity.
Significance: New mouse models of epilepsy are needed to better understand the complex genetic architecture of seizures and to identify therapeutics. We performed a phenotypic screen utilizing a novel genetic reference population of CC mice. The data we provide enable the identification of protective/risk genes and novel molecular mechanisms linked to complex seizure traits that are currently challenging to study and treat.
Keywords: Gabra2; Collaborative Cross; SUDEP; epileptogenesis; seizure susceptibility.
© 2020 International League Against Epilepsy.
Conflict of interest statement
COMPETING INTERESTS
The authors declare no competing interests. We confirm that we have read the Journal’s position on issues involved in ethical publication and affirm that this report is consistent with those guidelines.
Figures
Similar articles
-
Multidimensional Genetic Analysis of Repeated Seizures in the Hybrid Mouse Diversity Panel Reveals a Novel Epileptogenesis Susceptibility Locus.G3 (Bethesda). 2017 Aug 7;7(8):2545-2558. doi: 10.1534/g3.117.042234. G3 (Bethesda). 2017. PMID: 28620084 Free PMC article.
-
Mapping a mouse limbic seizure susceptibility locus on chromosome 10.Epilepsia. 2011 Nov;52(11):2076-83. doi: 10.1111/j.1528-1167.2011.03256.x. Epub 2011 Sep 11. Epilepsia. 2011. PMID: 21906048 Free PMC article.
-
Increased mitotic activity in the dentate gyrus of the hippocampus of adult C57BL/6J mice exposed to the flurothyl kindling model of epileptogenesis.Neuroscience. 2002;115(3):669-83. doi: 10.1016/s0306-4522(02)00514-6. Neuroscience. 2002. PMID: 12435406
-
Experimental models of multifactorial epilepsies: the EL mouse and mice susceptible to audiogenic seizures.Adv Neurol. 1999;79:279-90. Adv Neurol. 1999. PMID: 10514820 Review.
-
Chemoconvulsant-induced seizure susceptibility: toward a common genetic basis?Epilepsia. 2007;48 Suppl 5:48-52. doi: 10.1111/j.1528-1167.2007.01289.x. Epilepsia. 2007. PMID: 17910581 Review.
Cited by
-
Powerful, efficient QTL mapping in Drosophila melanogaster using bulked phenotyping and pooled sequencing.Genetics. 2022 Mar 3;220(3):iyab238. doi: 10.1093/genetics/iyab238. Genetics. 2022. PMID: 35100395 Free PMC article.
-
Content and Performance of the MiniMUGA Genotyping Array: A New Tool To Improve Rigor and Reproducibility in Mouse Research.Genetics. 2020 Dec;216(4):905-930. doi: 10.1534/genetics.120.303596. Epub 2020 Oct 16. Genetics. 2020. PMID: 33067325 Free PMC article.
-
Psychiatric risk gene Transcription Factor 4 (TCF4) regulates the density and connectivity of distinct inhibitory interneuron subtypes.Mol Psychiatry. 2023 Nov;28(11):4679-4692. doi: 10.1038/s41380-023-02248-z. Epub 2023 Sep 28. Mol Psychiatry. 2023. PMID: 37770578 Free PMC article.
-
GABA content and an antioxidant profile positively correlated with the anticonvulsive activity of Microcos paniculata in acute seizure mice.Heliyon. 2023 Jul 14;9(7):e18295. doi: 10.1016/j.heliyon.2023.e18295. eCollection 2023 Jul. Heliyon. 2023. PMID: 37539232 Free PMC article.
-
Mouse population genetics phenocopies heterogeneity of human Chd8 haploinsufficiency.Neuron. 2023 Feb 15;111(4):539-556.e5. doi: 10.1016/j.neuron.2023.01.009. Epub 2023 Feb 3. Neuron. 2023. PMID: 36738737 Free PMC article.
References
-
- Loscher W, Klitgaard H, Twyman RE, Schmidt D. New avenues for anti-epileptic drug discovery and development. Nature reviews Drug discovery 2013;12:757–776. - PubMed
-
- Sudden Devinsky O., unexpected death in epilepsy. The New England journal of medicine 2011;365:1801–1811. - PubMed
-
- Steffens M, Leu C, Ruppert AK, Zara F, Striano P, Robbiano A, et al. Genome-wide association analysis of genetic generalized epilepsies implicates susceptibility loci at 1q43, 2p16.1, 2q22.3 and 17q21.32. Human molecular genetics 2012;21:5359–5372. - PubMed
Publication types
MeSH terms
Substances
Grants and funding
- 5U42OD010924/NH/NIH HHS/United States
- 1P01AI132130/NH/NIH HHS/United States
- U42 OD010924/OD/NIH HHS/United States
- 4U19AI100625/NH/NIH HHS/United States
- U24 HG010100/HG/NHGRI NIH HHS/United States
- R01HD093771/NH/NIH HHS/United States
- T32 HD040127/HD/NICHD NIH HHS/United States
- T32HD040127/NH/NIH HHS/United States
- P01 AI132130/AI/NIAID NIH HHS/United States
- P42 ES031007/ES/NIEHS NIH HHS/United States
- U19 AI100625/AI/NIAID NIH HHS/United States
- R01 NS085093/NS/NINDS NIH HHS/United States
- R01 HD093771/HD/NICHD NIH HHS/United States
- U24HG10100/NH/NIH HHS/United States
LinkOut - more resources
Full Text Sources
Medical
Molecular Biology Databases
Miscellaneous
