. 2020 Sep 23;12(38):42997-43008.
doi: 10.1021/acsami.0c11581. Epub 2020 Sep 8.

Organic Photovoltaic Pseudocapacitors for Neurostimulation

Affiliations

Organic Photovoltaic Pseudocapacitors for Neurostimulation

Mertcan Han et al. ACS Appl Mater Interfaces. .

Abstract

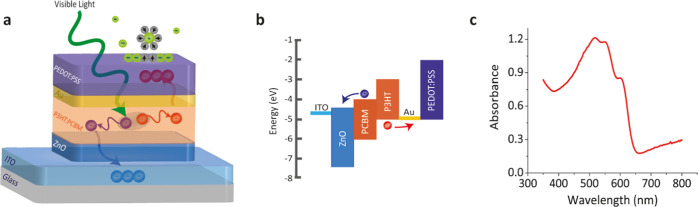
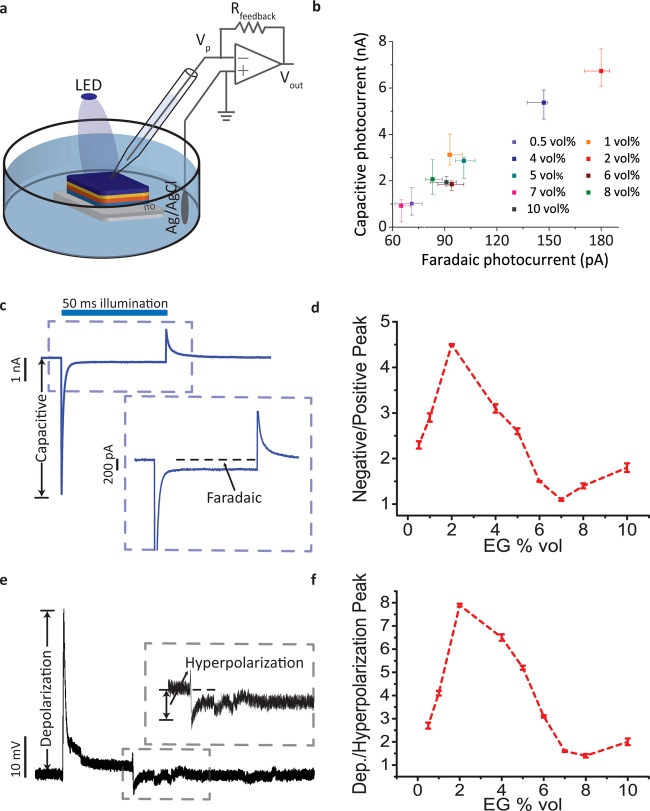
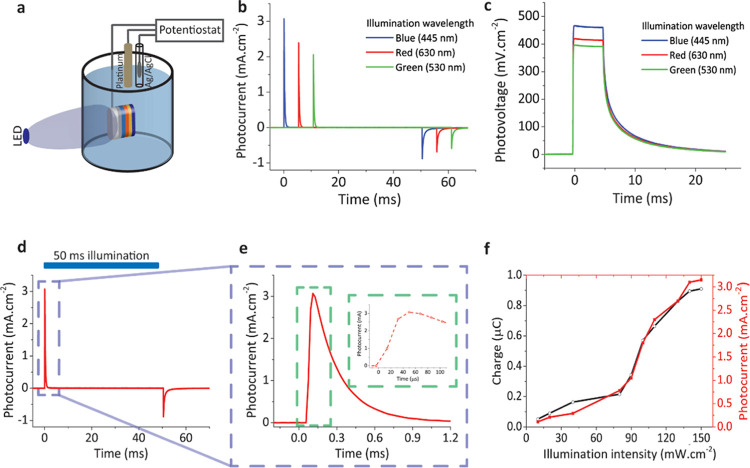
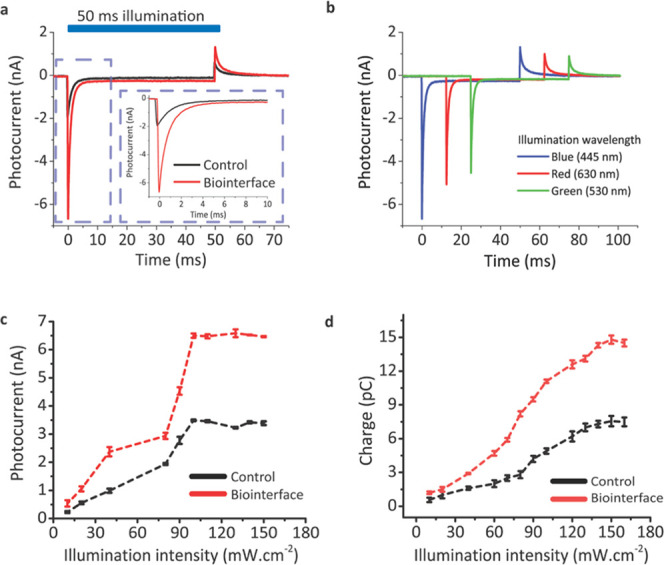
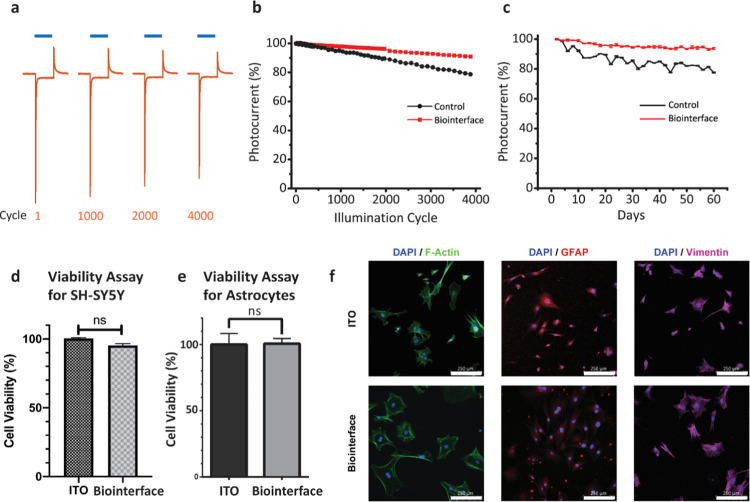
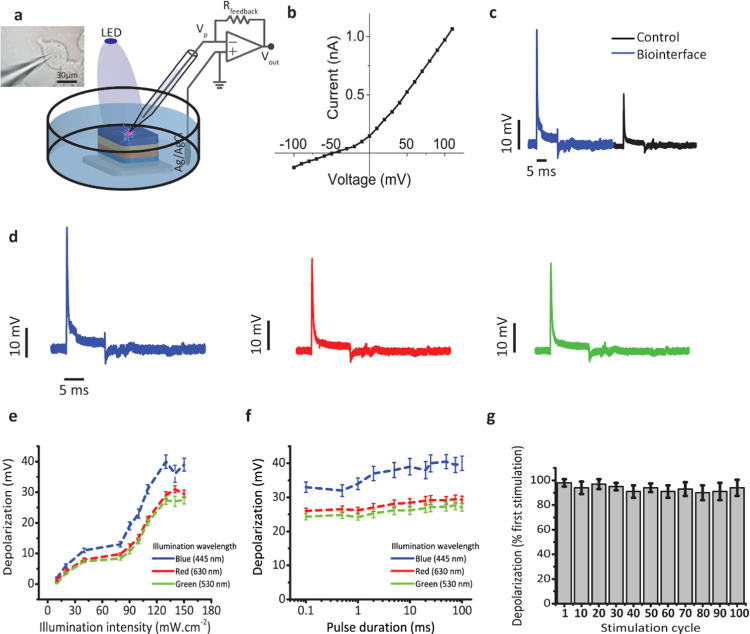
Neural interfaces are the fundamental tools to understand the brain and cure many nervous-system diseases. For proper interfacing, seamless integration, efficient and safe digital-to-biological signal transduction, and long operational lifetime are required. Here, we devised a wireless optoelectronic pseudocapacitor converting the optical energy to safe capacitive currents by dissociating the photogenerated excitons in the photovoltaic unit and effectively routing the holes to the supercapacitor electrode and the pseudocapacitive electrode-electrolyte interfacial layer of PEDOT:PSS for reversible faradic reactions. The biointerface showed high peak capacitive currents of ∼3 mA·cm-2 with total charge injection of ∼1 μC·cm-2 at responsivity of 30 mA·W-1, generating high photovoltages over 400 mV for the main eye photoreception colors of blue, green, and red. Moreover, modification of PEDOT:PSS controls the charging/discharging phases leading to rapid capacitive photoresponse of 50 μs and effective membrane depolarization at the single-cell level. The neural interface has a device lifetime of over 1.5 years in the aqueous environment and showed stability without significant performance decrease after sterilization steps. Our results demonstrate that adopting the pseudocapacitance phenomenon on organic photovoltaics paves an ultraefficient, safe, and robust way toward communicating with biological systems.

Keywords: PEDOT:PSS; bioelectronics; neurostimulation; organic photovoltaics; pseudocapacitors.


Conflict of interest statement

The authors declare no competing financial interest.

Figures

Figure 1
Figure 1
Device architecture and material characteristics. (a) Structure of the organic photovoltaic pseudocapacitor biointerface. It incorporates a photovoltaic unit composed of ITO/ZnO/P3HT:PCBM and a pseudocapacitor made of Au/PEDOT:PSS. Light stimulation in the photovoltaic unit causes charge separation in the photoactive layer. Au was used as the hole collector, and PEDOT:PSS operates as the pseudocapacitive interfacial layer to host polarized solvent molecules and also specifically adsorb ions for reversible faradic reactions. (b) Energy band diagram of the organic photovoltaic pseudocapacitor. (c) Ultraviolet-to-visible absorption spectrum of the biointerface.
Figure 2
Figure 2
Chemical tuning of the capacitive and faradic parts of the photoresponse. (a) Schematic of the photocurrent measurement system. A patch-clamp electrophysiological recording system was used. Photoelectrodes were placed in the free-standing mode to mimic the behavior in biological media. The pipette was positioned close to the surface of the biointerface. The ITO layer that is in direct contact with the electrolyte was used as the return electrode. (b) Capacitive and faradic parts of the total photocurrent with different EG ratios in the PEDOT:PSS solution (n = 6). (c) Representative photoresponse of the Au/PEDOT:PSS-coated biointerface to define capacitive and faradic parts of the photocurrents. The blue area on the top shows the light illumination period. The blue dashed box marks the region shown in the inset. (d) Negative and positive absolute photocurrent peak ratios with different EG ratios (n = 6). (e) Representative cellular photoresponse generated by the biointerface. The gray dashed box marks the region shown in the inset. (f) Ratio of depolarization and hyperpolarization for different EG ratios (n = 6). All data are presented as means ± standard error of the mean (SEM).
Figure 3
Figure 3
Photoelectrochemical characterization of the biointerface to explore benchmark values. (a) Schematic of the photoelectrochemical measurement system. A potentiostat module combined with platinum and Ag/AgCl electrodes was utilized for the measurement. The working electrode was directly connected to the ITO layer with a metal clip as the return electrode in the system. The device area of ∼1 cm2 was illuminated. (b) Photocurrent and (c) photovoltage transient response under the illumination of 445, 530, and 630 nm light pulses with trains of 50 ms, 100 mW·cm–2. (d) Best photocurrent performance under blue light illumination (445 nm). The blue area on the top shows the light illumination period. The blue dashed box marks the region shown in (e). (e) Closeup for photocurrent transient; the green dashed box marks the region shown in the inset to identify the rise time. (f) Photocurrent and charge generation correlation with respect to different illumination powers using 445 nm blue light-emitting diode (LED).
Figure 4
Figure 4
Photocurrent measurements to identify the spectral response and total charge injection. (a) Photocurrent response upon illumination with trains of 50 ms, 120 mW·cm–2 light pulses for the control (black) and Au/PEDOT:PSS-coated biointerfaces (red). The blue area on the top shows the light illumination period. The blue dashed box marks the region shown in the inset to identify capacitive and faradic parts of the photocurrent. (b) Spectral photoresponse of the biointerface under 445, 530, and 630 nm light pulses with trains of 50 ms, 100 mW·cm–2. (c) Photocurrent peaks under different illumination powers (n = 6). (d) Charge injection amounts under different illumination powers (n = 6). All data in (c) and (d) are presented as means ± SEM.
Figure 5
Figure 5
Cyclic and continuous photostability tests and biocompatibility experiments. (a) Device stability in the biological medium. Biointerfaces were kept in aCSF for 60 days, and on each of the two days, photocurrent measurements were repeated to evaluate device stability in the biological medium (aCSF). Blue areas on the top highlight the light illumination periods. Blue bars represent 50 ms illumination using a blue LED with nominal wavelength at 445 nm, 120 mW·cm–2 power. (b) Peak value of the photocurrent transient over 4000 cyclic illumination cycles for the control and the biointerface. Photocurrent peaks were normalized with respect to the value in the first cycle. (c) Time-dependent cyclic stability. Photocurrent peaks were measured in periodic cyclic illumination, and measurements were normalized to analyze photostability over 60 days. (d) Effect of two types of biointerfaces on cell metabolic activity was assessed by the MTT assay and compared with the ITO control. An unpaired two-tailed t-test was performed to determine the level of significance. Each experiment was carried out with at least three biological replicates (n = 3). *p < 0.05 was considered statistically significant, and nonsignificant differences are presented as “ns”. (e) Viability assay for primary astrocytes on the biointerface compared with the ITO control. An unpaired two-tailed t-test was performed to determine the level of significance. Each experiment was carried out with at least three biological replicates (n = 3). *p < 0.05 was considered as statistically significant, and nonsignificant differences are presented as ns. (f) Immunofluorescence images of primary astrocytes on ITO control and the biointerface. Primary astrocytes co-stained with DAPI and F-Actin, GFAP, Vimentin antibodies, respectively (scale bars: 250 μm).
Figure 6
Figure 6
Neural stimulation experiments at the single-cell level. (a) Schematic of the electrophysiology patch-clamp measurement setup. Material thickness is not in scale. Left inset: image of the patch-clamped SH-SY5Y cell (scale bar: 30 μm). (b) IV curve of a measured SH-SY5Y cell. (c) Photostimulation of the SH-SY5Y cell on the control and the biointerface under illumination of 120 mW·cm–2 with 10 ms illumination pulses. Intracellular membrane potential with respect to a distant Ag/AgCl electrode was measured. (d) Photostimulation response of SH-SY5Y cells on the biointerface under 445, 530, and 630 nm light pulses with trains of 10 ms, 100 mW·cm–2. (e) Depolarization amplitude for different illumination intensities of blue, red, and green lights (n = 10). (f) Depolarization amplitude for different pulse durations of blue, red, and green lights (n = 10). (g) Dependence of depolarization on the stimulus cycles. For each measurement cycle, the depolarization amplitudes were normalized with respect to the depolarization value upon the first stimulus (n = 10). All data in (e)–(g) are presented as means ± SEM.

Similar articles

Cited by

References

    1. Zhang M.; Tang Z.; Liu X.; Van der Spiegel J. Electronic Neural Interfaces. Nat. Electron. 2020, 3, 191–200. 10.1038/s41928-020-0390-3. - DOI
    1. Kringelbach M. L.; Jenkinson N.; Owen S. L. F.; Aziz T. Z. Translational Principles of Deep Brain Stimulation. Nat. Rev. Neurosci. 2007, 623–635. 10.1038/nrn2196. - DOI - PubMed
    1. Grossman N.; Bono D.; Dedic N.; Kodandaramaiah S. B.; Rudenko A.; Suk H. J.; Cassara A. M.; Neufeld E.; Kuster N.; Tsai L. H.; Pascual-Leone A.; Boyden E. S. Noninvasive Deep Brain Stimulation via Temporally Interfering Electric Fields. Cell 2017, 169, 1029–1041. 10.1016/j.cell.2017.05.024. - DOI - PMC - PubMed
    2. 1029-1041

    1. Fu T. M.; Hong G.; Zhou T.; Schuhmann T. G.; Viveros R. D.; Lieber C. M. Stable Long-Term Chronic Brain Mapping at the Single-Neuron Level. Nat. Methods 2016, 13, 875–882. 10.1038/nmeth.3969. - DOI - PubMed
    1. Fasano A.; Daniele A.; Albanese A. Treatment of Motor and Non-Motor Features of Parkinson’s Disease with Deep Brain Stimulation. Lancet Neurol. 2012, 11, 429–442. 10.1016/S1474-4422(12)70049-2. - DOI - PubMed