. 2020 Dec;161(4):325-344.
doi: 10.1111/imm.13251. Epub 2020 Oct 12.

TLR5 activation in hepatocytes alleviates the functional suppression of intrahepatic CD8+ T cells

Affiliations

TLR5 activation in hepatocytes alleviates the functional suppression of intrahepatic CD8+ T cells

Hu Yan et al. Immunology. 2020 Dec.

Abstract

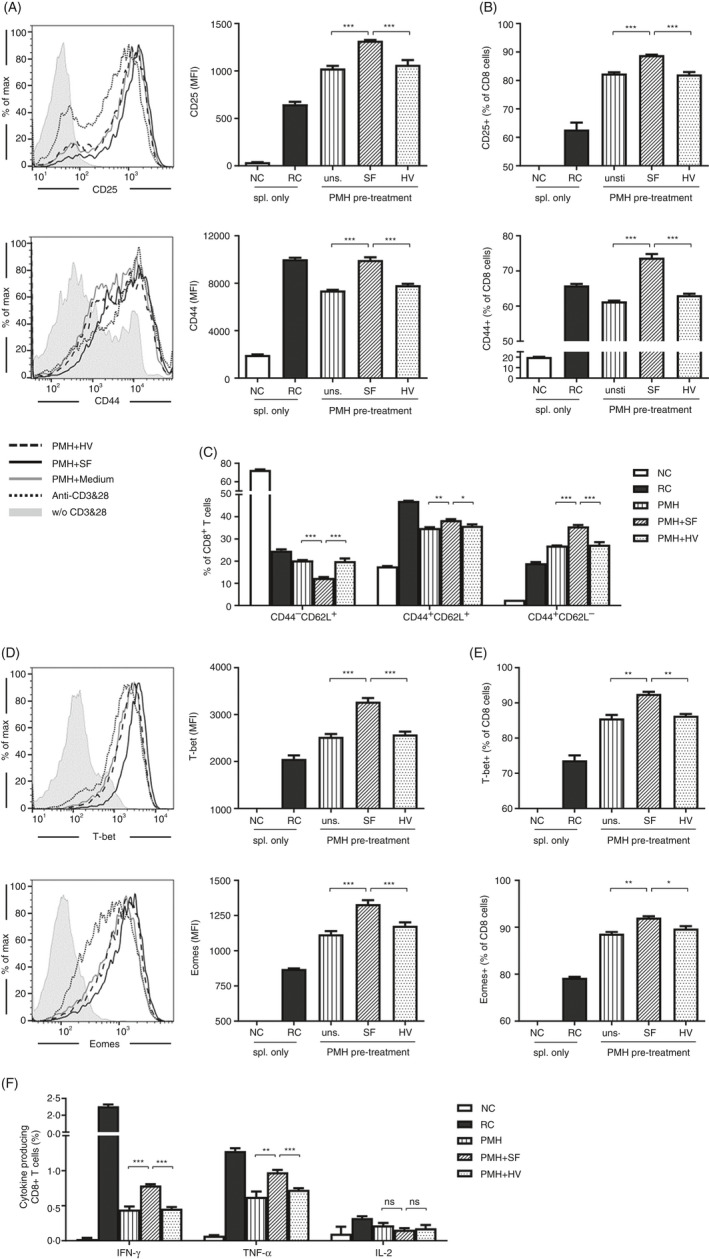
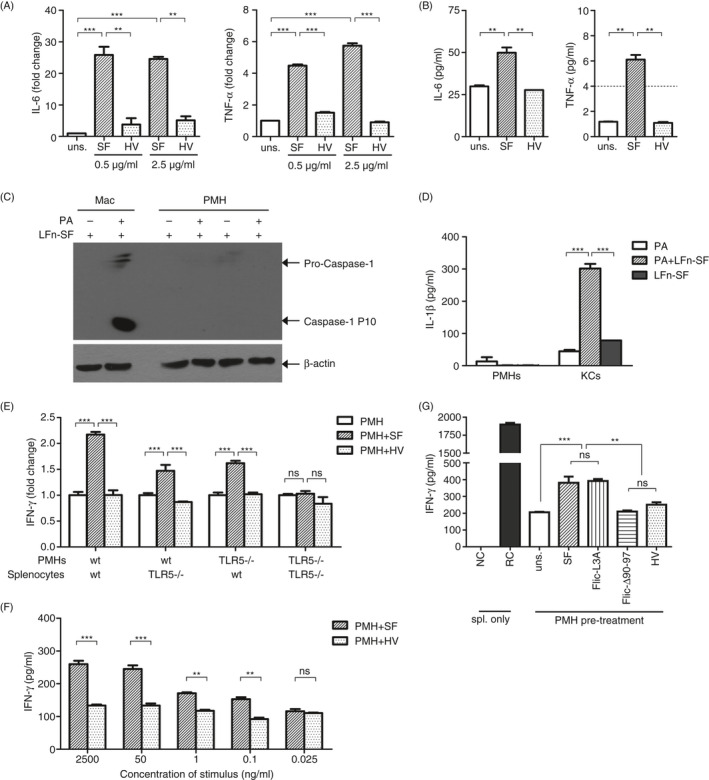
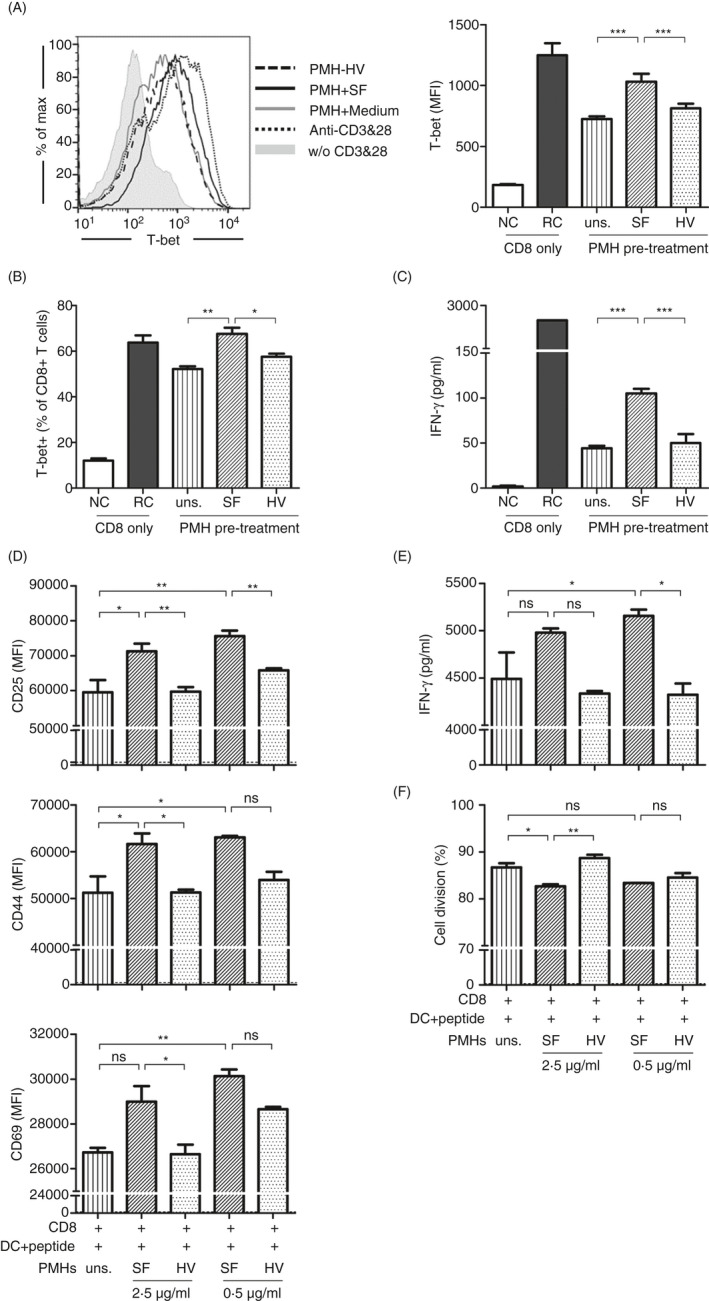
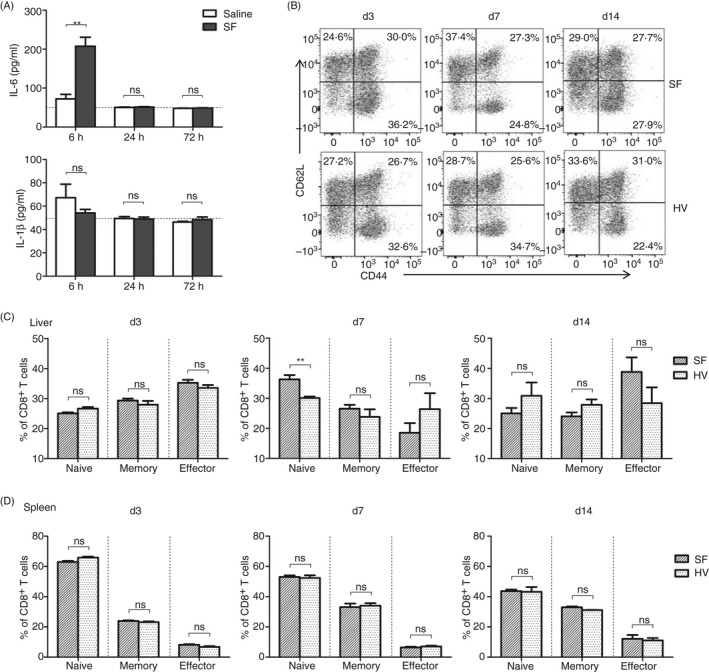
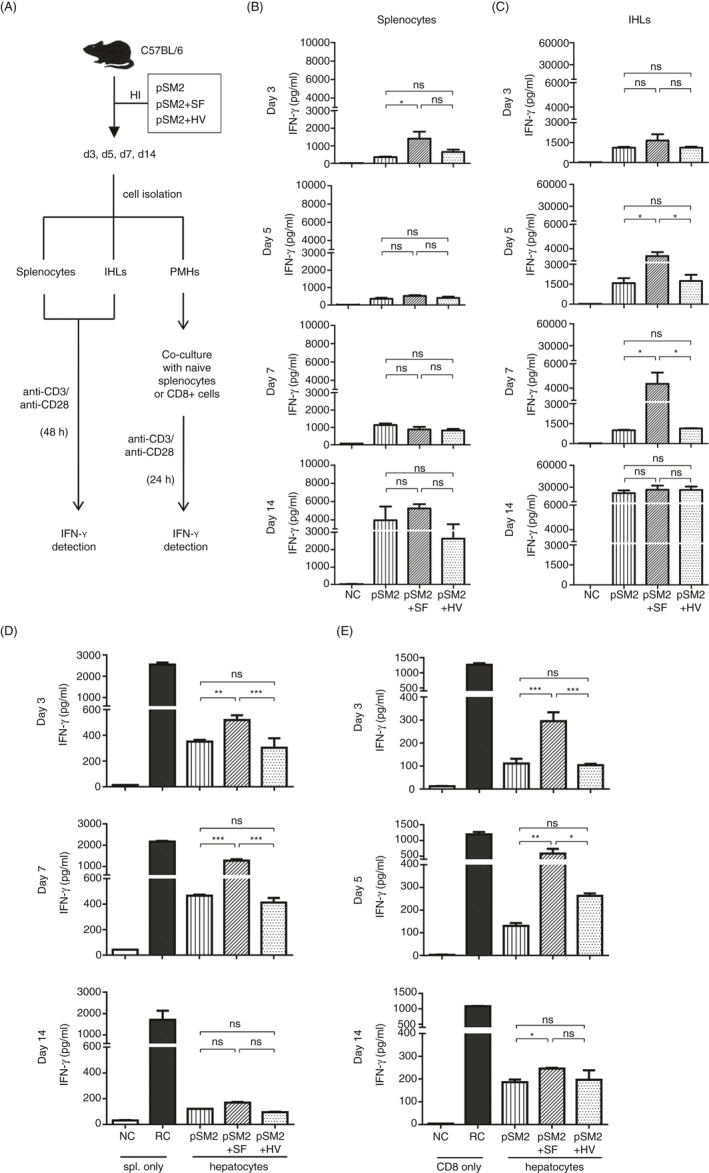
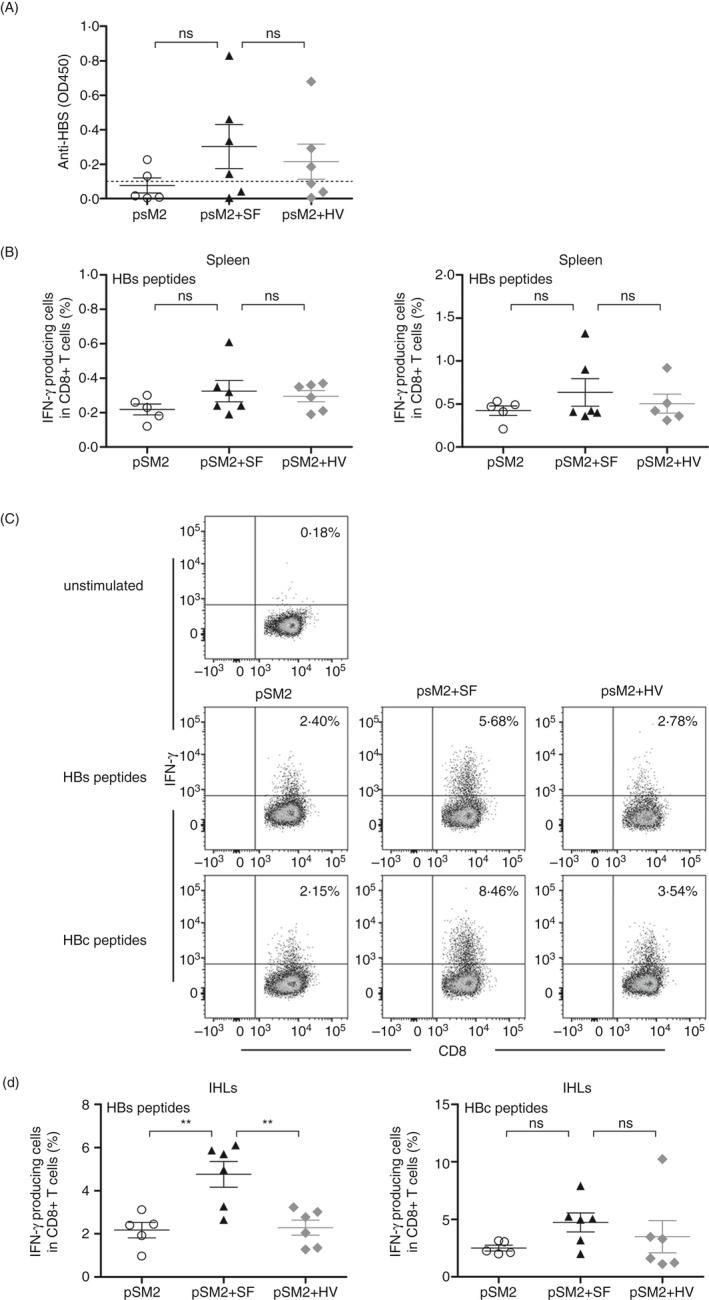
The liver is an immune-privileged organ with a tolerogenic environment for maintaining liver homeostasis. This hepatic tolerance limits the intrahepatic CD8+ T-cell response for eliminating infections. The tolerant microenvironment in the liver is orchestrated by liver-specific immunoregulatory cells that can be functionally regulated by pathogen-associated molecular patterns (PAMPs). Here, we report that flagellin, a key PAMP of gut bacteria, modulates the intrahepatic CD8+ T-cell response by activating the TLR5 signalling pathway of hepatocytes. We found that mice treated with Salmonella-derived recombinant flagellin (SF) by hydrodynamic injection had a significantly elevated IFN-γ production by the intrahepatic lymphocytes in 7 days after injection. This was correlated with a reduced immune suppressive effect of primary mouse hepatocytes (PMHs) in comparison with that of PMHs from mock-injected control mice. In vitro co-culture of SF-treated PMHs with splenocytes revealed that hepatocyte-induced immune suppression is alleviated through activation of the TLR5 but not the NLRC4 signalling pathway, leading to improved activation and function of CD8+ T cells during anti-CD3 stimulation or antigen-specific activation. In an acute HBV replication mouse model established by co-administration of SF together with an HBV-replicating plasmid by hydrodynamic injection, SF significantly enhanced the intrahepatic HBV-specific CD8+ T-cell response against HBV surface antigen. Our results clearly showed that flagellin plays a role in modulating the intrahepatic CD8+ T-cell response by activating the TLR5 pathway in PMHs, which suggests a potential role for gut bacteria in regulating liver immunity.

Keywords: CD8+ T-cell response; Toll-like receptor 5; flagellin; hepatocytes; liver tolerance.


Conflict of interest statement

The authors declare no commercial or financial conflict of interest.

Figures

FIGURE 1
FIGURE 1
Stimulation of PMHs by SF improved the activation and function of CD8+ T cells. PMHs from WT C57BL/6 mice were pretreated with SF or HV protein (2.5 µg/ml) for 24 h and then co‐cultured with TLR5−/− splenocytes in the presence of anti‐CD3 and anti‐CD28 for an additional 24 h. (A, B) Expression of the activation markers CD25 and CD44 on CD8+ T cells. Grey shadow, without (w/o) CD3 and CD28; dark dotted line, anti‐CD3 and anti‐CD28; grey solid line, PMH + medium; dark solid line, PMH + SF; dark dashed line, PMH + HV. (C) Differentiation of CD8+ T cells was characterized as naïve cells (CD62L+CD44), effector cells (CD62LCD44+) and memory cells (CD62L+CD44+). (D, E) Expression of the transcription factors T‐bet and Eomes and (F) production of IFN‐γ, TNF‐α and IL‐2 in CD8+ T cells were analysed by flow cytometry. Data are representative of at least three independent experiments. Bars: mean ± SD. *: p < 0.05; **: p < 0.01; ***: p < 0.001, statistical relevance was determined by one‐way ANOVA.
FIGURE 2
FIGURE 2
Activation of the TLR5 signalling pathway reduced the immunosuppressive properties of PMHs. PMHs were isolated from naïve C57BL/6 mice and stimulated with SF or HV protein. (A) The expression of TNF‐α and IL‐6 at the mRNA level was quantified by real‐time RT‐PCR after 6 h, and (B) TNF‐α and IL‐6 in the supernatant were measured by ELISA after 24 h. Dashed line indicates the sensitivity threshold of the ELISA kit. (C, D) PMHs were pretreated with 50 ng/ml LPS for 3 h and then transfected with the LFn‐SF + PA system. (C) Caspase‐1 cleavage and (D) IL‐1β secretion were detected by Western blot or ELISA after 1 or 6 h, respectively. (E) WT or TLR5−/− hepatocytes pretreated with SF or HV were co‐cultured with WT or TLR5−/− splenocytes in the presence of anti‐CD3 and anti‐CD28. (F) WT PMHs were pretreated with SF or HV at the indicated concentrations and co‐cultured with TLR5−/− splenocytes. (G) WT hepatocytes were pretreated with SF, FliC‐L3A, FliCΔ90‐97 or HV and co‐cultured with TLR5−/− splenocytes. IFN‐γ in the supernatants was detected by ELISA after 24 h of co‐culture. Unstimulated splenocytes were used as a negative control (NC). Splenocytes stimulated with anti‐CD3/anti‐CD28 alone were used as reactive controls (RC). Data are representative of at least three independent experiments. Bars: mean ± SD. *: p < 0.05; **: p < 0.01; ***: p < 0.001, statistical relevance was determined by one‐way ANOVA or two‐way ANOVA (f).
FIGURE 3
FIGURE 3
Antigen‐specific CD8+ T‐cell activation and function were improved by SF‐treated PMHs. PMHs from WT C57BL/6 mice were pretreated with SF or HV protein (0.5 or 2.5 µg/ml) for 24 h. MACS‐purified TLR5−/− CD8+ T cells were co‐cultured with pretreated PMHs in the presence of anti‐CD3 and anti‐CD28 for 24 h. (A, B) The expression of the transcription factors T‐bet and (C) the production of IFN‐γ were analysed by flow cytometry and ELISA, respectively. Grey shadow, without (w/o) CD3 and CD28; dark dotted line, anti‐CD3 and anti‐CD28; grey solid line, PMH + medium; dark solid line, PMH + SF; dark dashed line, PMH + HV. (d–f) FV‐TCR Tg CD8+ T cells were pre‐activated by DbGagL FV epitope‐loaded dendritic cells for 24 h and then co‐cultured with the pretreated PMHs. (D) Activation of FV‐TCR Tg CD8+ T cells was evaluated by staining for CD25, CD44 and CD69. (E) IFN‐γ in the supernatant was detected by ELISA. (F) Proliferation of CD8+ T cells was detected by CellTrace Violet division assay. Dash line, results from the FV‐TCR Tg CD8+ T cells pre‐activated with the non‐loaded dendritic cells. Data are representative of at least three independent experiments. Bars: mean ± SD. *: p < 0.05; **: p < 0.01; ***: p < 0.001, statistical relevance was determined by one‐way ANOVA.
FIGURE 4
FIGURE 4
Hydrodynamic injection of SF regulates the activation of lymphocyte subsets in the liver. C57BL/6 mice were hydrodynamically injected with 25 µg SF or HV protein via the tail vein. (A) IL‐6 and IL‐1β in the liver lavage samples at 6, 48 and 72 h post‐injection were measured by ELISA. (B) Differentiation of intrahepatic CD8+ T cells was indicated by CD62L and CD44 expression at 3, 7 and 14 days post‐injection. (C, D) Frequency of naïve (CD62L+CD44), memory (CD62L+CD44+) and effector (CD62LCD44+) CD8+ T cells in the liver (C) and spleen (D). n = 6–8 mice per group. Data are representative of at least three independent experiments. Bars: mean ± SD. *: p < 0.05; **: p < 0.01; ***: p < 0.001, statistical relevance was determined by unpaired t‐test (two‐tailed).
FIGURE 5
FIGURE 5
Hydrodynamic injection of SF regulated the function of intrahepatic T cells and hepatic cells. (A) Experimental design of SF treatment, cell isolation and analysis. C57BL/6 mice were hydrodynamically injected with pSM2, pSM2 + SF or pSM2 + HV protein. Splenocytes, intrahepatic lymphocytes (IHLs) and PMHs were isolated at 3, 5, 7 and 14 days post‐injection. (B) Splenocytes and (C) IHLs were stimulated with anti‐CD3 and anti‐CD28 for 48 h. PMHs were co‐cultured with TLR5−/− splenocytes (D) or MACS‐purified TLR5−/− CD8+ T cells (E) that were freshly isolated from naïve C57BL/6 mice in the presence of anti‐CD3 and anti‐CD28 for 24 h. IFN‐γ in the supernatant was detected by ELISA. Unstimulated splenocytes or CD8+ T cells were used as a negative control (NC). Splenocytes or CD8+ T cells stimulated with anti‐CD3/anti‐CD28 alone were used as reactive controls (RC). n = 3–4 mice per group. Data are representative of at least three independent experiments. Bars: mean ± SD. *: p < 0.05; **: p < 0.01; ***: p < 0.001, statistical relevance was determined by one‐way ANOVA.
FIGURE 6
FIGURE 6
SF improved the intrahepatic viral‐specific CD8+ T‐cell response in the HBV‐replicating mouse model. C57BL/6 mice were hydrodynamically injected with pSM2, pSM2 + SF or pSM2 + HV protein. Animals were killed at day 28 post‐injection. (A) Serum anti‐HBs antibodies were detected by ELISA. Frequencies of HBs‐ or HBc‐specific CD8+ T cells in the spleen (B) or liver (C, D) were detected by intracellular staining for IFN‐γ after 4.5 h ex vivo stimulation with HBs‐ or HBc‐derived peptides. n = 5–6 mice per group. Data are representative of three independent experiments. Bars: mean ± SD. *: p < 0.05; **: p < 0.01; ***: p < 0.001, statistical relevance was determined by one‐way ANOVA.

References

    1. Crispe IN, Giannandrea M, Klein I, John B, Sampson B, Wuensch S. Cellular and molecular mechanisms of liver tolerance. Immunol Rev. 2006;213:101–18. - PubMed
    1. Zheng M, Tian Z. Liver‐mediated adaptive immune tolerance. Front Immunol. 2019;10:2525. - PMC - PubMed
    1. Spangenberg HC, Viazov S, Kersting N, Neumann‐Haefelin C, McKinney D, Roggendorf M, et al. Intrahepatic CD8+ T‐cell failure during chronic hepatitis C virus infection. Hepatology. 2005;42:828–37. - PubMed
    1. Kubes P, Jenne C. Immune responses in the liver. Annu Rev Immunol. 2018;36:247–77. - PubMed
    1. Pillarisetty VG, Shah AB, Miller G, Bleier JI, DeMatteo RP. Liver dendritic cells are less immunogenic than spleen dendritic cells because of differences in subtype composition. J Immunol. 2004;172:1009–17. - PubMed

Publication types