

Community-Level Factors Associated With Racial And Ethnic Disparities In COVID-19 Rates In Massachusetts
- PMID: 32853056
- PMCID: PMC8928571
- DOI: 10.1377/hlthaff.2020.01040
Community-Level Factors Associated With Racial And Ethnic Disparities In COVID-19 Rates In Massachusetts
Abstract
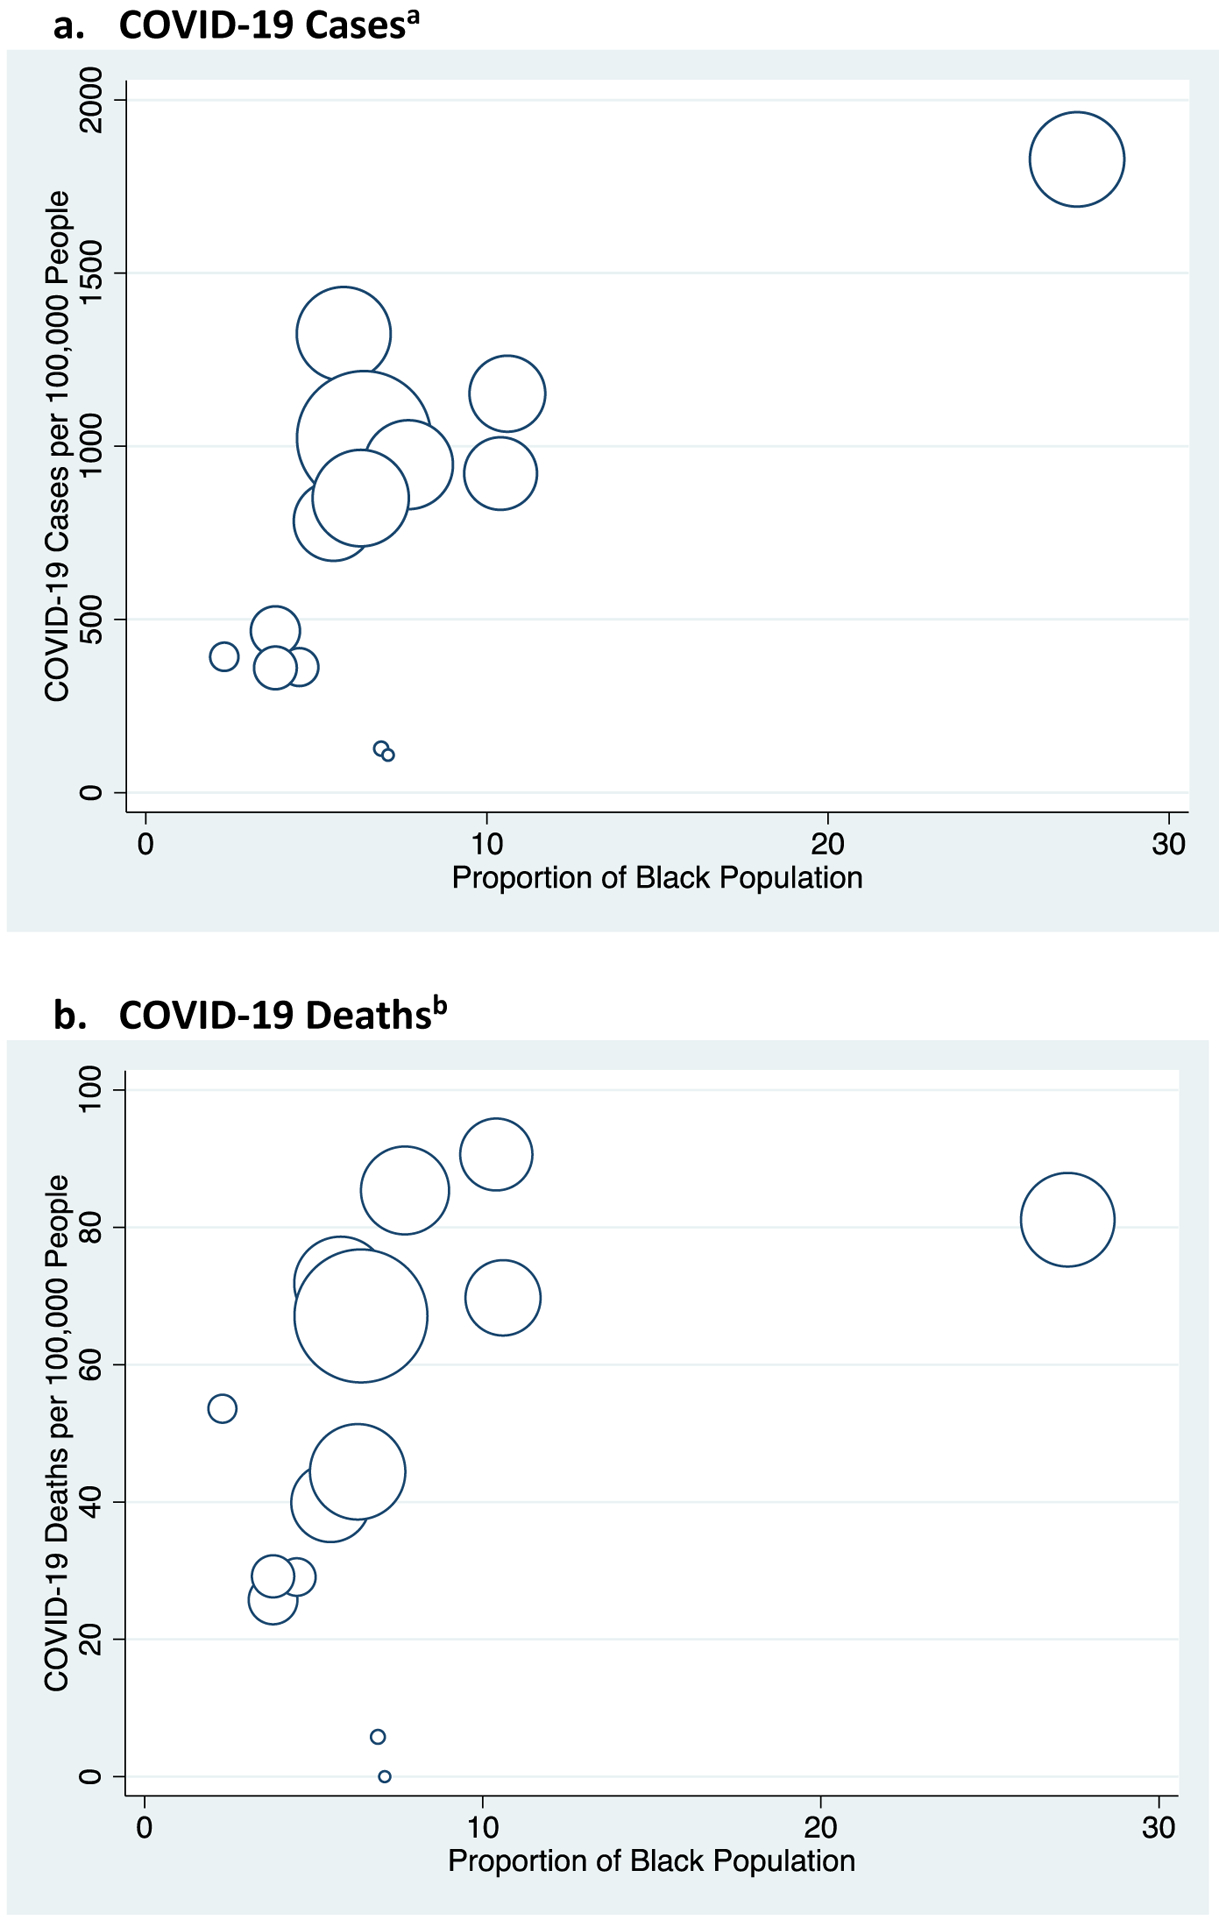
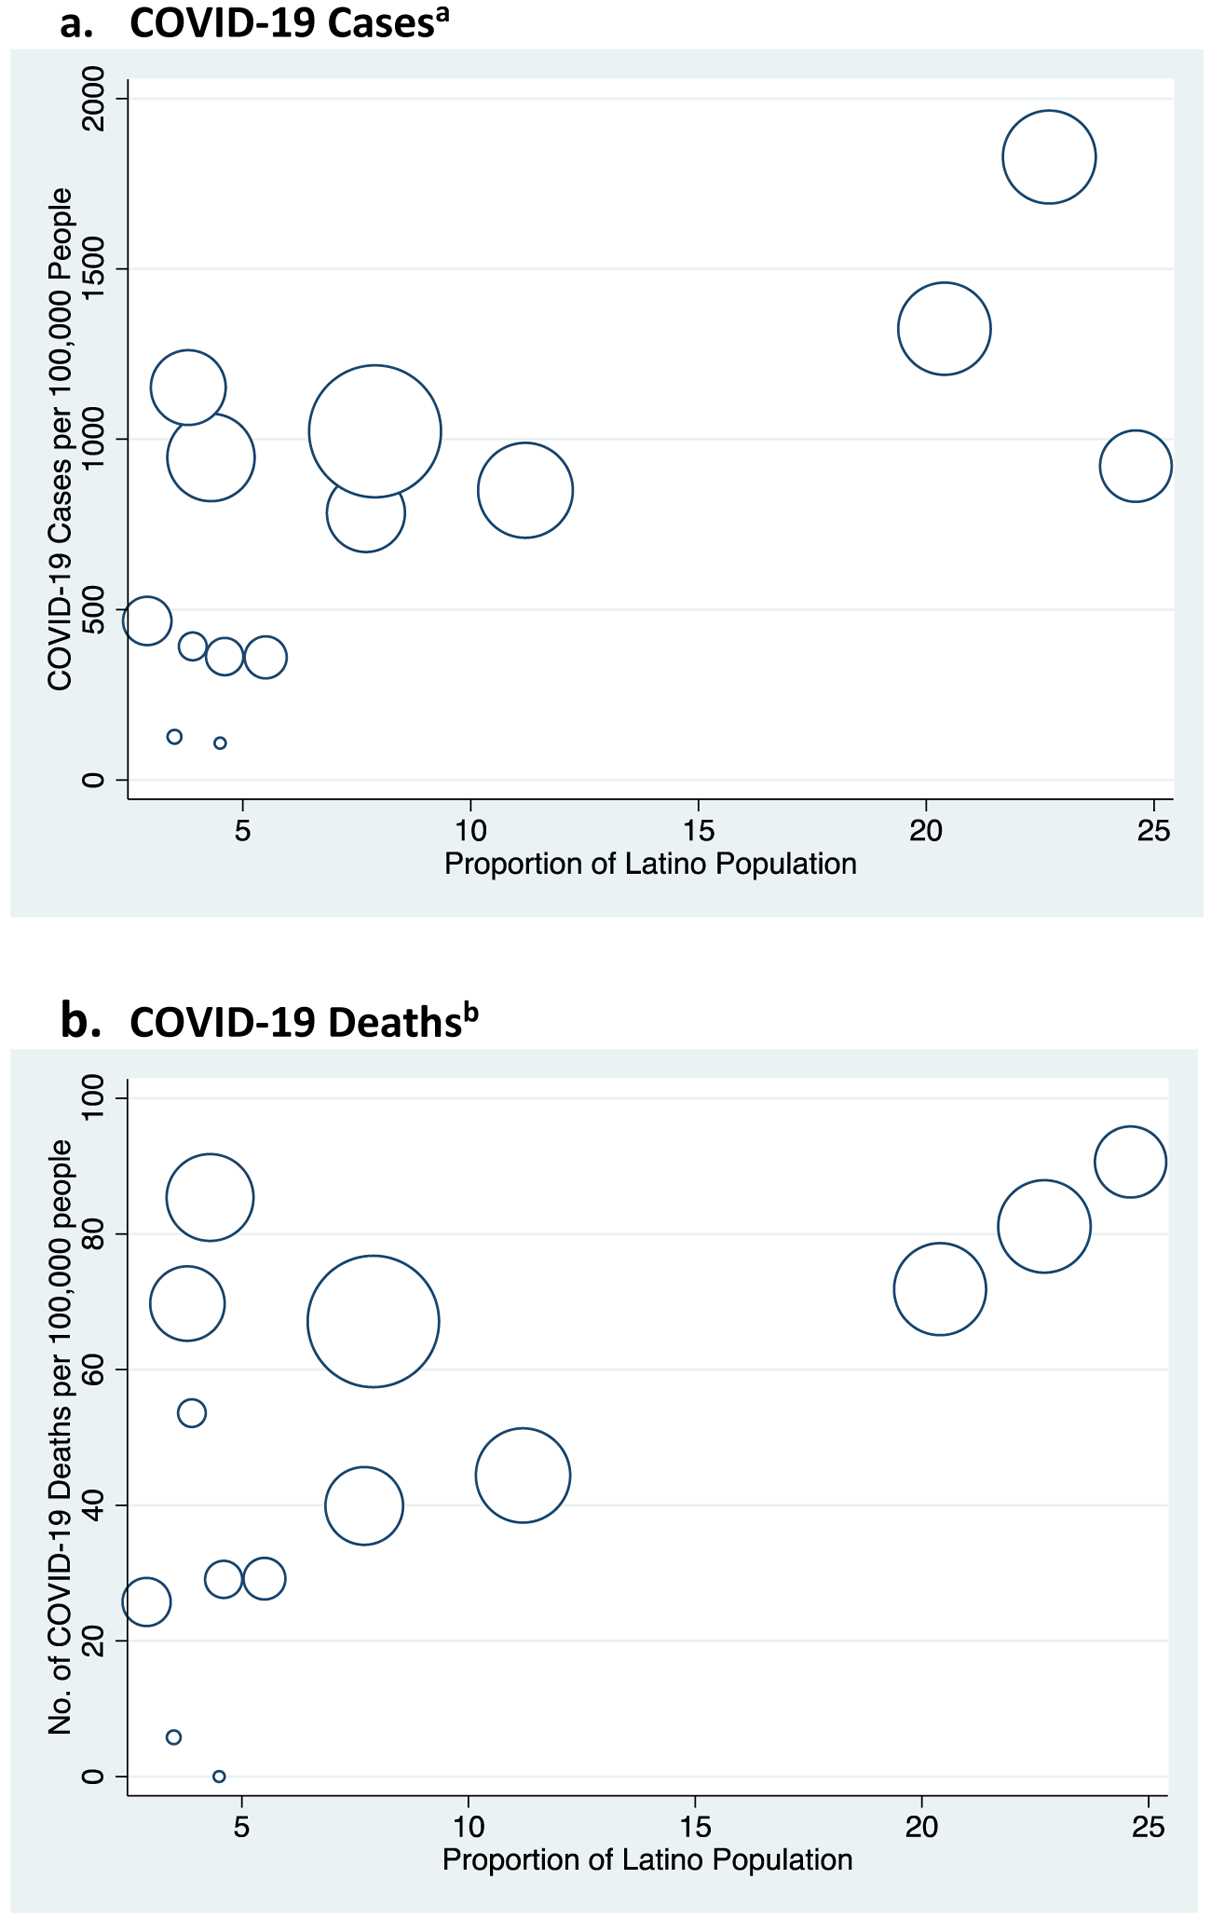
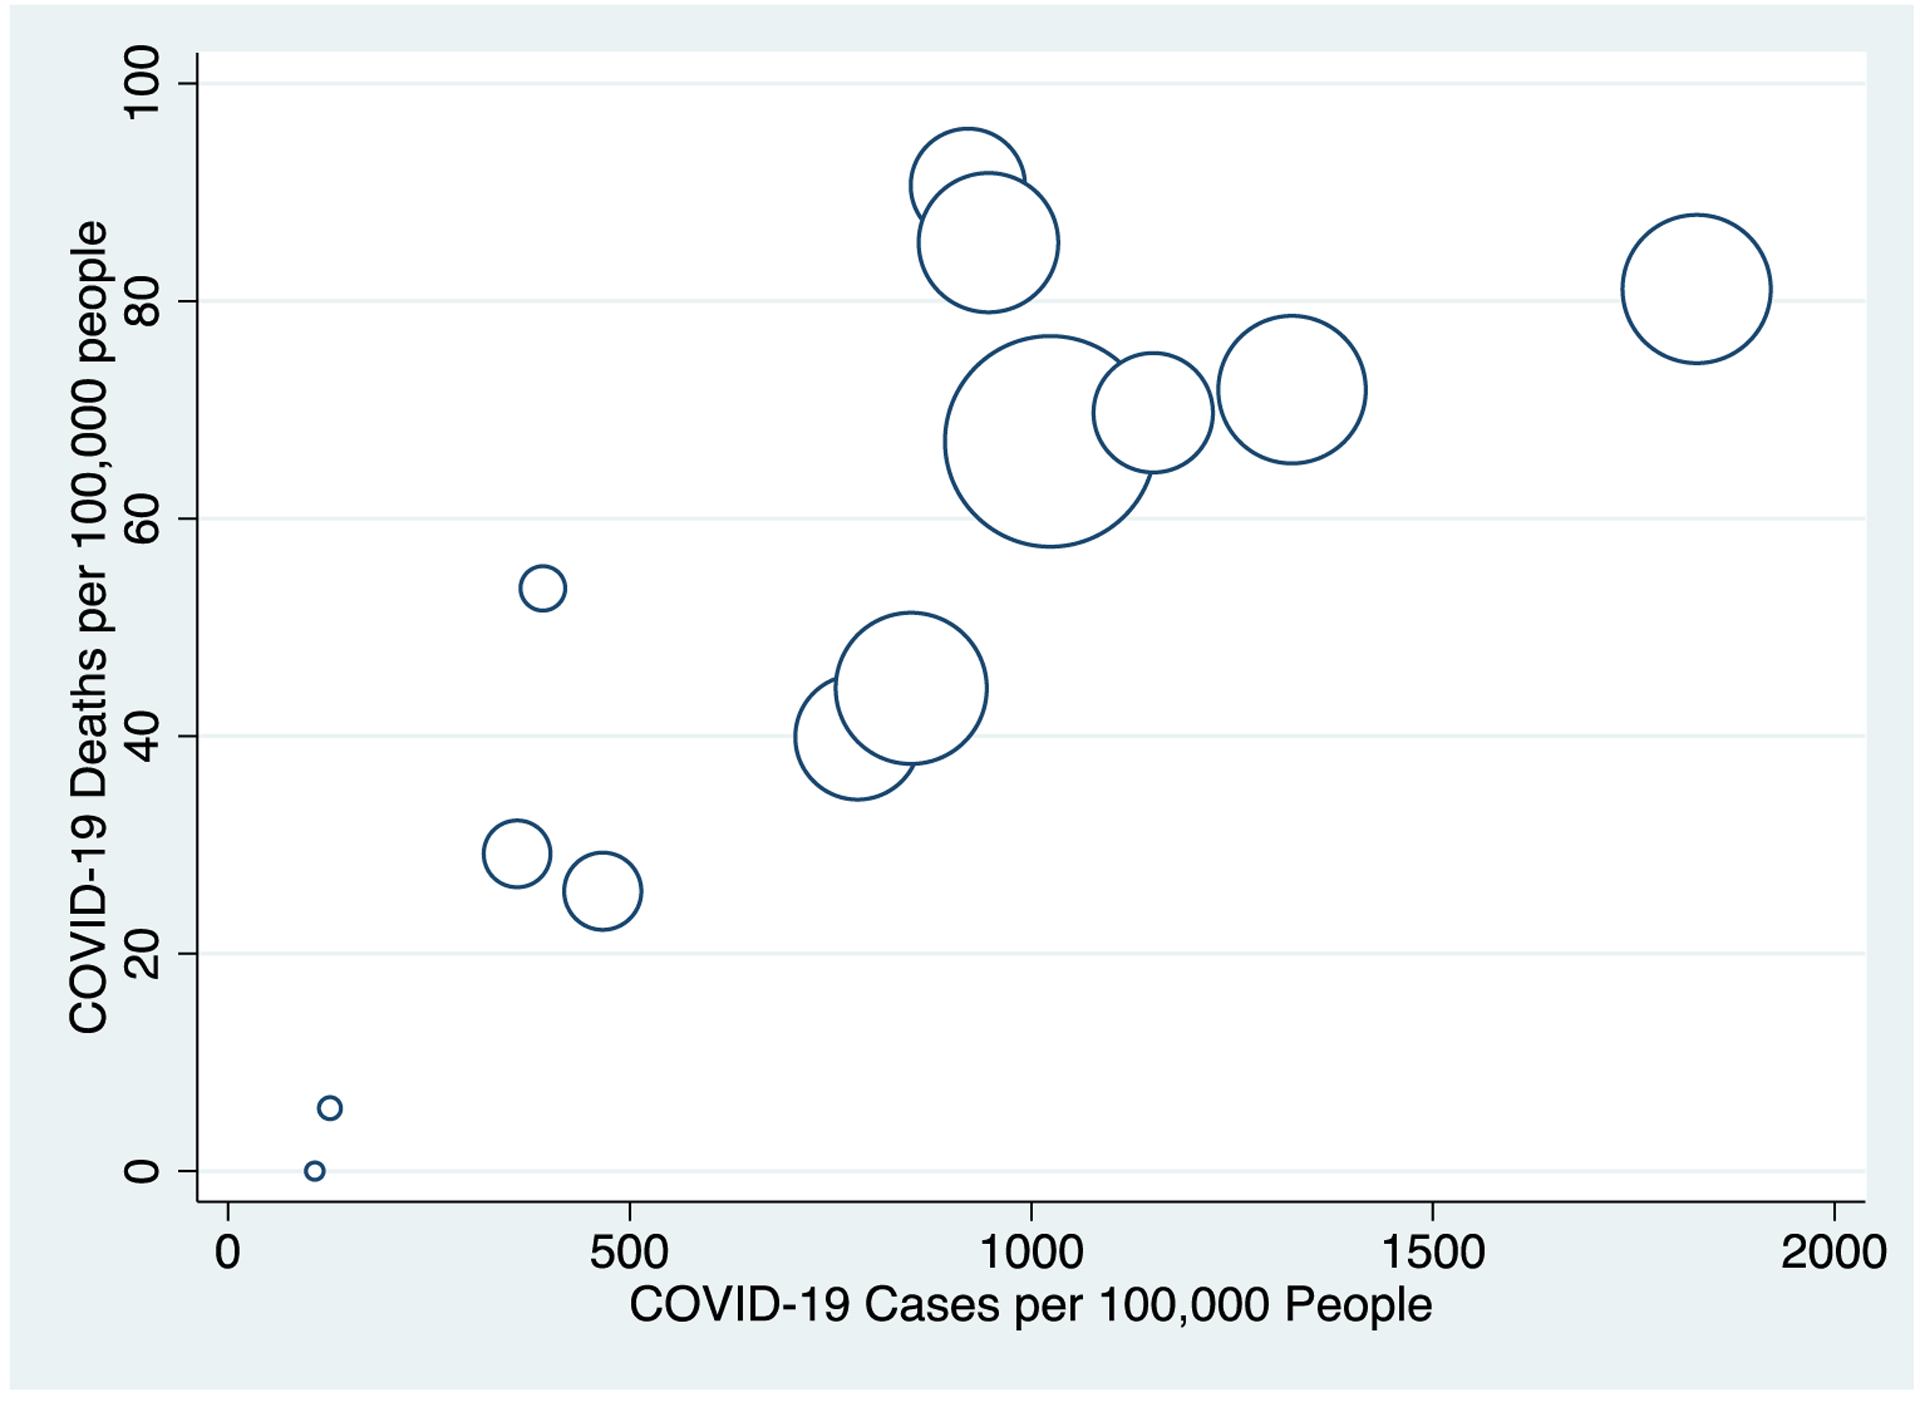
Massachusetts has one of the highest cumulative incidence rates of coronavirus disease 2019 (COVID-19) cases in the US. Understanding which specific demographic, economic, and occupational factors have contributed to disparities in COVID-19 incidence rates across the state is critical to informing public health strategies. We performed a cross-sectional study of 351 Massachusetts cities and towns from January 1 to May 6, 2020, and found that a 10-percentage-point increase in the Black non-Latino population was associated with an increase of 312.3 COVID-19 cases per 100,000 population, whereas a 10-percentage-point increase in the Latino population was associated with an increase of 258.2 cases per 100,000. Independent predictors of higher COVID-19 rates included the proportion of foreign-born noncitizens living in a community, mean household size, and share of food service workers. After adjustment for these variables, the association between the Latino population and COVID-19 rates was attenuated. In contrast, the association between the Black population and COVID-19 rates persisted but may be explained by other systemic inequities. Public health and policy efforts that improve care for foreign-born noncitizens, address crowded housing, and protect food service workers may help mitigate the spread of COVID-19 among minority communities.
Figures
References
-
- Coronavirus Resource Center. Coronavirus COVID-19 global cases [Internet]. Baltimore (MD): Center for Systems Science and Engineering, Johns Hopkins University and Medicine; 2020. [cited 2020 April 1]. Available from: https://coronavirus.jhu.edu/map.html
-
- Boston Public Health Commission. Boston COVID-19 report—Weekly report [Internet]. Boston (MA); 2020. [cited 2020 May 9]. Available from: https://bphc.org/whatwedo/infectious-diseases/Documents/COVID19%20Boston...
-
- Massachusetts Department of Public Health. COVID-19 dashboard [Internet]. Boston (MA): Mass.gov; 2020. May [cited 2020 May 10]. Available from: https://www.mass.gov/doc/covid-19-dashboard-may-10-2020/download
-
- An act addressing COVID-19 data collection and disparities in treatment. Bill No. H.4672. Commonwealth of Massachusetts. 191st Session 2020.
Publication types
MeSH terms
Grants and funding
LinkOut - more resources
Full Text Sources
Medical