

Ventilatory heterogeneity in the normal human lung is unchanged by controlled breathing
- PMID: 32853114
- PMCID: PMC7701356
- DOI: 10.1152/japplphysiol.00278.2020
Ventilatory heterogeneity in the normal human lung is unchanged by controlled breathing
Abstract
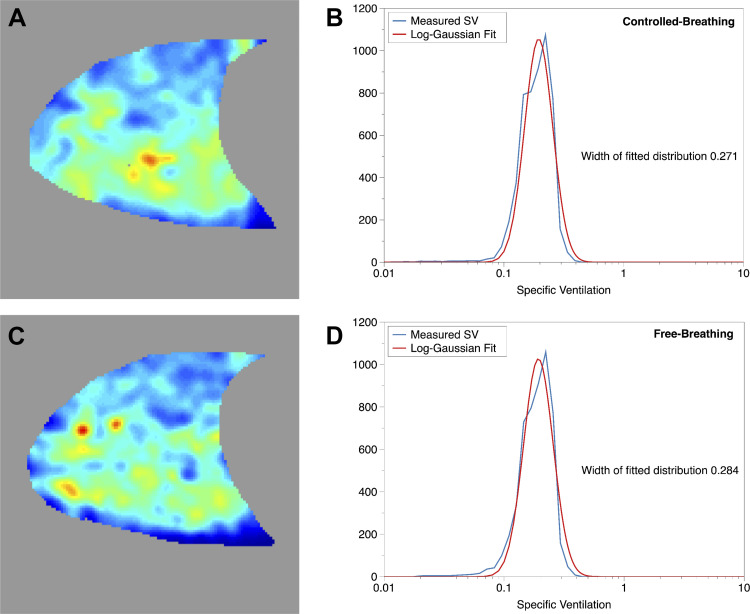
Measurement of ventilation heterogeneity with the multiple-breath nitrogen washout (MBW) is usually performed using controlled breathing with a fixed tidal volume and breathing frequency. However, it is unclear whether controlled breathing alters the underlying ventilatory heterogeneity. We hypothesized that the width of the specific ventilation distribution (a measure of heterogeneity) would be greater in tests performed during free breathing compared with those performed using controlled breathing. Eight normal subjects (age range = 23-50 yr, 5 female/3 male) twice underwent MRI-based specific ventilation imaging consisting of five repeated cycles with the inspired gas switching between 21% and 100% O2 every ~2 min (total imaging time = ~20 min). In each session, tests were performed with free breathing (FB, no constraints) and controlled breathing (CB) at a respiratory rate of 12 breaths/min and no tidal volume control. The specific ventilation (SV) distribution in a mid-sagittal slice of the right lung was calculated, and the heterogeneity was calculated as the full width at half max of a Gaussian distribution fitted on a log scale (SV width). Free breathing resulted in a range of breathing frequencies from 8.7 to 15.9 breaths/min (mean = 11.5 ± 2.2, P = 0.62, compared with CB). Heterogeneity (SV width) was unchanged by controlled breathing (FB: 0.38 ± 0.12; CB: 0.34 ± 0.09, P = 0.18, repeated-measures ANOVA). The imposition of a controlled breathing frequency did not significantly affect the heterogeneity of ventilation in the normal lung, suggesting that MBW and specific ventilation imaging as typically performed provide an unperturbed measure of ventilatory heterogeneity.NEW & NOTEWORTHY By using MRI-based specific ventilation imaging (SVI), we showed that the heterogeneity of specific ventilation was not different comparing free breathing and breathing with the imposition of a fixed breathing frequency of 12 breaths/min. Thus, multiple-breath washout and SVI as typically performed provide an unperturbed measure of ventilatory heterogeneity.
Keywords: MBW; SVI; washout.
Conflict of interest statement
No conflicts of interest, financial or otherwise, are declared by the authors.
Figures
Comment in
-
Breathing freely during nitrogen washout.J Appl Physiol (1985). 2020 Nov 1;129(5):1150-1151. doi: 10.1152/japplphysiol.00847.2020. Epub 2020 Oct 22. J Appl Physiol (1985). 2020. PMID: 33090907 Free PMC article. No abstract available.
Similar articles
-
Ventilation heterogeneity measured by multiple breath inert gas testing is not affected by inspired oxygen concentration in healthy humans.J Appl Physiol (1985). 2017 Jun 1;122(6):1379-1387. doi: 10.1152/japplphysiol.01013.2016. Epub 2017 Mar 9. J Appl Physiol (1985). 2017. PMID: 28280107 Free PMC article.
-
Validating the distribution of specific ventilation in healthy humans measured using proton MR imaging.J Appl Physiol (1985). 2014 Apr 15;116(8):1048-56. doi: 10.1152/japplphysiol.00982.2013. Epub 2014 Feb 6. J Appl Physiol (1985). 2014. PMID: 24505099 Free PMC article.
-
Comparison of quantitative multiple-breath specific ventilation imaging using colocalized 2D oxygen-enhanced MRI and hyperpolarized 3He MRI.J Appl Physiol (1985). 2018 Nov 1;125(5):1526-1535. doi: 10.1152/japplphysiol.00500.2017. Epub 2018 Aug 30. J Appl Physiol (1985). 2018. PMID: 30161004 Free PMC article.
-
The inspired sine-wave technique: A novel method to measure lung volume and ventilatory heterogeneity.Exp Physiol. 2018 May 1;103(5):738-747. doi: 10.1113/EP086867. Epub 2018 Mar 26. Exp Physiol. 2018. PMID: 29460470
-
Assessment of Heterogeneity in Lung Structure and Function During Mechanical Ventilation: A Review of Methodologies.J Eng Sci Med Diagn Ther. 2022 Nov 1;5(4):040801. doi: 10.1115/1.4054386. Epub 2022 May 11. J Eng Sci Med Diagn Ther. 2022. PMID: 35832339 Free PMC article. Review.
Cited by
-
Controlled versus free breathing for multiple-breath nitrogen washout in asthma.ERJ Open Res. 2021 Dec 6;7(4):00487-2021. doi: 10.1183/23120541.00487-2021. eCollection 2021 Oct. ERJ Open Res. 2021. PMID: 34881331 Free PMC article.
-
Vaping causes an acute BMI-dependent change in pulmonary blood flow.Physiol Rep. 2024 Oct;12(20):e70094. doi: 10.14814/phy2.70094. Physiol Rep. 2024. PMID: 39424421 Free PMC article.
-
Breathing freely during nitrogen washout.J Appl Physiol (1985). 2020 Nov 1;129(5):1150-1151. doi: 10.1152/japplphysiol.00847.2020. Epub 2020 Oct 22. J Appl Physiol (1985). 2020. PMID: 33090907 Free PMC article. No abstract available.
-
Relationships of computed tomography-based small vessel indices of the lungs with ventilation heterogeneity and high transfer coefficients in non-smokers with asthma.Front Physiol. 2023 Mar 1;14:1137603. doi: 10.3389/fphys.2023.1137603. eCollection 2023. Front Physiol. 2023. PMID: 36935740 Free PMC article.
-
Measuring short-term changes in specific ventilation using dynamic specific ventilation imaging.J Appl Physiol (1985). 2022 Jun 1;132(6):1370-1378. doi: 10.1152/japplphysiol.00652.2021. Epub 2022 Apr 28. J Appl Physiol (1985). 2022. PMID: 35482322 Free PMC article.
References
-
- Arai TJ, Horn FC, Sá RC, Rao MR, Collier GJ, Theilmann RJ, Prisk GK, Wild JM. Comparison of quantitative multiple-breath specific ventilation imaging using colocalized 2D oxygen-enhanced MRI and hyperpolarized 3He MRI. J Appl Physiol (1985) 125: 1526–1535, 2018. doi:10.1152/japplphysiol.00500.2017. - DOI - PMC - PubMed
-
- Buist AS, Ross BB. Predicted values for closing volumes using a modified single breath nitrogen test. Am Rev Respir Dis 107: 744–752, 1973. - PubMed
Publication types
MeSH terms
Grants and funding
LinkOut - more resources
Full Text Sources