. 2020 Oct 2;5(19):e139930.
doi: 10.1172/jci.insight.139930.

Contribution of plasma cells and B cells to hidradenitis suppurativa pathogenesis

Affiliations

Contribution of plasma cells and B cells to hidradenitis suppurativa pathogenesis

Johann E Gudjonsson et al. JCI Insight. .

Abstract

Hidradenitis suppurativa (HS) is a debilitating chronic inflammatory skin disease characterized by chronic abscess formation and development of multiple draining sinus tracts in the groin, axillae, and perineum. Using proteomic and transcriptomic approaches, we characterized the inflammatory responses in HS in depth, revealing immune responses centered on IFN-γ, IL-36, and TNF, with lesser contribution from IL-17A. We further identified B cells and plasma cells, with associated increases in immunoglobulin production and complement activation, as pivotal players in HS pathogenesis, with Bruton's tyrosine kinase (BTK) and spleen tyrosine kinase (SYK) pathway activation as a central signal transduction network in HS. These data provide preclinical evidence to accelerate the path toward clinical trials targeting BTK and SYK signaling in moderate-to-severe HS.

Keywords: B cells; Complement; Dermatology; Immunology; Skin.


Conflict of interest statement

Conflict of interest: ASM is a consultant for SILAB and has received funding from SILAB in the past. ASM also consults for the LEO Foundation, and ASM’s spouse is employed by Precision BioSciences and holds stock and stock options. JEG is an advisor to Almirall, AnaptysBio, and Eli Lilly and Company and has received research grants from Eli Lilly and Company, Almirall, Novartis, and Pfizer.

Figures

Figure 1
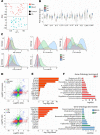
Figure 1. Characterization of the inflammatory process in HS by RNA-Seq is suggestive of heightened B cell responses.
PCA plots of skin (top, red), and blood (bottom, blue) in patients with HS (n = 22) and healthy controls (n = 10) (A). Comparison of fold change mRNA expression of key proinflammatory cytokines in HS compared with psoriasis and AD (n = 22 HS, n = 28 psoriasis, n = 32 AD). Medians are shown in the middle of each plot. (B). Comparison of key proinflammatory cytokine responses in HS skin compared with psoriasis and AD. (n = 22 HS, n = 28 psoriasis, n = 32 AD) (red bar indicates baseline responses in uninflamed control skin) (C). Comparison of DEGs in HS skin against psoriasis (n = 28) and AD (n = 32). Unique genes in HS are shown in red, genes unique to psoriasis or AD are shown in green, and genes significant in both are shown in blue (D). Enriched B cell signatures in skin of patients with HS but T cell responses in blood of patients with HS (E). Enriched biological processes and Kyoto Encyclopedia of Genes and Genomes (KEGG) pathways in increased (top) and decreased (bottom) DEGs in HS skin (F).
Figure 2
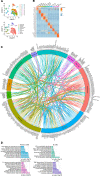
Figure 2. scRNA-Seq helps characterize the inflammatory cell composition of HS.
scRNA-sequencing (scRNA-Seq) was performed on skin cells isolated from patients with moderate-to-severe HS undergoing surgical excisions (n = 9). Information on 30,636 cells across 23 cellular clusters representing 10 cellular subsets (A). Heatmap of the top 3 transcripts in each cluster showed clear demarcation between different clusters (B). Cell-cell receptor-ligand communication between inflammatory infiltrate and stromal tissues for the top 200 receptor-ligand pairs (C). Enriched biological categories among genes expressed in the 4 major inflammatory cell clusters (D).
Figure 3
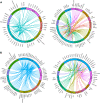
Figure 3. Interactions of B cells and plasma cells with HS microenvironment.
Data from single-cell sequencing were used to map receptor-ligand interactions from and to B cells (A) and to and from plasma cells (B) (n = 9).
Figure 4
Figure 4. Inflammatory responses in HS keratinocytes have elevated type II IL-17, TNF, and IL-36 responses.
Transcriptomic information was available on 20,587 keratinocytes from HS skin. These were divided into 13 clusters (A). A dot plot showing the top 3 markers for each cluster marked the defining genes for each cluster, although with some overlap between clusters (B). Transcriptomic cytokine responses from several proinflammatory cytokines were used to interrogate each keratinocyte for each particular inflammatory signature, with cluster 7 showing overall the highest and broadest inflammatory signal, but with different specific inflammatory responses having different cluster localization in HS keratinocytes (n = 9) (see Methods) (C).
Figure 5
Figure 5. IFN-γ and IL-36 responses are the most prominent keratinocyte immune responses in HS skin.
Specific cytokine responses were superimposed on the keratinocyte UMAP clusters to determine the distribution of key cytokine responses across different clusters (A). Circos plots were used to show the connection between the major inflammatory signals (lines) and the specificity (red line) to different keratinocyte clusters (clusters 0–12). Of these the IFN-γ and IL-36 responses had the highest degree of specificity (B) (n = 9).
Figure 6
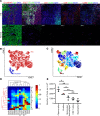
Figure 6. B and plasma cells are the dominant infiltrating leukocytes in HS.
Analysis of the CyTOF data by t-distributed stochastic neighbor embedding (t-SNE) dimensionality reduction demonstrated clear separation between HS and normal skin (A) (scale bar: 100 μm), with the staining forming 14 distinct Phenograph clusters, of which only 2 were found in normal skin (B and C). Heatmap showing marker expression of each cluster (D). Quantification of the different subsets based on surface markers (E) (n = 3, Student’s t test, **P < 0.01; *P < 0.05; NS, nonsignificant).
Figure 7
Figure 7. Increased immunoglobulin production and antibody diversity in HS skin and complement activation.
Box-and-whisker plots of BCR CDR3 expressions (A). The y axis shows normalized log-transformed BCR CDR3 expression. The x axis represents patient group. In all cases there were more BCR CDR3 sequences detected in HS skin compared with control healthy skin. Box-and-whisker plots of BCR gene segment expression. The y axis shows normalized log-transformed BCR gene segment expression. The x axis represents patient group. The Shannon diversity index for BCR CDR3 gene segment is plotted on the y axis. The x axis represents patient group. HS skin had a significantly more diverse BCR repertoire (B). Beta diversity–based principal coordinates analysis (PCoA) of BCR CDR3 sequences. Sample matrix was generated using Jaccard dissimilarities, and respective profiles were compared by PCoA. Each color represents 1 patient group, HS (red) and control (blue). This analysis revealed clear separation for κ and λ light chains but not Ig heavy chain (C) Hierarchical clustering of expressed TCR V/J gene segment expression. Heatmaps by clonal abundance across sample sets. Note good separation of HS from controls based upon clonal abundances in BCR κ and λ repertoires. Components of the complement pathway (C1q) and breakdown products of activated complement components (C3b, C4d) were increased in HS skin, particularly in the deeper layers of the skin (n = 3) (scale bar: 100 μm) (D). Complement receptors, CR1 and CR2, were increased in the deeper layers of HS, along with IgG1 immune complex deposition (n = 3) (scale bar: 100 μm) (E). Immunofluorescence of B cells (CD20) and plasma cells (CD138) showed primary localization of TNF to the plasma cell population in HS skin (n = 3) (scale bar: 50 μm) (F). For A and B, the bold vertical line represents the median, and the upper and lower limits of the box represent the interquartile range (IQR). The whiskers represent 1.5× IQR.
Figure 8
Figure 8. Enrichment and activation of B cell–associated signaling pathways in HS skin.
Analysis of the signal transduction networks using literature-based networks (Genomatix-Pathway System, GePS) demonstrated enrichment for pathways involved in B cell signaling and activation (A). To confirm the nature of the inflammatory infiltrate in HS and the localization of components of the enriched signaling pathways, we performed IHC in an excisional biopsy for CD3, CD20, and CD138. Plasma cells were the predominant inflammatory infiltrate and most prominent in the deeper layers of the skin surrounding a deeper sinus tract (A), accompanied by increased expression of BTK, SYK, and LCK (B) (n = 3). Activation of key components of this signaling pathway was confirmed by IHC for both phospho-BTK and phospho-SYK (n = 3) (C).
Figure 9
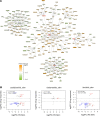
Figure 9. B cell receptor signaling is central to HS transcriptomic changes and a potential therapeutic target in HS.
Outline of the GePS network in HS skin centered on critical inflammatory nodes, including BTK, SYK, JUN, and STAT1 signaling (red/brown indicating increased expression and green indicating decreased expression) (A). Overlap between gene expression in activated B cells (IgG/IgM stimulated) treated with the BTK inhibitors acalabrutinib and ibrutinib and the SYK inhibitor fostamatinib (B) (n = 3).

References

    1. Sabat R, Jemec GBE, Matusiak Ł, Kimball AB, Prens E, Wolk K. Hidradenitis suppurativa. Nat Rev Dis Primers. 2020;6(1):18. doi: 10.1038/s41572-020-0149-1. - DOI - PubMed
    1. Jemec GB, Heidenheim M, Nielsen NH. The prevalence of hidradenitis suppurativa and its potential precursor lesions. J Am Acad Dermatol. 1996;35(2 pt 1):191–194. - PubMed
    1. Garg A, Lavian J, Lin G, Strunk A, Alloo A. Incidence of hidradenitis suppurativa in the United States: a sex- and age-adjusted population analysis. J Am Acad Dermatol. 2017;77(1):118–122. doi: 10.1016/j.jaad.2017.02.005. - DOI - PubMed
    1. Garg A, Kirby JS, Lavian J, Lin G, Strunk A. Sex- and age-adjusted population analysis of prevalence estimates for hidradenitis suppurativa in the United States. JAMA Dermatol. 2017;153(8):760–764. doi: 10.1001/jamadermatol.2017.0201. - DOI - PMC - PubMed
    1. Kohorst JJ, Kimball AB, Davis MD. Systemic associations of hidradenitis suppurativa. J Am Acad Dermatol. 2015;73(5 suppl 1):S27–S35. - PubMed

Publication types

MeSH terms