. 2020 Sep:59:102970.
doi: 10.1016/j.ebiom.2020.102970. Epub 2020 Aug 24.

The neuropeptide calcitonin gene-related peptide alpha is essential for bone healing

Affiliations

The neuropeptide calcitonin gene-related peptide alpha is essential for bone healing

Jessika Appelt et al. EBioMedicine. 2020 Sep.

Abstract

Background: Impaired fracture healing represents an ongoing clinical challenge, as treatment options remain limited. Calcitonin gene-related peptide (CGRP), a neuropeptide targeted by emerging anti-migraine drugs, is also expressed in sensory nerve fibres innervating bone tissue.

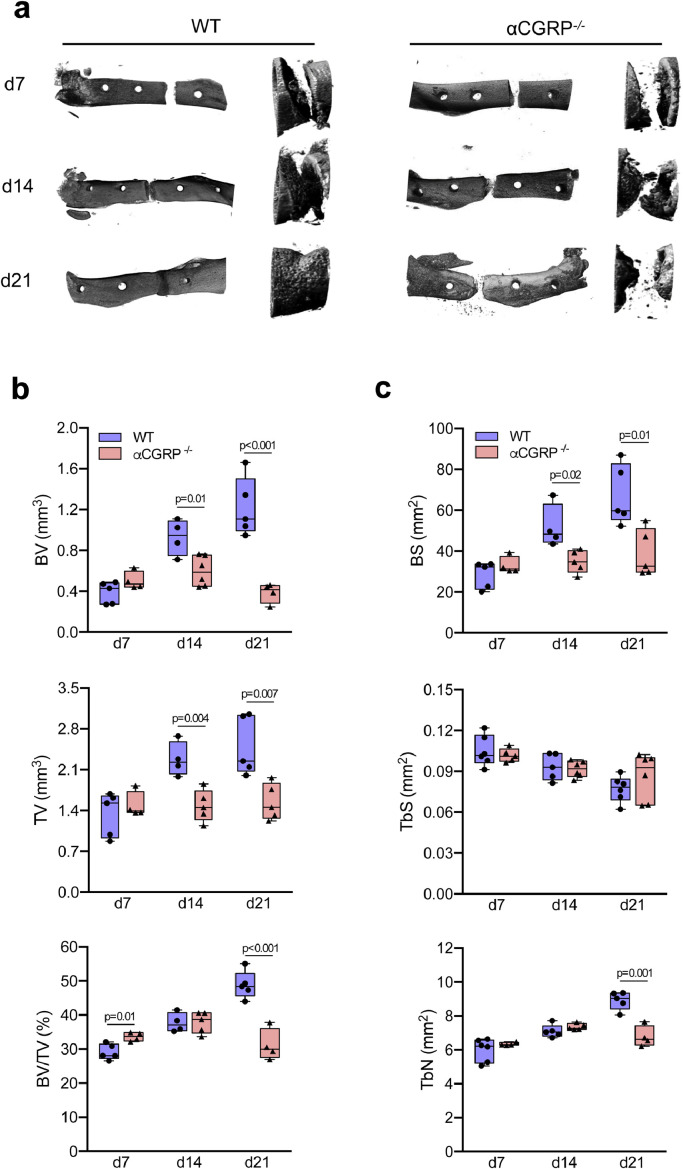
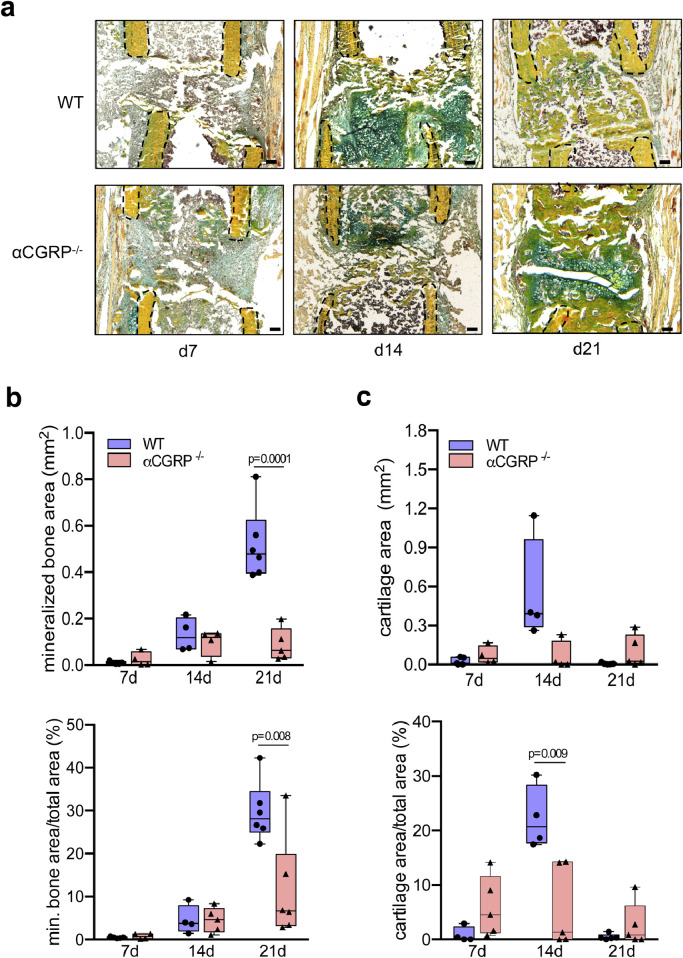
Method: Bone healing following a femoral osteotomy stabilized with an external fixator was analysed over 21 days in αCGRP-deficient and WT mice. Bone regeneration was evaluated by serum analysis, µCT analysis, histomorphometry and genome-wide expression analysis. Bone-marrow-derived osteoblasts and osteoclasts, as well as the CGRP antagonist olcegepant were employed for mechanistic studies.

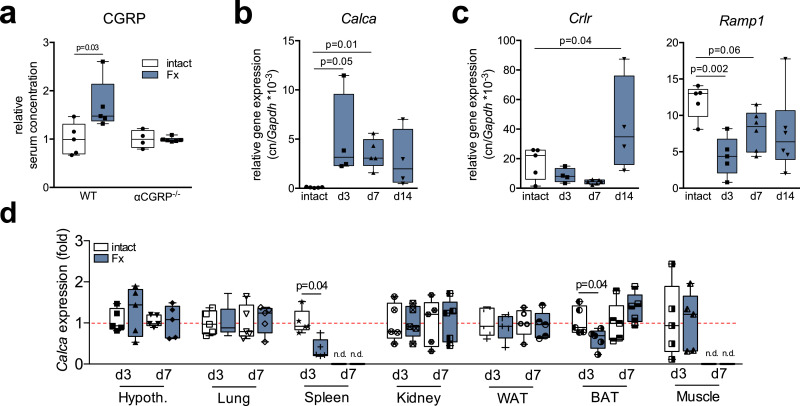
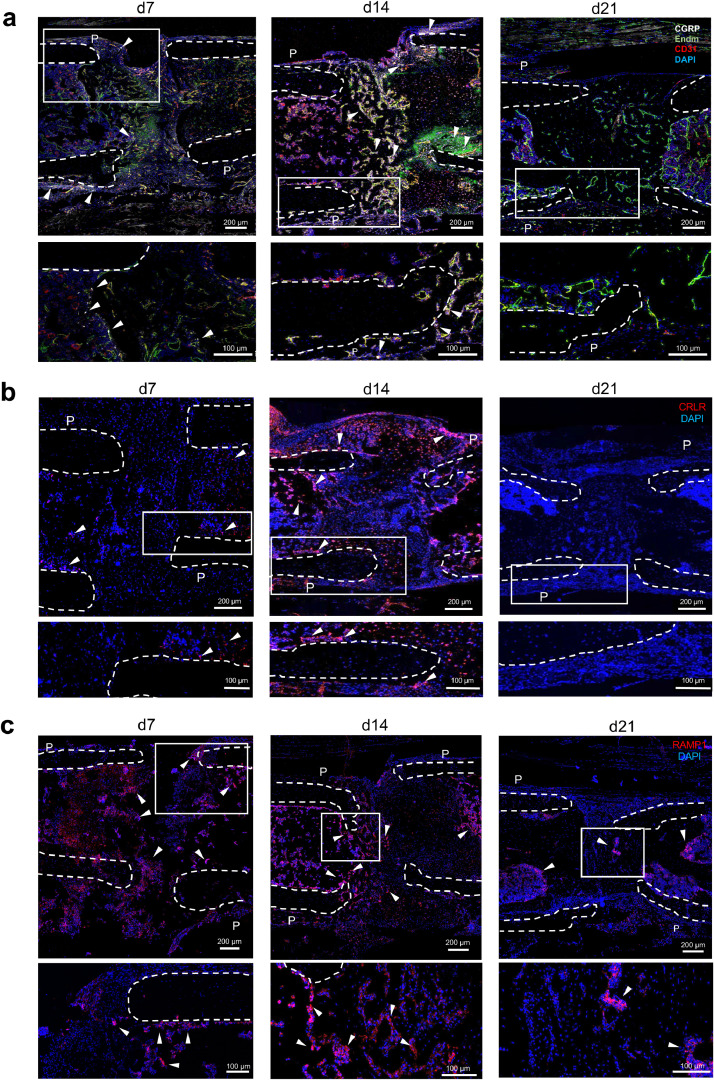
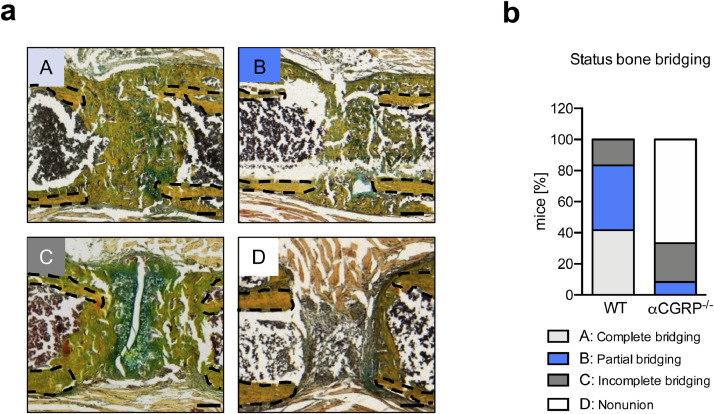
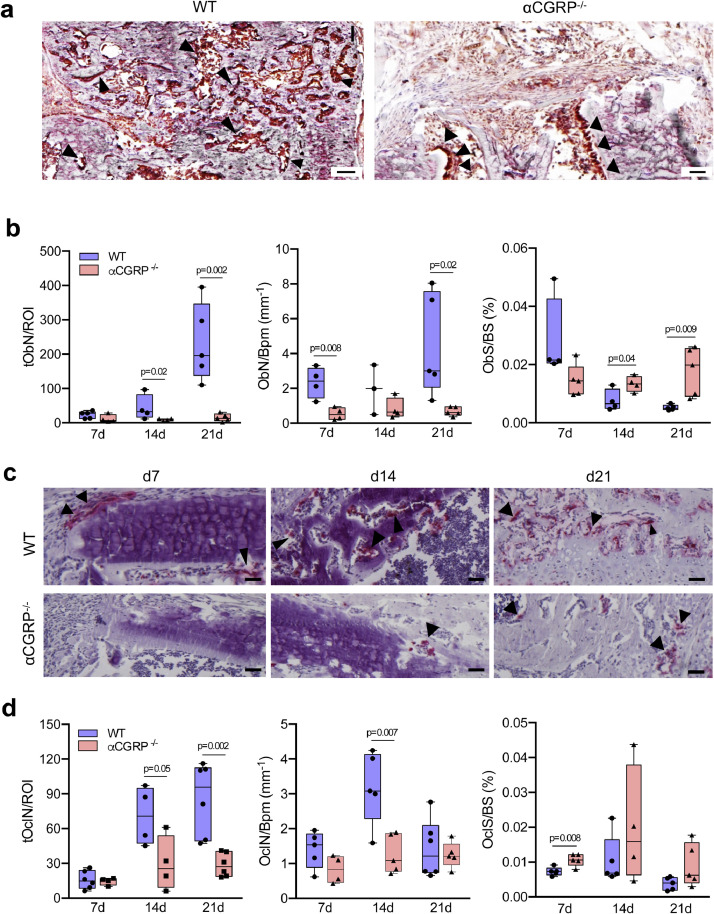
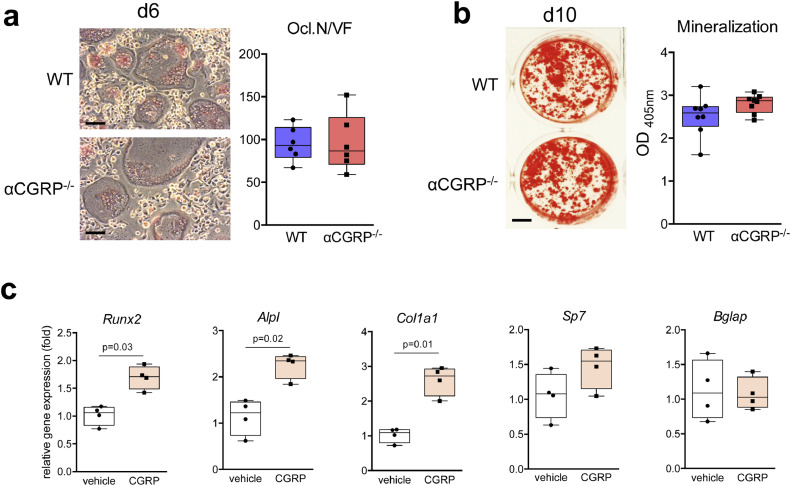
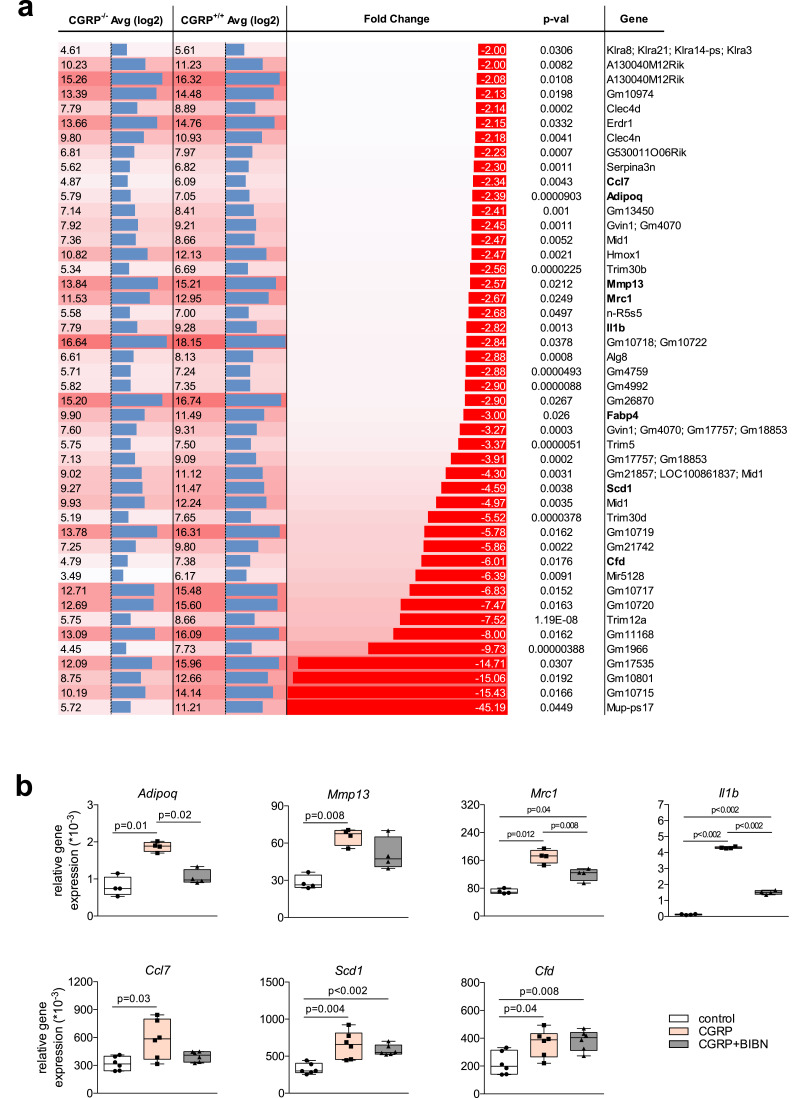
Findings: WT mice with a femoral fracture display increased CGRP serum levels. αCGRP mRNA expression after skeletal injury is exclusively induced in callus tissue, but not in other organs. On protein level, CGRP and its receptor, calcitonin receptor-like receptor (CRLR) complexing with RAMP1, are differentially expressed in the callus during bone regeneration. On the other hand, αCGRP-deficient mice display profoundly impaired bone regeneration characterised by a striking reduction in the number of bone-forming osteoblasts and a high rate of incomplete callus bridging and non-union. As assessed by genome-wide expression analysis, CGRP induces the expression of specific genes linked to ossification, bone remodeling and adipogenesis. This suggests that CGRP receptor-dependent PPARγ signaling plays a central role in fracture healing.

Interpretation: This study demonstrates an essential role of αCGRP in orchestrating callus formation and identifies CGRP receptor agonism as a potential approach to stimulate bone regeneration. Moreover, as novel agents blocking CGRP or its receptor CRLR are currently introduced clinically for the treatment of migraine disorders, their potential negative impact on bone regeneration warrants clinical investigation.

Funding: This work was funded by grants from the Else-Kröner-Fresenius-Stiftung (EKFS), the Deutsche Forschungsgemeinschaft (DFG), and the Berlin Institute of Health (BIH).

Keywords: Bone regeneration; CRLR; Fracture; Neuropeptides; Olcegepant; Osteoblasts; Osteoclasts; αCGRP.


Conflict of interest statement

Declarations of Competing Interest All authors state that they have no conflict of interest.

Figures

Fig. 1
Fig. 1
CGRP and CGRP receptor are expressed in the fracture callus on mRNA level. (a) Relative serum CGRP levels in WT and αCGRP-deficient mice with a femoral osteotomy stabilized with an external fixator 14 days post-injury. n = 4–6 mice per group (unpaired student's t-test). (b, c) Gene expression (virtual copy numbers per Gapdh) of the indicated genes in the intact femoral shaft of control animals (intact) and in the fracture callus at the respective time points during bone regeneration (d3, d7, d14). Calca = encoding αCGRP; Crlr = calcitonin receptor-like receptor; Ramp1 = receptor activity-modifying protein 1. n = 4–6 mice per group (one-way Anova followed by Tukey post-hoc test). (d) Calca expression (fold) in the indicated tissues 3 and 7 days following Fx. Hypoth. = hypothalamus; WAT = white adipose tissue; BAT = brown adipose tissue; n.d. = not detectable. The dotted red line indicates average expression of respective, untreated control tissues. n = 3–5 mice per group (unpaired student's t-test). For (a-d), box plots represent median with minimum and maximum whiskers. Controls are untreated mice of the same sex and age.
Fig. 2
Fig. 2
CGRP and CGRP receptor are expressed in the fracture callus on protein level. (a) Representative immunofluorescent stainings (merged) of WT callus sections 7, 14, and 21 days after surgery using a CGRP-, endomucin- (Edm) and CD31-specific antibody. (b, c) Representative immunofluorescent stainings of WT callus sections 7, 14 and 21 days after surgery using a CRLR or RAMP1-specific antibody as indicated. P = periosteum. White boxes of the upper row show the magnified area illustrated below. Arrows indicate CGRP-, CRLR- orRAMP1-positive structures, respectively, and dotted white line show the fracture ends.
Fig. 3
Fig. 3
Deficiency in αCGRP results in the failure of bone regeneration. (a) Representative µCT images (left column= longitudinal overview; right column = longitudinal magnification) of the callus region in the femur of WT and αCGRP-deficient mice at the indicated time points. (b) Quantitative analysis of µCT images in mice of both genotypes at the same time points. BV = total callus bone volume, TV = total tissue volume, BV/TV = bone volume vs. tissue volume. (c) Quantitative analysis of µCT images in the same samples. BS = bone surface, TbS = trabecular surface, TbN = trabecular numbers. For (b) and (c), the different timepoints were evaluated independently and compared by unpaired student's t-test. n = 4–6 as indicated per group and time point. Box plots represent median with minimum and maximum whiskers.
Fig. 4
Fig. 4
Impaired callus formation in αCGRP-deficient mice. (a) Representative callus sections (Movat Pentachrome staining) of WT and αCGRP-deficient mice at the indicated time points (yellow = mineralized bone; green = cartilage; red = muscle). Black dotted line indicates fractured bone cortices within the developing callus. (b, c) Histomorphometric quantification of static callus parameters in the same mice. Scale bars = 200 μm. n = 4–6 as indicated per group and time point. Box plots represent median with minimum and maximum whiskers. For (b) and (c), the different timepoints were evaluated independently and compared by unpaired student's t-test.
Fig. 5
Fig. 5
High rate of fracture non-union in αCGRP-deficient mice. (a) Exemplary callus images (Movat Pentachrome staining) representing the different outcomes of callus union at day 21 following Fx: A = complete bridging (all four cortices bridged by callus), B = partial bridging (two to three cortices bridged by callus), C = incomplete bridging (callus present, but no bridging visible), and D = non-union (rounded cortices, minimal presence of callus). Black dotted line indicates fractured bone cortices within the developing callus. (b) Semiquantitative evaluation of callus bridging in WT and αCGRP-deficient mice at the indicated time points. n = 6 mice per group. Scale bars = 200 μm.
Fig. 6
Fig. 6
αCGRP-deficient mice display profound alterations in callus bone cell distribution. (a) Representative callus images demonstrating osteocalcin-positive (brown), bone-forming osteoblasts (black arrows) in WT and αCGRP-deficient mice at d21 following surgery. Scale bars = 100 μm. (b) Histomorphometric quantification of osteoblast parameters in the callus of the same mice at the indicated time points. tObN/ROI = total osteoblast numbers in the callus area; ObN/Bpm = osteoblast numbers per bone perimeter; ObS/BS = osteoblast surface per bone surface. (c) Representative callus images (TRAP activity staining) demonstrating tissue-resorbing osteoclasts (red staining, arrows) in WT and αCGRP-deficient mice at the indicated time points. Scale bars = 200 μm. (d) Histomorphometric quantification of osteoclast parameters in the callus of the same mice. tOcN/ROI = total osteoclast numbers in the callus area; OcN/Bpm = osteoclast numbers per bone perimeter; OcS/BS = osteoclast surface per bone surface. For (b) and (d), n = 4–6 as indicated per group and time point. The different timepoints were evaluated independently and compared by unpaired student's t-test. Box plots represent median with minimum and maximum whiskers.
Fig. 7
Fig. 7
Osteogenesis and osteoclastogenesis is not affected in bone-marrow cells derived from αCGRP-deficient mice. (a) TRAP activity staining of WT and αCGRP-deficient, bone marrow-derived osteoclasts differentiated in the presence of M-CSF and RANKL (staining performed at day 6 of differentiation). Scale bars = 50 μm. The quantification of osteoclast numbers per viewing field is depicted on the right (Ocl.N./VF). n = 6 independent cultures per group. (b) Alizarin red staining of bone marrow-derived osteoblasts from the same mice differentiated in the presence of ascorbic acid and β-glycerophosphate at day 10 of osteogenic differentiation. Scale bar = 4 mm. The quantification of extracellular matrix mineralization is depicted on the right. n = 8 independent cultures per group. (c) qRT-PCR expression analysis (fold) for the indicated genes in bone marrow-derived osteoblasts at day 2 of osteogenic differentiation with ascorbic acid and β-glycerophosphate, stimulated with CGRP (10−7 M) for 6 h. n = 4 independent cultures per group (unpaired student's t-test).
Fig. 8
Fig. 8
Decreased expression of genes associated with bone formation, remodeling, and PPARγ signaling in the callus of αCGRP-deficient mice. (a) Average (Avg log2) and relative (fold) expression of genes with significant reduction in day 7 callus tissue from 12-week-old female mice using genome-wide expression analysis (αCGRP-deficient mice vs. WT mice; n = 3 per genotype). (b) qRT-PCR expression analysis (virtual copy numbers per Gapdh) for the indicated genes in bone marrow-derived osteoblasts at day 2 of osteogenic differentiation with ascorbic acid and β-glycerophosphate, stimulated with αCGRP (10−7 M) and olcegepant (1μg/ml; BIBN) for 6 h as indicated. n = 4–6 independent cultures per group (two-way Anova followed by Tukey post-hoc test).

References

    1. Russow G., Jahn D., Appelt J., Märdian S., Tsitsilonis S., Keller J. Anabolic therapies in osteoporosis and bone regeneration. Int J Mol Sci. 2018;20(1) - PMC - PubMed
    1. Tzioupis C., Giannoudis P.V. Prevalence of long-bone non-unions. Injury. 2007;38(Suppl 2):S3–S9. - PubMed
    1. Hak D.J., Fitzpatrick D., Bishop J.A., Marsh J.L., Tilp S., Schnettler R. Delayed union and non-unions: epidemiology, clinical issues, and financial aspects. Injury. 2014;45(Suppl 2):S3–S7. - PubMed
    1. Hankenson K.D., Gagne K., Shaughnessy M. Extracellular signaling molecules to promote fracture healing and bone regeneration. Adv Drug Deliv Rev. 2015;94:3–12. - PubMed
    1. Einhorn T.A., Gerstenfeld L.C. Fracture healing: mechanisms and interventions. Nat Rev Rheumatol. 2015;11(1):45–54. - PMC - PubMed

MeSH terms