. 2020 Aug 12;23(9):101457.
doi: 10.1016/j.isci.2020.101457. eCollection 2020 Sep 25.

STRAP and NME1 Mediate the Neurite Growth-Promoting Effects of the Neurotrophic Factor GDF5

Affiliations

STRAP and NME1 Mediate the Neurite Growth-Promoting Effects of the Neurotrophic Factor GDF5

Jayanth Anantha et al. iScience. .

Abstract

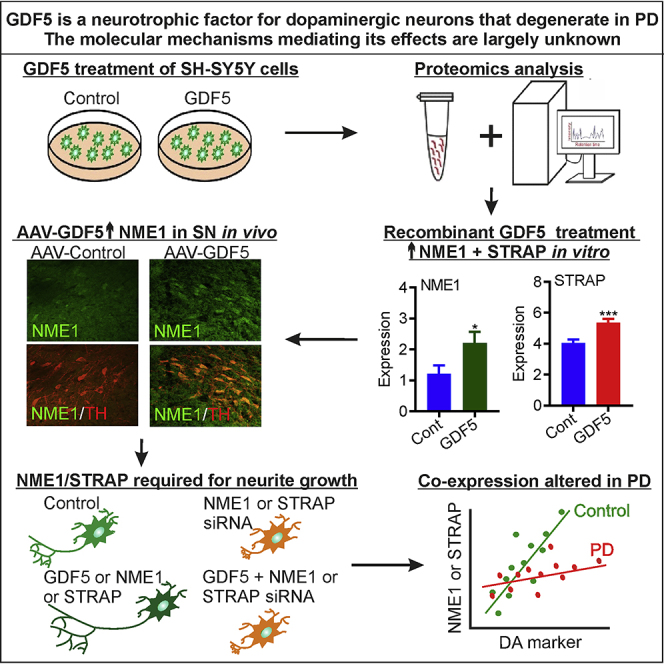
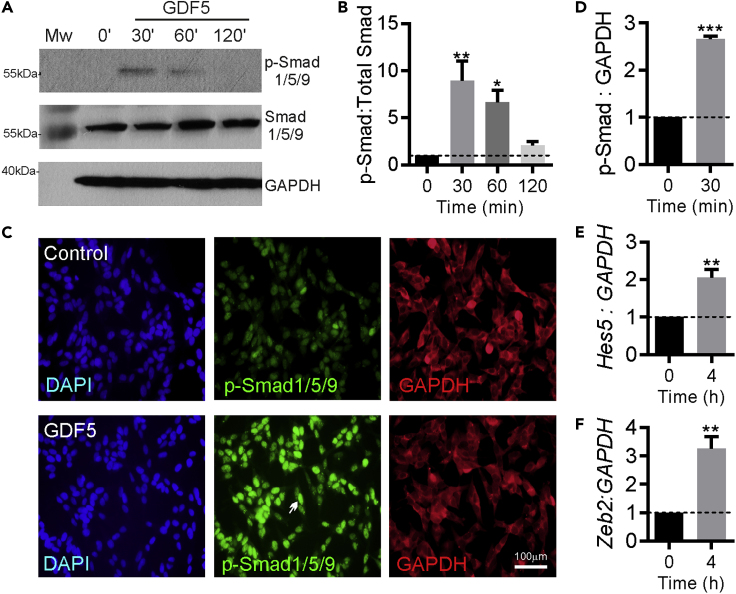
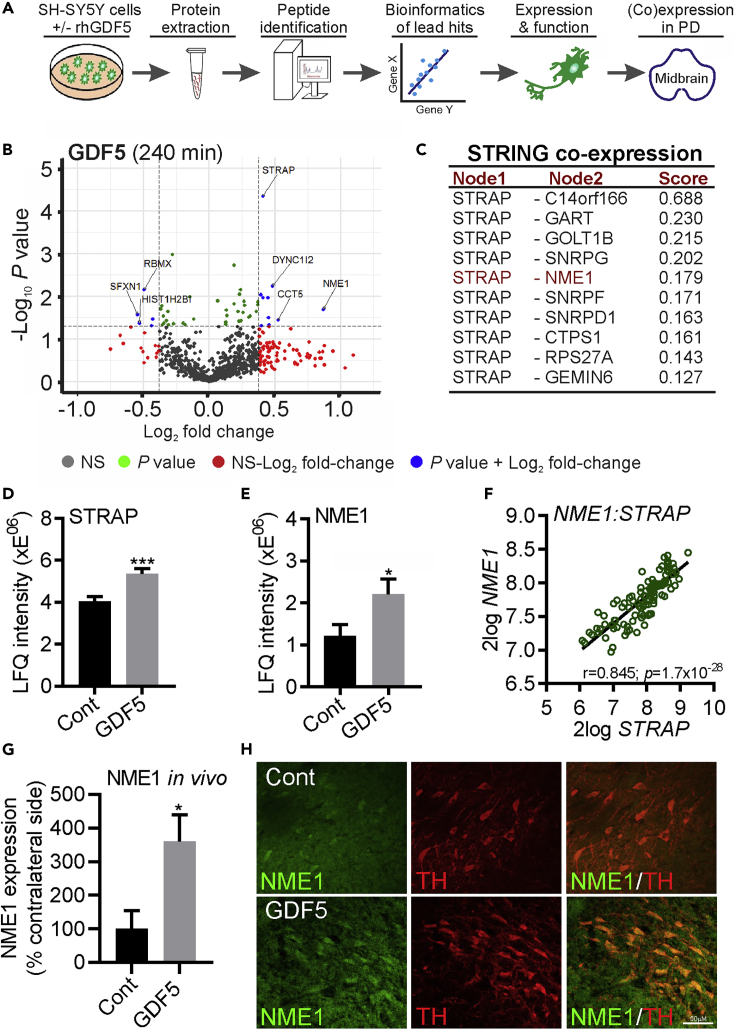
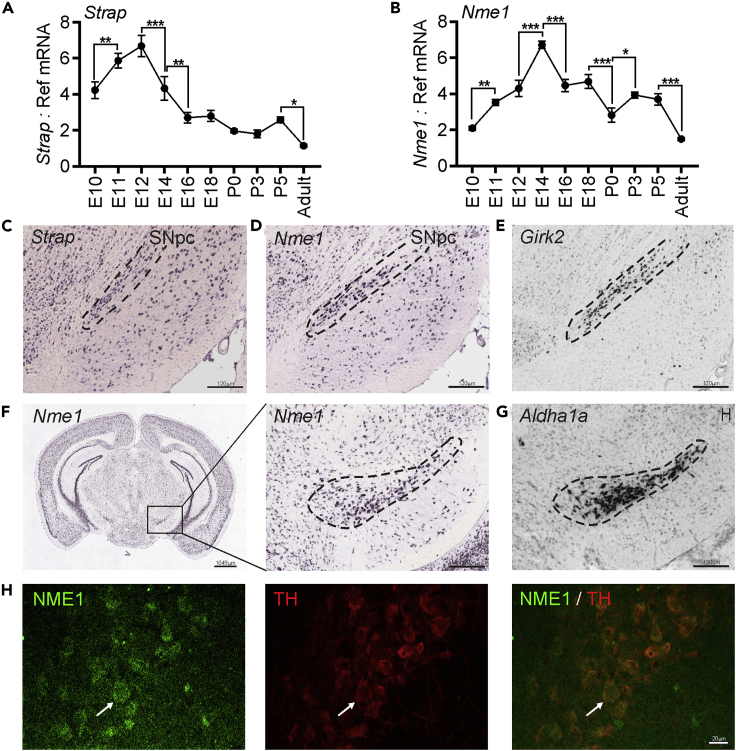
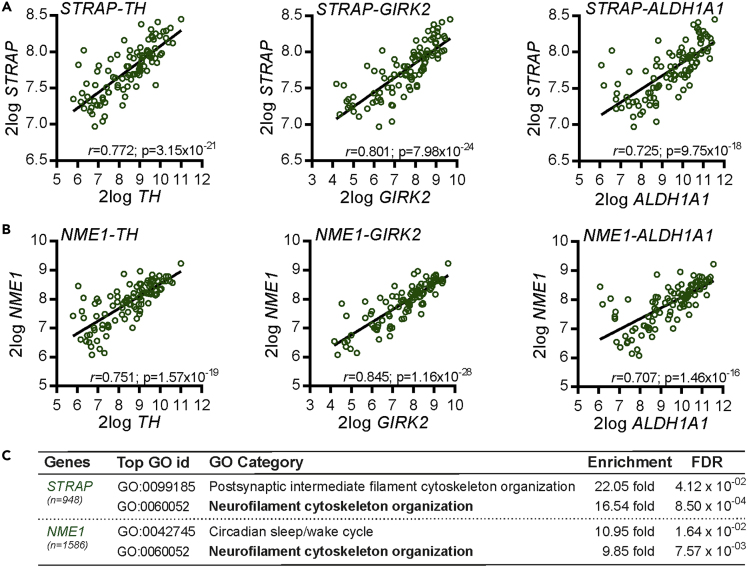
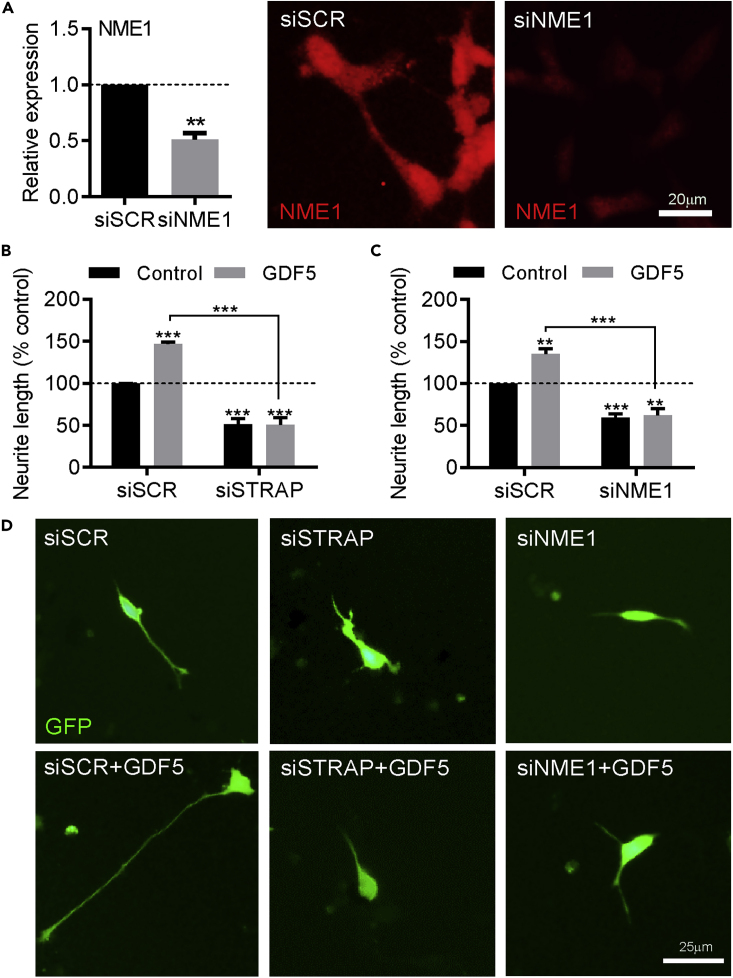
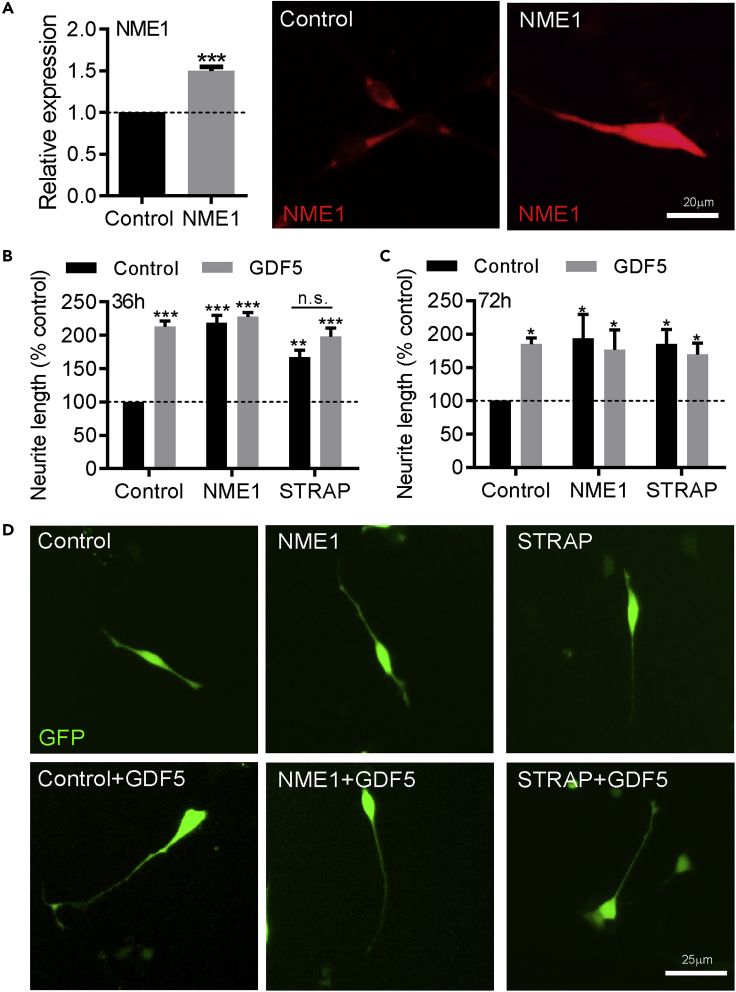
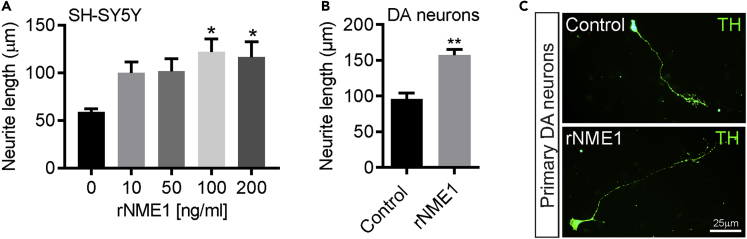
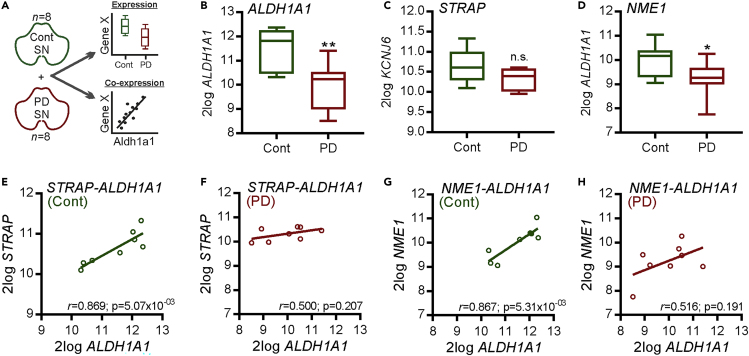
Loss of midbrain dopaminergic (mDA) neurons and their axons is central to Parkinson's disease (PD). Growth differentiation factor (GDF)5 is a potential neurotrophic factor for PD therapy. However, the molecular mediators of its neurotrophic action are unknown. Our proteomics analysis shows that GDF5 increases the expression of serine threonine receptor-associated protein kinase (STRAP) and nucleoside diphosphate kinase (NME)1 in the SH-SY5Y neuronal cell line. GDF5 overexpression increased NME1 expression in adult rat brain in vivo. NME and STRAP mRNAs are expressed in developing and adult rodent midbrain. Expression of both STRAP and NME1 is necessary and sufficient for the promotion of neurite growth in SH-SY5Y cells by GDF5. NME1 treatment increased neurite growth in both SH-SY5Y cells and cultured mDA neurons. Expression patterns of NME and STRAP are altered in PD midbrain. NME1 and STRAP are thus key mediators of GDF5's neurotrophic effects, rationalizing their future study as therapeutic targets for PD.

Keywords: Molecular Biology; Neuroscience; Proteomics.


Conflict of interest statement

The authors declare that the research was conducted in the absence of any commercial or financial relationships that could be construed as a potential conflict of interest.

Figures

None
Graphical abstract
Figure 1
Figure 1
GDF5 Activates Smad Signaling and Induces a Transcriptional Response in SH-SY5Y Cells (A and B) (A) Representative western blots and (B) densitometry showing the relative level of phospho(p)-Smad1/5/9 staining, normalized to that of Smad1/5/9, in SH-SY5Y cells treated with 100 ng/mL GDF5 for 30, 60, or 120 min. Data are mean ± SEM from three independent experiments (n = 3) (∗p < 0.05, ∗∗p < 0.01 versus control; one-way ANOVA with Tukey post-hoc test). (C–F) (C) Representative images of p-Smad1/5/9 (green), GAPDH (red), and DAPI (blue) staining and (D) graph showing the relative level of p-Smad1/5/9 staining normalized to that of GAPDH in SH-SY5Y cells treated with 100 ng/mL GDF5 for 30 min. Real-time PCR data showing the relative expression of transcripts for (E) Hes5 and (F) Zeb2 mRNA normalized to GAPDH mRNA in SH-SY5Y cells treated with 100 ng/mL GDF5 for 4 h. Data are shown as mean ± SEM from three independent experiments (n = 3) (∗∗p < 0.01, ∗∗∗p < 0.001 versus control; Student's t test).
Figure 2
Figure 2
GDF5-Induced Changes in the Proteome in SH-SY5Y Cells and Gene Co-expression Analysis of Data from the Human SN Identifies Correlated Patterns of STRAP and NME1 Expression (A) Schema showing the experimental workflow using to identify changes in the proteome induced by GDF5 in SH-SY5Y cells. (B) Volcano plots of the -log10p values and the log2Fold change of proteins that were altered in SH-SY5Y cells following treatment with 100 ng/mL GDF5 for 240 min. (C–E) (C) Table showing the co-expression scores for genes associated with STRAP in STRING with a medium confidence threshold, which identified NME1 (highlighted in red), which was also found in the proteomic analyses. Graphs showing the LFQ intensities from the proteomics screen at 240 min for (D) STRAP and (E) NME1. Data are mean ± SEM from three independent samples per group (n = 3) (∗p < 0.05, ∗∗∗p < 0.001 versus control; Student's t test). (F) Linear regression showing the correlation between STRAP and NME1 in the human SN (n = 101). The r and Bonferroni-corrected p values are shown on the graph. All transcriptome data are 2log expression values. Raw data was obtained from the Gene expression Omnibus GSE60863 and analyzed using the R2: Genomics analysis and visualization platform (https://hgserver1.amc.nl/cgi-bin/r2/main.cgi). (G) Graph showing NME1 expression in the SN of adult rats that had received AAV-Control (“Cont”) or AAV-GDF5 (“GDF5”), as a percentage of that on the contralateral side. Data are mean ± SEM from n = 4 rats (∗p < 0.05 versus control; unpaired Student's t test). (H) Representative photomicrograph of NME1 (green) and TH (red) expression in the SN of AAV-Cont and AAV-GDF5 animals. Scale bar, 50 μm.
Figure 3
Figure 3
Strap and Nme1 Are Expressed in the Developing and Adult Rodent Midbrain (A–G) RT-qPCR showing the expression of transcripts for (A) Strap and (B) Nme1 in mouse midbrain from embryonic day (E) 10 to postnatal day (P) 90 (adult) relative to the levels of the geometric mean of three reference mRNAs, Gapdh, Sdha, and Hprt1. Data are mean ± SEM from n = 4 mice at each time point. (∗p < 0.05, ∗∗p < 0.01, ∗∗∗p < 0.01 as indicated; one-way ANOVA with post-hoc Fisher's least significant difference (LSD) test, comparing each time point to the one immediately before and after it). Images of sagittal sections of the P56 mouse brain showing the expression of transcripts for (C) Strap and (D) Nme1 compared with that of (E) Girk2. Images of coronal sections of the P56 mouse brain showing the expression of (F) Nme1 in the (G) Aldh1a1 domain. The dashed lines indicate the SNpc. Image credit: Allen Institute. (H) Representative confocal images of the adult rat SN immunofluorescently stained for NME1 (green) and TH (red). Scale bar, 20 μm.
Figure 4
Figure 4
Gene Co-expression Analysis of Human SN Identifies STRAP and NME1 Co-expression with Multiple Markers of Midbrain Dopaminergic Neurons (A and B) Linear regression showing the correlation between (A) STRAP and (B) NME1 and three markers of midbrain dopaminergic neurons (TH, GIRK2, ALDH1A1) in the human SN (n = 101). The r and Bonferroni-corrected p values are shown on each graph. Raw data were derived from dataset GSE60863 from the Gene Expression Omnibus and analyzed using the R2 microarray platform. (C) Table showing the number of genes in the human SN displaying a multiple testing-adjusted correlation of ≥0.7 with STRAP (n = 948) and NME1 (n = 1,586), along with a GO enrichment analysis of these gene lists. The top two GO categories based on fold-enrichment in each gene list are shown, along with the fold-enrichment and false discovery rate (FDR)-adjusted p value.
Figure 5
Figure 5
STRAP and NME1 Are Necessary for Basal and GDF-5-Induced Neurite Growth in SH-SY5Y Cells (A) Graph and representative photomicrographs showing NME1 expression in SH-SY5Y cells transfected with scrambled siRNA (siSCR) or NME1 siRNA (siNME1). (B–D) (B and C) Graphs of neurite length as percentage of control, and (D) representative photomicrographs of SH-SY5Y cells transfected with siSCR or (B and D) siRNA targeting STRAP (siSTRAP) or (C and D) siNME1 and cultured with or without 100 ng/mL GDF5 for 72 h. Data are mean ± SEM from three independent experiments (n = 3) (∗∗p < 0.01, ∗∗∗p < 0.001 versus siSCR control or as indicated; two-way ANOVA with post-hoc Fisher's LSD test or Student's t test as appropriate).
Figure 6
Figure 6
Overexpression of STRAP or NME1 Is Sufficient to Promote Neurite Growth in SH-SY5Y Cells (A) Graph and representative photomicrographs showing NME1 expression in SH-SY5Y cells transfected with control or NME1 expression plasmid. (B–D) (B and C) Graphs of neurite length as percentages of control and (D) representative photomicrographs of SH-SY5Y cells transfected with plasmids overexpressing NME1 or STRAP and cultured with or without 100 ng/mL GDF5 for (B) 36 h or (C) 72 h, as indicated. Data are mean ± SEM from three independent experiments (n = 3) (∗p < 0.05, ∗∗p < 0.01, ∗∗∗p < 0.001 versus siSCR control or as indicated. n.s. = not significant; two-way ANOVA with post-hoc Fisher's LSD test or Student's t test where appropriate).
Figure 7
Figure 7
Recombinant NME1 Increases Neurite Growth in SHSY5Y Cells and in Cultured E14 rat mDA Neurons (A and B) Graphs showing neurite lengths of (A) SHSY5Y cells after treatment for 48 h with 0, 10, 50, 100, or 200 ng/mL recombinant human NME1 and (B) E14 mDA neurons after treatment for 48 h with 100 ng/mL recombinant human NME1. (C) Representative photomicrographs of cultured E14 mDA neurons after treatment for 48 h with 0 or 100 ng/mL recombinant NME1, immunocytochemically stained for TH (green). Data are mean ± SEM from three independent experiments (n = 3) (∗p < 0.05, ∗∗p < 0.01 versus control; one-way ANOVA with post-hoc Fisher's LSD test or Student's t test where appropriate).
Figure 8
Figure 8
Alterations in the Expression of STRAP and NME1 in the PD SN (A) Schema showing the experimental approach. Raw data were derived from dataset GSE49036, and the R2 microarray platform was used to analyze the expression and co-expression of STRAP and NME1 in PD. (B–D) Boxplots showing the log2 expression of (B) ALDH1A1, (C) STRAP, and (D) NME1 in control (Cont) and PD SN samples (∗p < 0.05, ∗∗p < 0.01 versus control; Student's t test). (E–H) Linear regression analysis showing correlations between (E and F) STRAP and ALDH1A1 and (G and H) NME1 and ALDH1A1 in (E and G) control and (F and H) PD samples. The r and Bonferroni-corrected p values are shown on the graph.

References

    1. Burke R.E., O'Malley K. Axon degeneration in Parkinson's disease. Exp. Neurol. 2013;246:72–83. - PMC - PubMed
    1. Caminiti S.P., Presotto L., Baroncini D., Garibotto V., Moresco R.M., Gianolli L., Volonté M.A., Antonini A., Perani D. Axonal damage and loss of connectivity in nigrostriatal and mesolimbic dopamine pathways in early Parkinson's disease. Neuroimage. Clin. 2017;14:734–740. - PMC - PubMed
    1. Carotenuto P., Marino N., Bello A.M., D'Angelo A., Di Porzio U., Lombardi D., Zollo M. PRUNE and NM23-M1 expression in embryonic and adult mouse brain. J. Bioenerg. Biomembr. 2006;38:233–246. - PubMed
    1. Cieślak M., Wojtczak A. Role of purinergic receptors in the Alzheimer’s disease. Purinergic Signal. 2018;14:331–344. - PMC - PubMed
    1. Costello D.J., O'Keeffe G.W., Hurley F.M., Sullivan A.M. Transplantation of novel human GDF5-expressing CHO cells is neuroprotective in models of Parkinson's disease. J. Cell Mol. Med. 2012;16:2451–2460. - PMC - PubMed