. 2020 Dec;13(12):100850.
doi: 10.1016/j.tranon.2020.100850. Epub 2020 Aug 24.

Onodera's prognostic nutritional index correlates with tumor immune environment and survival in patients with oral squamous cell carcinoma undergoing chemoradiotherapy

Affiliations

Onodera's prognostic nutritional index correlates with tumor immune environment and survival in patients with oral squamous cell carcinoma undergoing chemoradiotherapy

Ryoji Yoshida et al. Transl Oncol. 2020 Dec.

Abstract

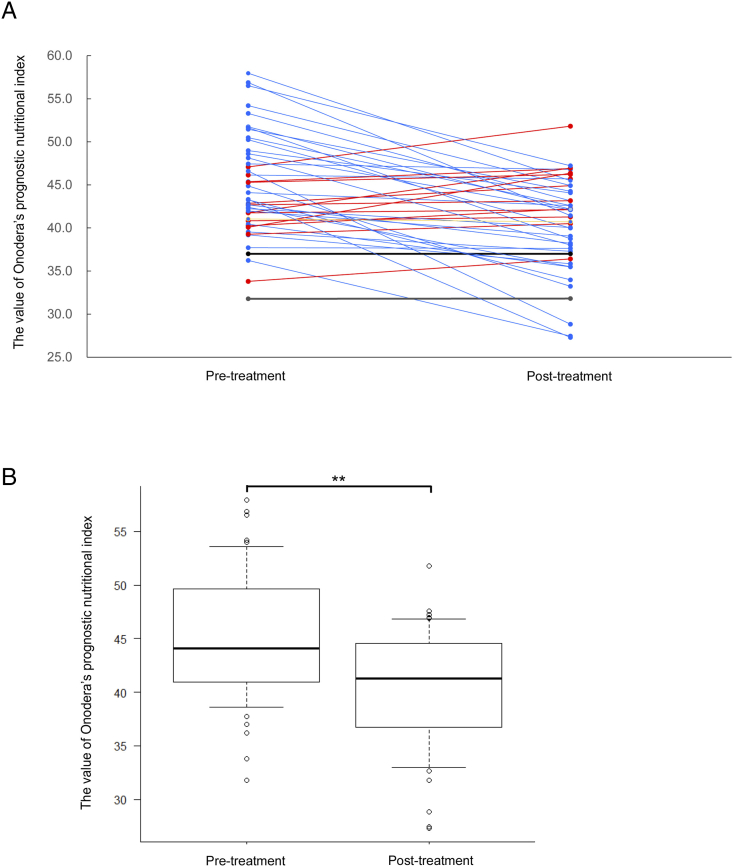
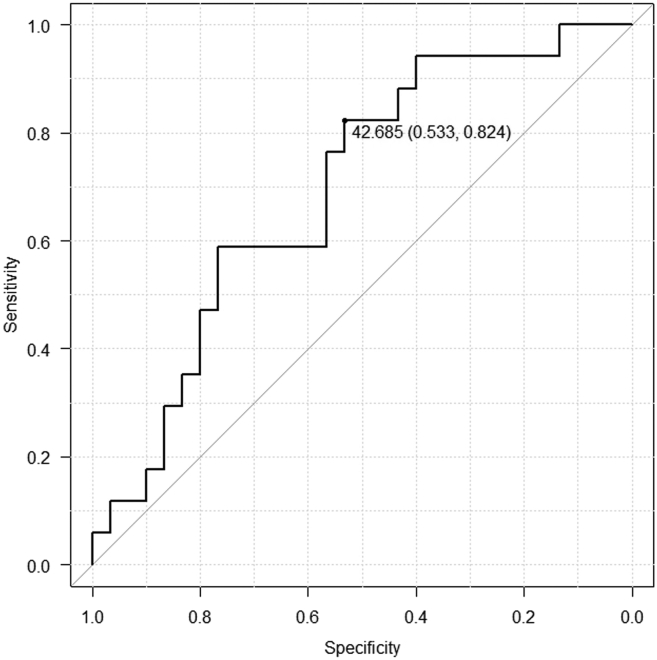
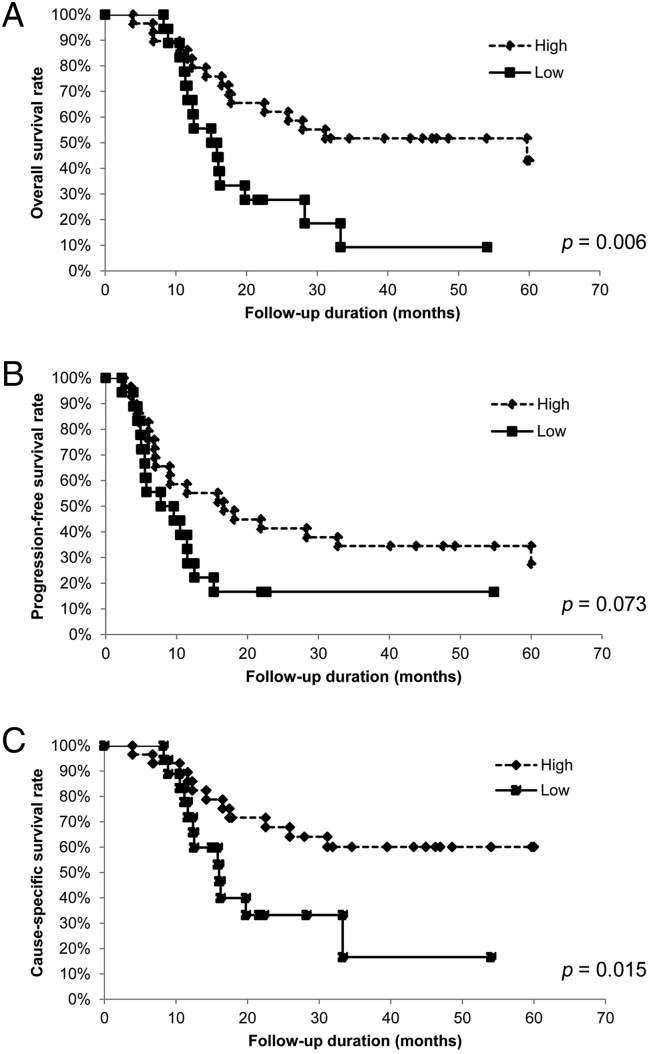
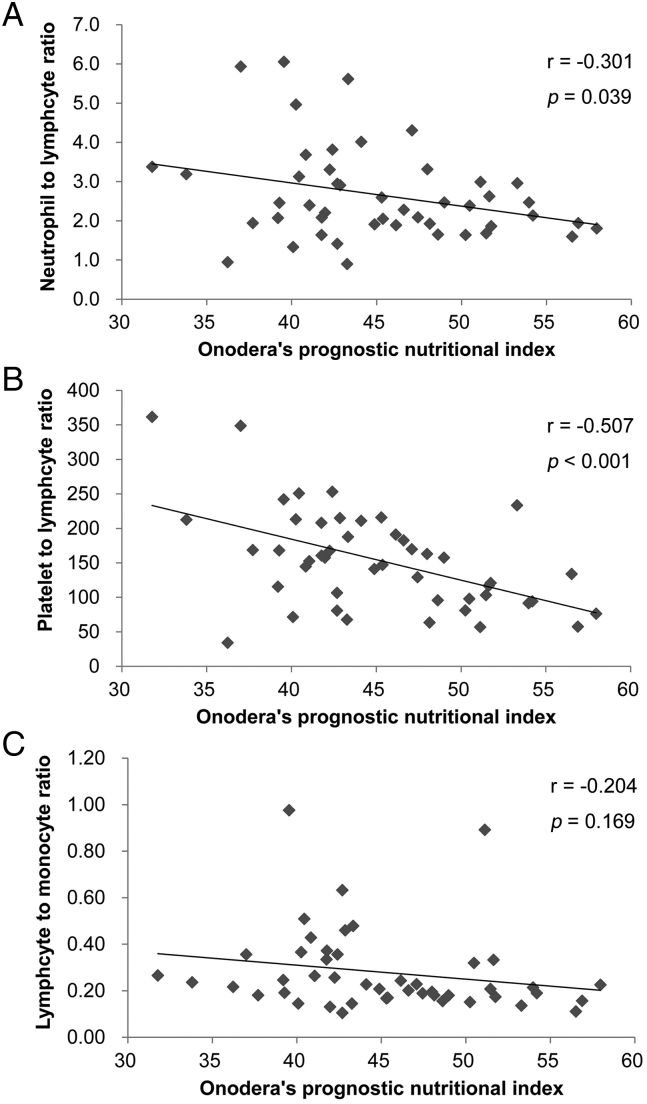
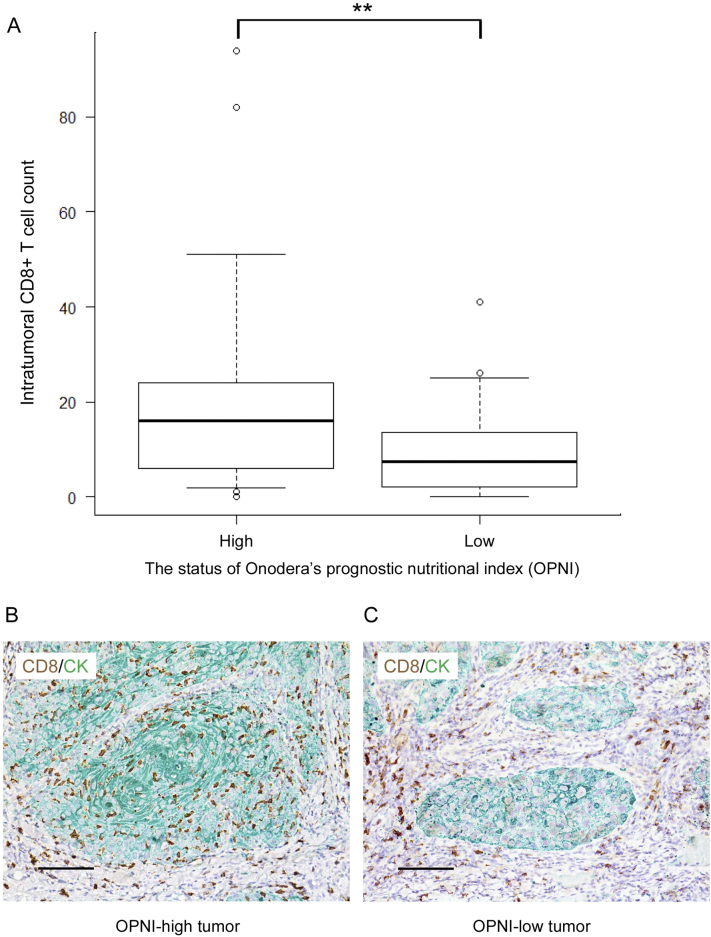
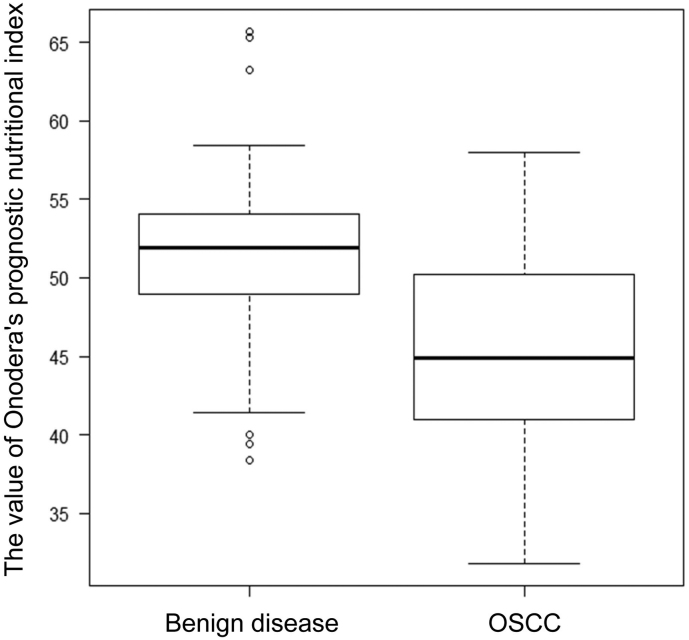
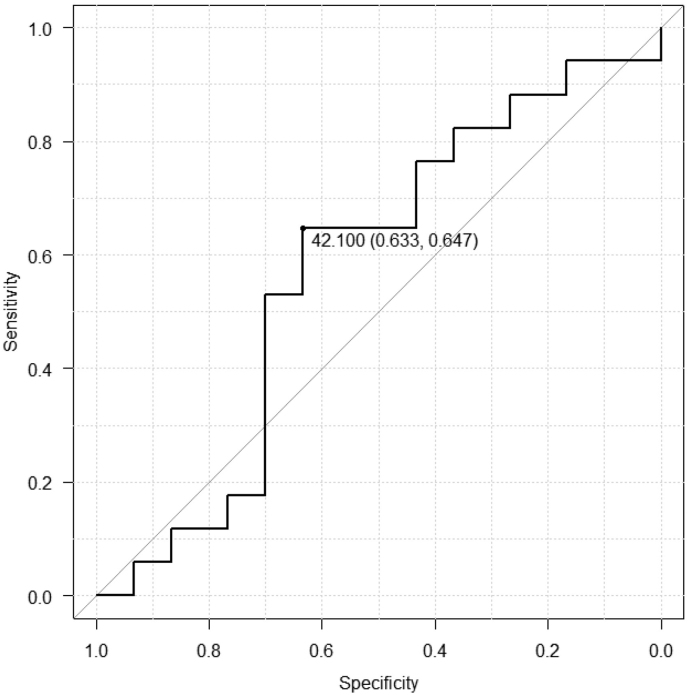
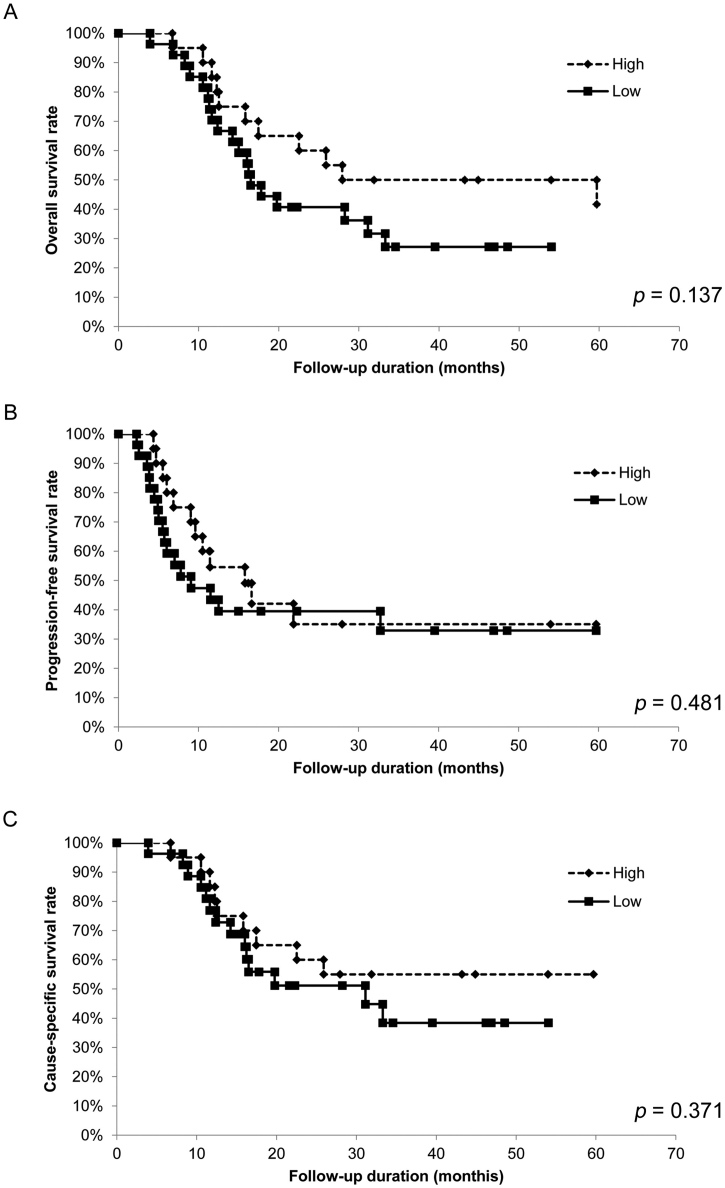
Pretreatment nutritional and immunological status is useful for predicting survival outcomes for various types of malignant tumors. Our objective was to determine the impact of the pretreatment Onodera's prognostic nutritional index (OPNI) on outcomes of patients who underwent definitive chemoradiotherapy for advanced oral squamous cell carcinoma (OSCC). We reviewed 47 patients treated for OSCC with definitive chemoradiotherapy (CRT) at our institution between January 2004 and December 2011. We determined the OPNI according to the following formula: 10 × serum albumin (g/dL) + 0.005 × total lymphocyte count (per μL). We determined the optimum OPNI cut-off through a receiver operating characteristic analysis. We analyzed the associations between OPNI status and various clinicopathological features and evaluated the effects of OPNI on the prognosis. We examined the relationships between OPNI and systemic inflammatory response parameters and analyzed intratumoral CD8+ T cells and their correlation with OPNI. The optimum OPNI cut-off was 42.7. A Kaplan-Meier curve analysis revealed that low OPNI was significantly associated with poor overall survival and cause-specific survival. The multivariate analysis revealed that low OPNI was independently correlated with poor 5 year overall survival and cause-specific survival. OPNI was significantly correlated with systemic inflammatory response parameters. Intratumoral CD8+ T cell counts in primary tumors were significantly lower for low OPNI than for high OPNI. The present data demonstrate that pretreatment OPNI is a valuable independent prognostic indicator of overall and cause-specific survival in advanced OSCC following definitive CRT. OPNI might reflect the tumor immune microenvironment characterization in OSCC.

Keywords: Chemoradiotherapy; Onodera's prognostic nutritional index; Oral squamous cell carcinoma; Tumor immune environment; prognosis.


Conflict of interest statement

Declaration of competing interest The authors declare that they have no known competing financial interests or personal relationships that could have appeared to influence the work reported in this paper.

Figures

Fig. 1
Fig. 1
OPNI changes at pretreatment and post-treatment. (A) OPNI changes at pretreatment and post-treatment in each case. The red line indicates “increased” OPNI at post-treatment. The blue line indicates “decreased” OPNI at post-treatment. The black line indicates “no change” at post-treatment. (B) Box plot showing the OPNI at pretreatment and post-treatment. Differences in mean values between the groups were statistically analyzed using Mann–Whitney's U test. **, p < .01.
Fig. 2
Fig. 2
Receiver operating characteristic (ROC) curve analysis for the Onodera's prognostic nutritional index (OPNI). In the ROC analysis, an OPNI cut-off was determined to predict overall patient survival.
Fig. 3
Fig. 3
Relationship between OPNI and survival for patients with oral squamous cell carcinoma. In the Kaplan–Meier survival analysis of patients with oral squamous cell carcinoma (OSCC), the patients were divided into two groups based on OPNI (low and high). (A) Overall survival (OS) of the 47 patients with OSCC based on OPNI. *, p < .05. (B) Progression-free survival (PFS) of the 47 patients with OSCC based on OPNI. *, p < .05. (B) Cause-specific survival (CSS) of the 47 patients with OSCC based on OPNI. *, p < .05.
Fig. 4
Fig. 4
Relationship between OPNI and systemic inflammatory response parameters in the 47 patients with OSCC. Scatter plots of the OPNI and systemic inflammatory response indicators. (A) Relationship between OPNI and neutrophil–lymphocyte ratio (NLR). The x-axis indicates the OPNI, and the y-axis shows the NLR. The correlation was investigated using Pearson's correlation coefficient test. *, p < .05. (B) Relationship between the OPNI and platelet–lymphocyte ratio (PLR). The x-axis indicates the OPNI, and the y-axis shows the PLR. The correlation was investigated using Pearson's correlation coefficient test. *, p < .05. (C) Relationship between the OPNI and lymphocyte–monocyte ratio (LMR). The x-axis indicates the OPNI, and the y-axis shows the LMR. The correlation was investigated using Pearson's correlation coefficient test. *, p < .05.
Fig. 5
Fig. 5
Relationship between the OPNI and intratumoral CD8+ cell counts in the 47 patients with OSCC. (A) Box plot showing the number of intratumoral CD8+ cells according to OPNI status. The differences in mean values between the two groups were statistically analyzed using the Mann–Whitney's U test. **, p < .01. (B) Representative photographs of the results of double-immunohistochemical staining of CD8 (brown) and cytokeratin (green) in OPNI-high tumor. Original magnification: ×400, scale bar = 50 μm. (C) Representative photographs of the results of double-immunohistochemical staining of CD8 (brown) and cytokeratin (green) in OPNI-low tumor. Original magnification: ×400, scale bar = 50 μm.
Supplementary Fig. S1
Box plot of OPNI according to disease. Box plot showing the value of OPNI according to disease. Benign disease (n = 50): Median = 51.6, Standard deviation = 5.51. OSCC (n = 47): Median = 45.3, Standard deviation = 6.15. The differences in mean values between the two groups were statistically analyzed using the Mann-Whitney U test. **, p < .01
Supplementary Fig. S2
Receiver operating characteristic (ROC) curve analysis for the post-treatment Onodera's prognostic nutritional index (OPNI). In the ROC analysis, an OPNI cut-off was determined to predict overall patient survival.
Supplementary Fig. S3
Relationship between post-treatment OPNI and survival for patients with oral squamous cell carcinoma. In the Kaplan–Meier survival analysis of patients with oral squamous cell carcinoma (OSCC), the patients were divided into two groups based on post-treatment OPNI (low and high). (A) Overall survival (OS) of the 47 patients with OSCC based on OPNI. (B) Progression-free survival (PFS) of the 47 patients with OSCC based on OPNI. (B) Cause-specific survival (CSS) of the 47 patients with OSCC based on OPNI.

References

    1. Siegel R.L., Miller K.D., Jemal A. Cancer statistics, 2017. CA Cancer J. Clin. 2017;67(1):7–30. - PubMed
    1. Gore S.M., Crombie A.K., Batstone M.D., Clark J.R. Concurrent chemoradiotherapy compared with surgery and adjuvant radiotherapy for oral cavity squamous cell carcinoma. Head & neck. 2015;37(4):518–523. - PubMed
    1. Murakami R., Semba A., Kawahara K., Matsuyama K., Hiraki A., Nagata M. Concurrent chemoradiotherapy with S-1 in patients with stage III-IV oral squamous cell carcinoma: A retrospective analysis of nodal classification based on the neck node level. Molecular and clinical oncology. 2017;7(1):140–144. - PMC - PubMed
    1. Onodera T., Goseki N., Kosaki G. Prognostic nutritional index in gastrointestinal surgery of malnourished cancer patients. Nihon Geka Gakkai Zasshi. 1984;85(9):1001–1005. - PubMed
    1. Migita K., Takayama T., Saeki K., Matsumoto S., Wakatsuki K., Enomoto K. The prognostic nutritional index predicts long-term outcomes of gastric cancer patients independent of tumor stage. Ann. Surg. Oncol. 2013;20(8):2647–2654. - PubMed