. 2020 Dec:60:169-176.
doi: 10.1016/j.jcrc.2020.08.006. Epub 2020 Aug 13.

Quantitative-analysis of computed tomography in COVID-19 and non COVID-19 ARDS patients: A case-control study

Affiliations

Quantitative-analysis of computed tomography in COVID-19 and non COVID-19 ARDS patients: A case-control study

Louis Chauvelot et al. J Crit Care. 2020 Dec.

Abstract

Purpose: The aim of this study was to assess whether the computed tomography (CT) features of COVID-19 (COVID+) ARDS differ from those of non-COVID-19 (COVID-) ARDS patients.

Materials and methods: The study is a single-center prospective observational study performed on adults with ARDS onset ≤72 h and a PaO2/FiO2 ≤ 200 mmHg. CT scans were acquired at PEEP set using a PEEP-FiO2 table with VT adjusted to 6 ml/kg predicted body weight.

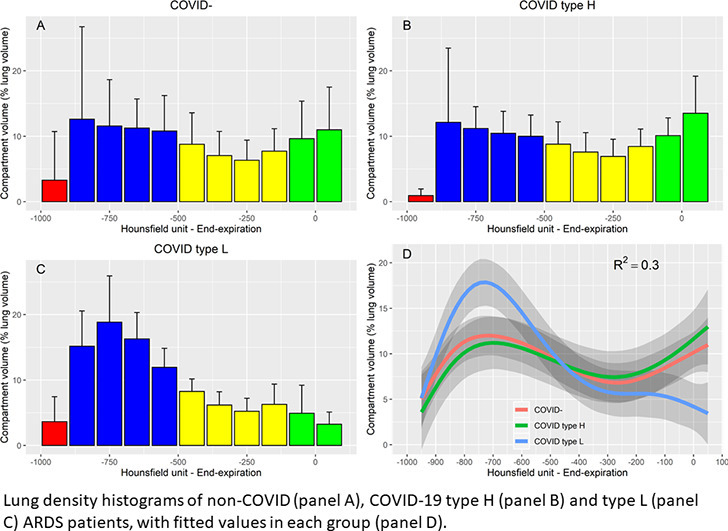
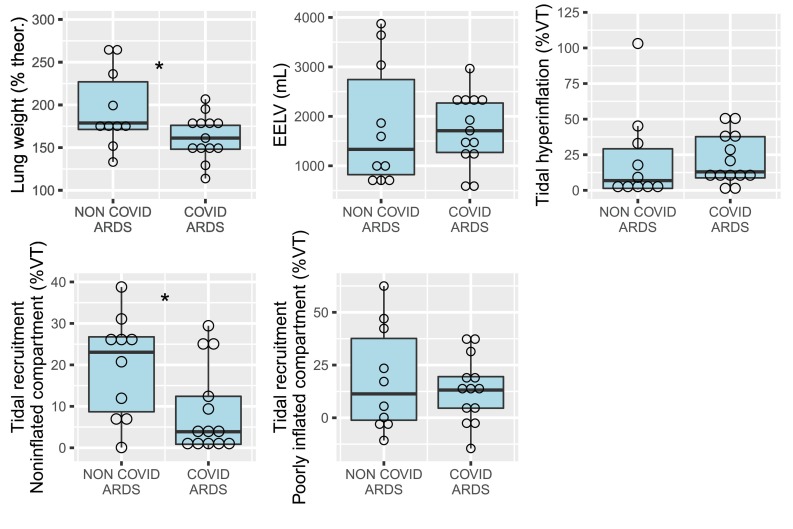
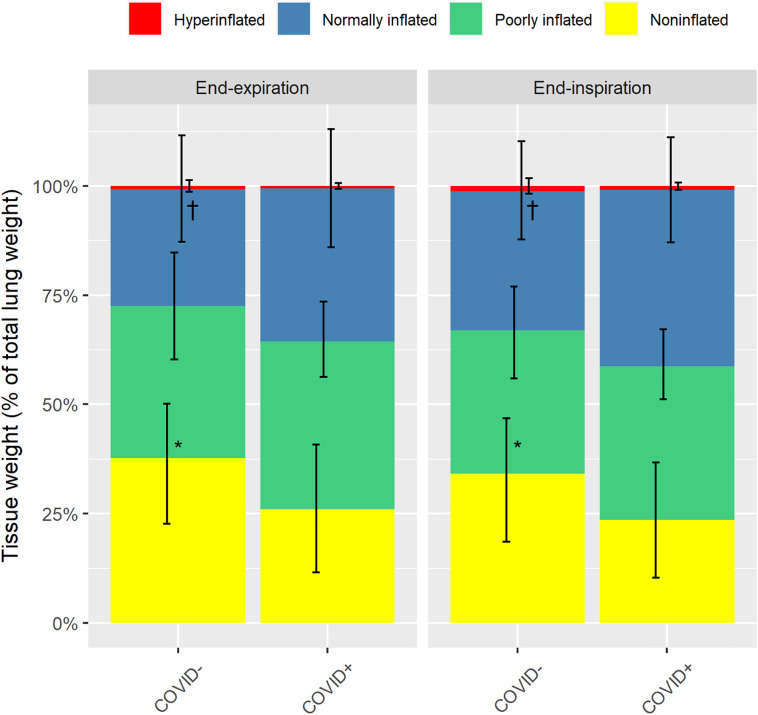
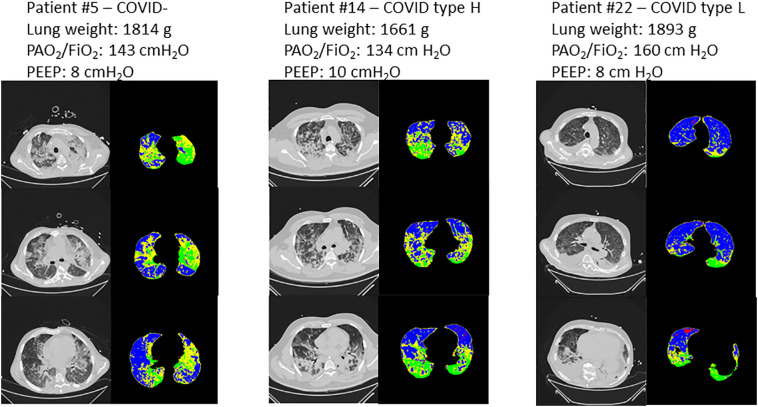
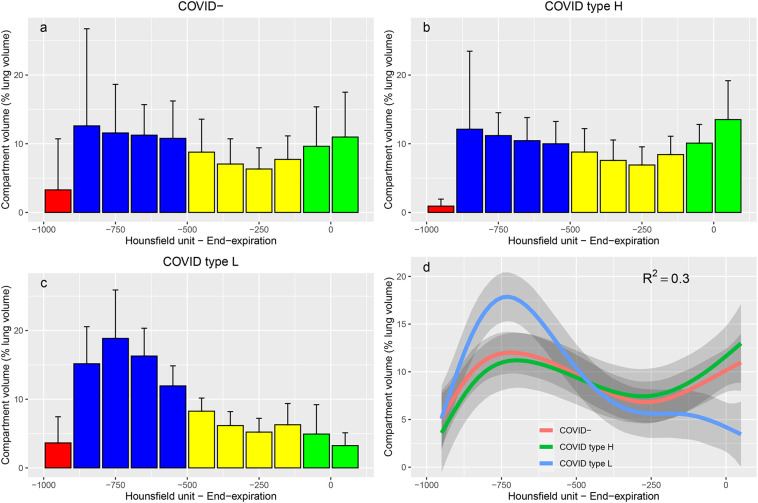
Results: 22 patients were included, of whom 13 presented with COVID-19 ARDS. Lung weight was significantly higher in COVID- patients, but all COVID+ patients presented supranormal lung weight values. Noninflated lung tissue was significantly higher in COVID- patients (36 ± 14% vs. 26 ± 15% of total lung weight at end-expiration, p < 0.01). Tidal recruitment was significantly higher in COVID- patients (20 ± 12 vs. 9 ± 11% of VT, p < 0.05). Lung density histograms of 5 COVID+ patients with high elastance (type H) were similar to those of COVID- patients, while those of the 8 COVID+ patients with normal elastance (type L) displayed higher aerated lung fraction.

Keywords: Acute respiratory distress syndrome; COVID-19; Computed tomography; Driving pressure; Tidal hyperinflation; Transpulmonary pressure.


Conflict of interest statement

Declaration of Competing Interest The authors declare that they have no conflict of interest.

Figures

Unlabelled Image
Graphical abstract
Fig. 1
Fig. 1
CT measurements in non-COVID-19 and COVID-19 ARDS patients. ARDS = acute respiratory distress syndrome; CT = computed tomography; EELV = end-expiratory aerated lung volume; theor = theoretical lung weight; VT = CT-derived tidal volume. Open circles are individual datapoints. *p < 0.05 between groups.
Fig. 2
Fig. 2
Proportion of total lung tissue classified according to the level of inflation. Values are provided at both end-expiration and end-inspiration in COVID-19 ARDS patients (COVID+) and non-COVID-19 ARDS patients (COVID−). Yellow, green, blue and red bars refer to noninflated, poorly inflated, normally inflated, and overinflated lung tissue, respectively. Error bars are standard deviations. *p < 0.01 for noninflated tissue between COVID+ and COVID− patients. †p < 0.05 for normally inflated tissue between COVID+ and COVID− patients. (For interpretation of the references to colour in this figure legend, the reader is referred to the web version of this article.)
Fig. 3
Fig. 3
Representative CT scans of 3 patients. Left panel: patient with non-COVID-19 ARDS; middle panel: type-H COVID-19 ARDS patient; right panel: type-L COVID-19 ARDS patient. For each patient, 3 CT slices are presented at the level of the aortic arch (top panel), the main bronchi division (middle panel) and immediately above the right diaphragmatic dome (bottom panel). At each level, a grey colour scale is presented as well as the corresponding parametric CT with red representing overinflated voxels, blue normally inflated voxels, yellow poorly aerated voxels, and green nonaerated voxels. Lung weight assessed on CT, PaO2/FiO2 ratio and PEEP level are provided for each patient on top of their corresponding CT images. (For interpretation of the references to colour in this figure legend, the reader is referred to the web version of this article.)
Fig. 4
Fig. 4
Lung density histograms. Value are provided for COVID− (n = 10 patients, panel a), type H (n = 5 patients, panel b) and type L (n = 8 patients, panel c) ARDS patients. Histograms represents the volume of all the voxels belonging to each interval of 100 Hounsfield units width, normalized by total lung volume. Bars are mean values and error bars are standard deviations. Red bars represent intervals within the over inflation range, blue bars intervals within the normal inflation range, yellow intervals within the poor inflation range, and green intervals within the non-aeration range. Panel d represent the fitted values in each group, with R2 of the general additive mixed model (red, green and blue lines refer to COVID−, Type H and type L groups, respectively). Grey shade areas represent 95% confidence interval of the fitted values. (For interpretation of the references to colour in this figure legend, the reader is referred to the web version of this article.)

Similar articles

Cited by

References

    1. Richardson S., Hirsch J.S., Narasimhan M., Crawford J.M., McGinn T., Davidson K.W. Presenting characteristics, comorbidities, and outcomes among 5700 patients hospitalized with COVID-19 in the New York city area. JAMA. 2020 doi: 10.1001/jama.2020.6775. - DOI - PMC - PubMed
    1. Wu C., Chen X., Cai Y., Xia J., Zhou X., Xu S. Risk factors associated with acute respiratory distress syndrome and death in patients with coronavirus disease 2019 pneumonia in Wuhan, China. JAMA Intern Med. 2020 doi: 10.1001/jamainternmed.2020.0994. - DOI - PMC - PubMed
    1. Grasselli G., Zangrillo A., Zanella A., Antonelli M., Cabrini L., Castelli A. Baseline characteristics and outcomes of 1591 patients infected with SARS-CoV-2 admitted to ICUs of the Lombardy Region, Italy. JAMA. 2020;323:1574–1581. doi: 10.1001/jama.2020.5394. - DOI - PMC - PubMed
    1. Bhatraju P.K., Ghassemieh B.J., Nichols M., Kim R., Jerome K.R., Nalla A.K. Covid-19 in critically ill patients in the Seattle region - case series. N Engl J Med. 2020;382:2012–2022. doi: 10.1056/NEJMoa2004500. - DOI - PMC - PubMed
    1. Arentz M., Yim E., Klaff L., Lokhandwala S., Riedo F.X., Chong M. Characteristics and outcomes of 21 critically ill patients with COVID-19 in Washington state. JAMA. 2020;323:1612–1614. doi: 10.1001/jama.2020.4326. - DOI - PMC - PubMed