. 2020 Oct;586(7830):560-566.
doi: 10.1038/s41586-020-2708-8. Epub 2020 Aug 27.

A mouse-adapted model of SARS-CoV-2 to test COVID-19 countermeasures

Affiliations

A mouse-adapted model of SARS-CoV-2 to test COVID-19 countermeasures

Kenneth H Dinnon 3rd et al. Nature. 2020 Oct.

Erratum in

Abstract

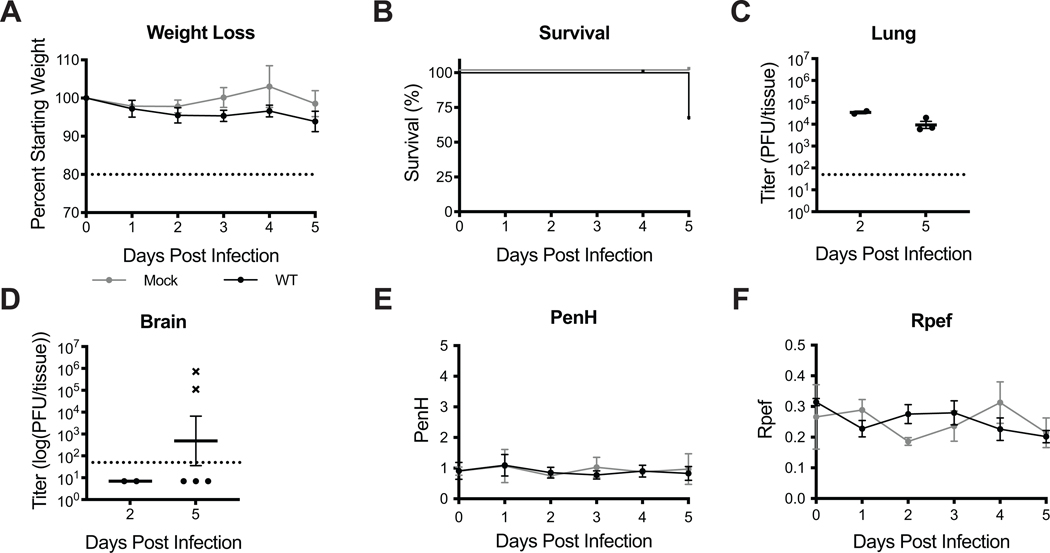
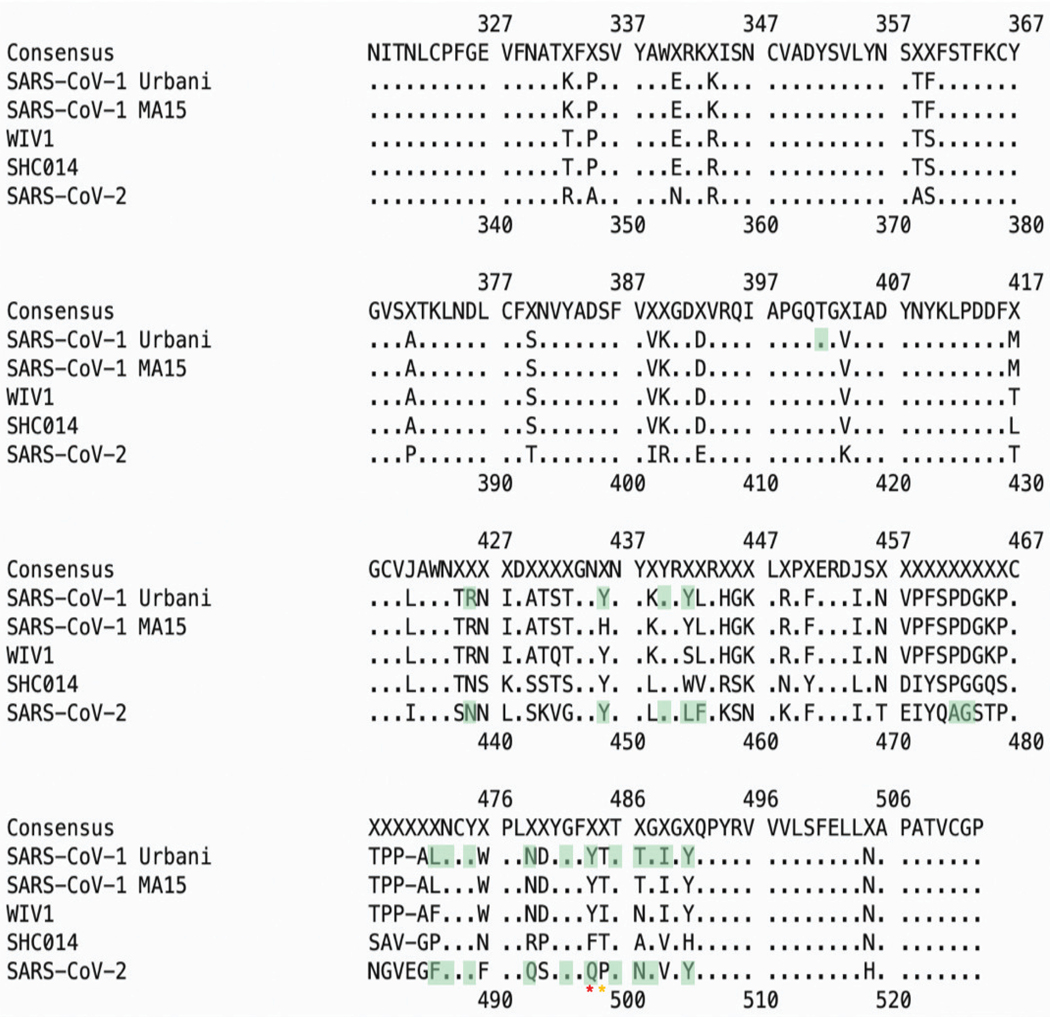
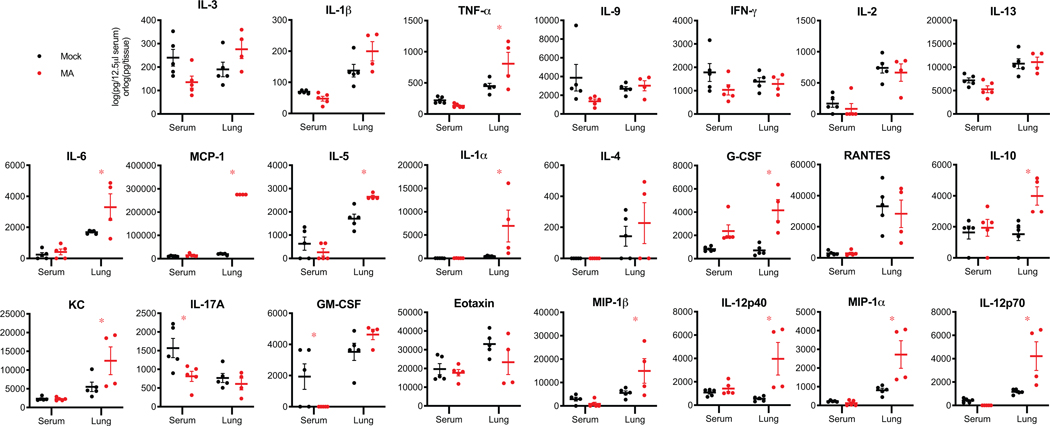
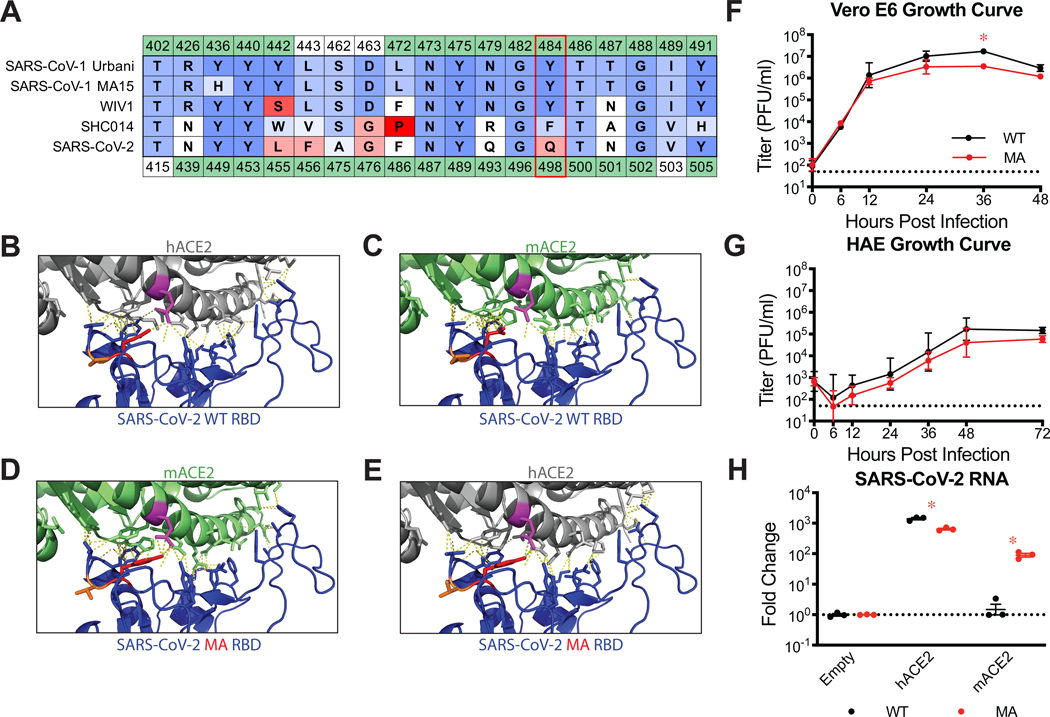
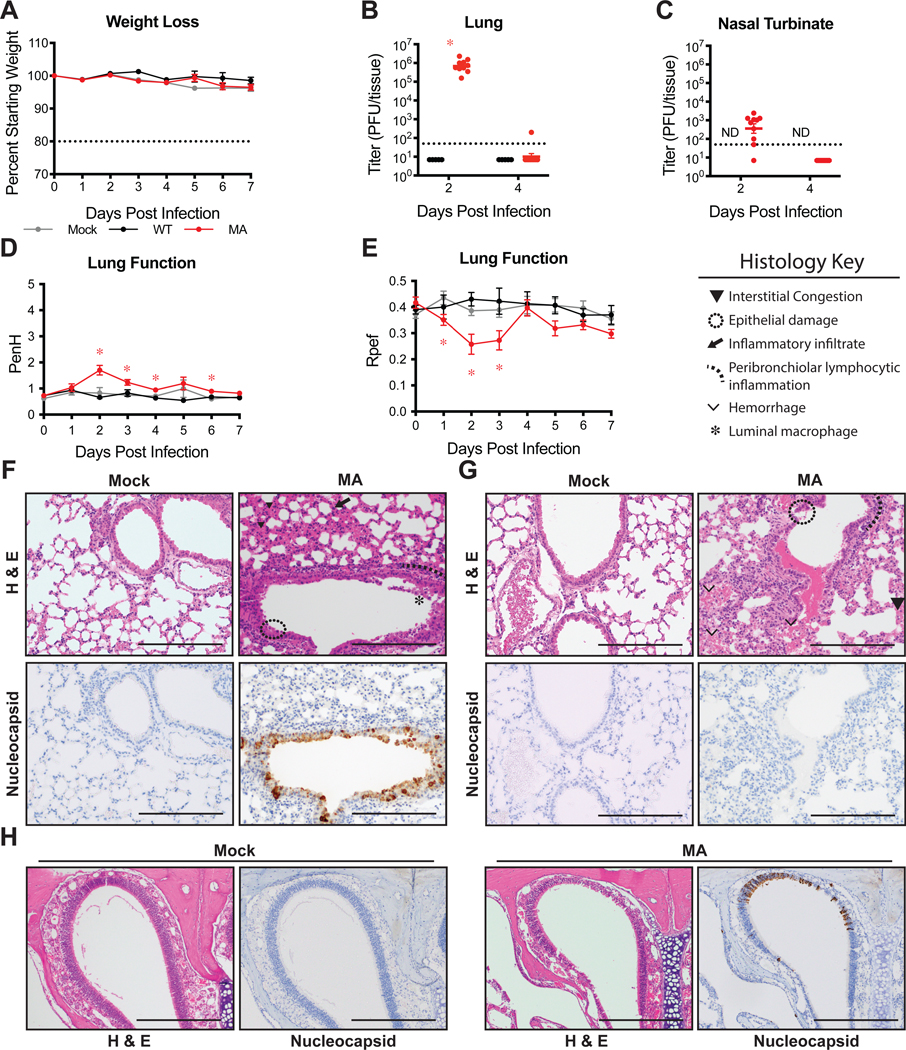
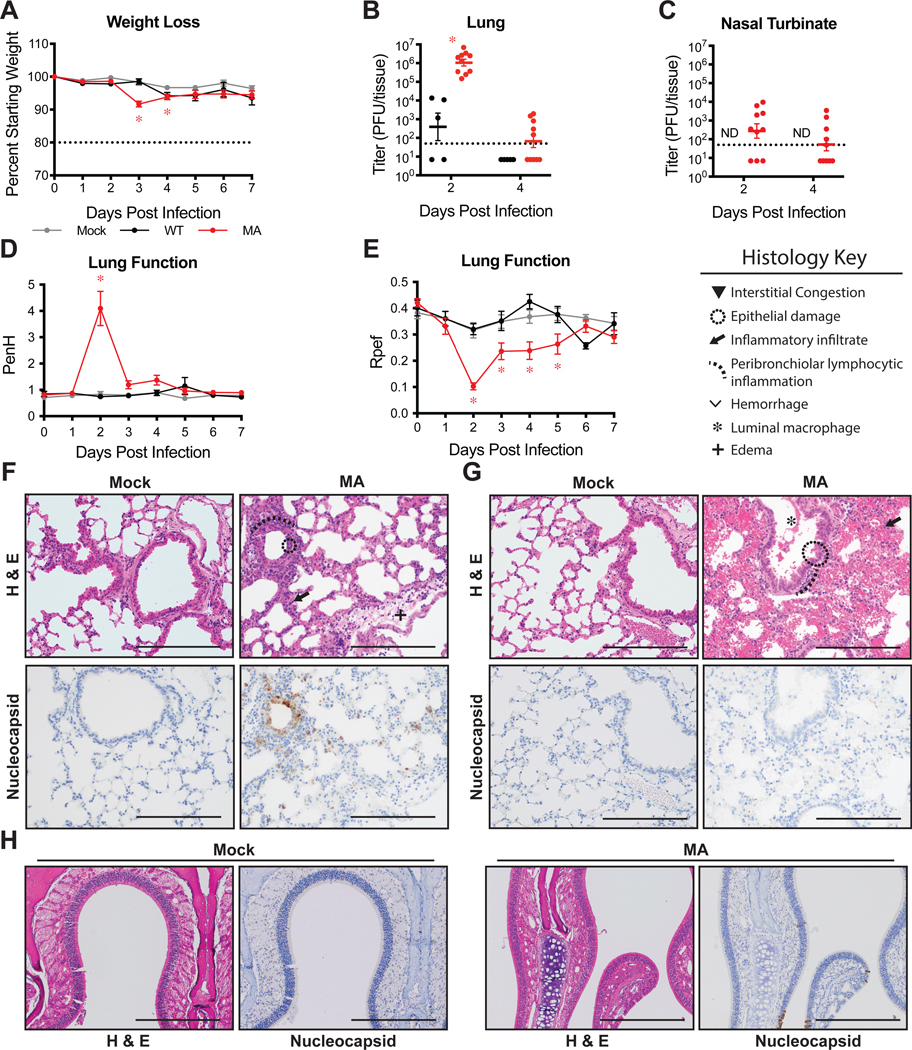
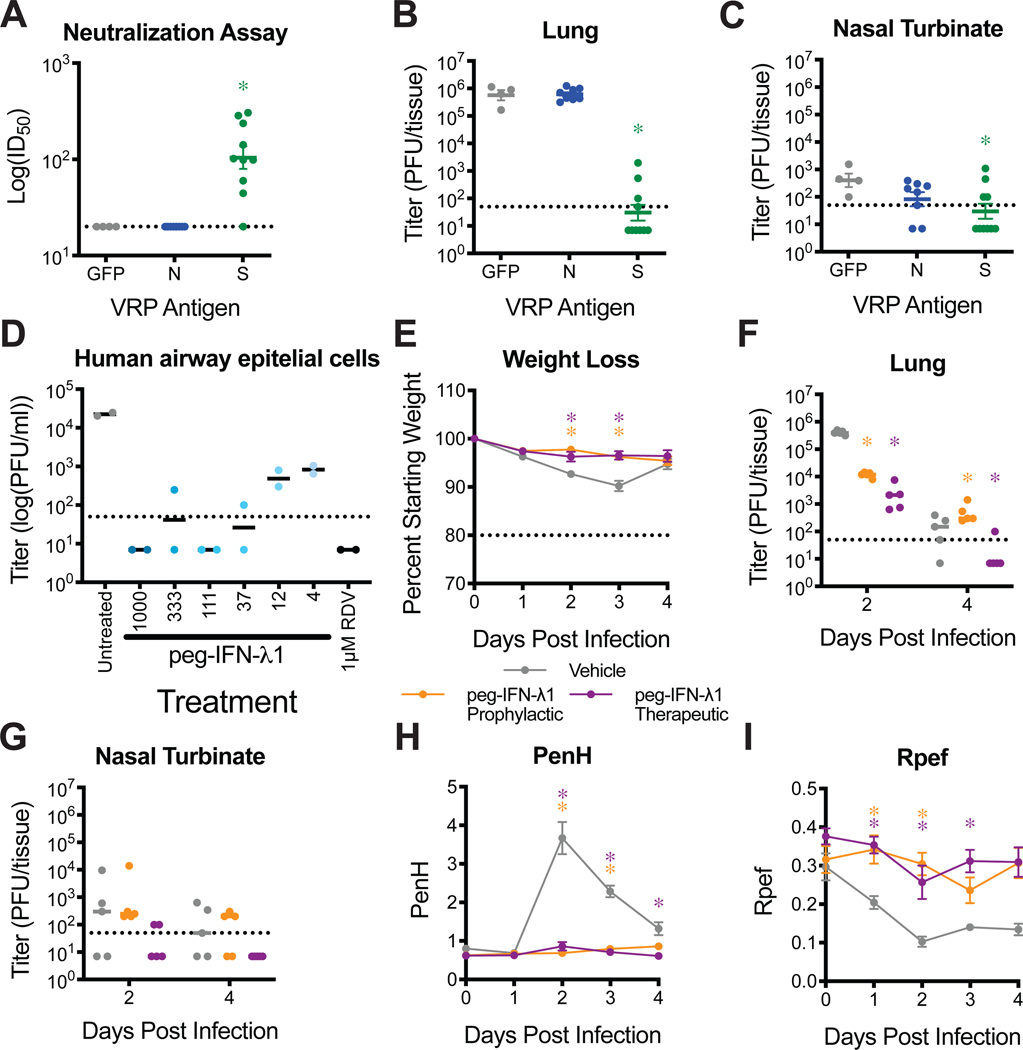
Coronaviruses are prone to transmission to new host species, as recently demonstrated by the spread to humans of severe acute respiratory syndrome coronavirus 2 (SARS-CoV-2), the causative agent of the coronavirus disease 2019 (COVID-19) pandemic1. Small animal models that recapitulate SARS-CoV-2 disease are needed urgently for rapid evaluation of medical countermeasures2,3. SARS-CoV-2 cannot infect wild-type laboratory mice owing to inefficient interactions between the viral spike protein and the mouse orthologue of the human receptor, angiotensin-converting enzyme 2 (ACE2)4. Here we used reverse genetics5 to remodel the interaction between SARS-CoV-2 spike protein and mouse ACE2 and designed mouse-adapted SARS-CoV-2 (SARS-CoV-2 MA), a recombinant virus that can use mouse ACE2 for entry into cells. SARS-CoV-2 MA was able to replicate in the upper and lower airways of both young adult and aged BALB/c mice. SARS-CoV-2 MA caused more severe disease in aged mice, and exhibited more clinically relevant phenotypes than those seen in Hfh4-ACE2 transgenic mice, which express human ACE2 under the control of the Hfh4 (also known as Foxj1) promoter. We demonstrate the utility of this model using vaccine-challenge studies in immune-competent mice with native expression of mouse ACE2. Finally, we show that the clinical candidate interferon-λ1a (IFN-λ1a) potently inhibits SARS-CoV-2 replication in primary human airway epithelial cells in vitro-both prophylactic and therapeutic administration of IFN-λ1a diminished SARS-CoV-2 replication in mice. In summary, the mouse-adapted SARS-CoV-2 MA model demonstrates age-related disease pathogenesis and supports the clinical use of pegylated IFN-λ1a as a treatment for human COVID-196.


Figures

Extended Data 1:
Extended Data 1:. SARS-CoV-2 infection in HFH4-hACE2 transgenic mice.
Male and female HFH4-hACE2 mice were infected with 105 PFU SARS-CoV-2 WT. (A) Percent starting weight. Dotted line represents weight loss criteria for humane euthanasia. n=2 mock and 5 SARS-CoV-2. (B) Survival. (C–D) Lung (C) and brain (D) viral titer. Dotted line represents limit of detection (LOD). Undetected samples are plotted at half the LOD. ‘x’ symbol indicates mice that succumbed to infection. 2dpi: n=2; 5dpi: n=5. (E–F) Whole body plethysmography assessing pulmonary function for PenH (E) and Rpef (F).
Extended Data 2:
Extended Data 2:. Group 2B coronavirus spike receptor binding domain alignment.
Amino acid positions are numbered above in reference to SARS-CoV-1, and below in reference to SARS-CoV-2. Green highlighted residues are hACE2 contacts as determined by published crystal structures.
Extended Data 3:
Extended Data 3:. Cytokine analysis in SARS-CoV-2 MA infected 1-year-old BALB/c mice.
Cytokine and chemokine levels in serum and lung homogenates of 1-year-old female BALB/c mice from Figures 3 at 2 and 4dpi. For each analyte, data analyzed by 2-way ANOVA followed by Sidak’s multiple comparisons. ‘*’ denotes p=0.0155 (TNF-α), 0.0189 (IL-6), <0.0001 (MCP-1), 0.0115 (IL-5), 0.0127 (IL-1α), 0.0004 (G-CSF), 0.0070 (IL-10), 0.0243 (KC), 0.0152 (IL-17A), 0.0408 (GM-CSF), 0.0261 (MIP-1β), 0.0025 (IL-12p40), 0.0015 (MIP-1α), 0.0019 (IL-12p70).
Extended Data 4:
Extended Data 4:. Evaluation of peg-IFN-λ1 against SARS-CoV-2 MA infection in young BALB/c and HFH4-hACE2 mice.
(A–B) 12-week-old female BALB/c mice were subcutaneously treated with vehicle or with 2μg peg-IFN-λ1 prophylactically or therapeutically and infected with SARS-CoV-2 MA. Viral titers in the lung (A) and nasal turbinates (B) at 2dpi. n=10 for each group, combined from two independent experiments. Dotted line represents limit of detection (LOD). Undetected samples plotted at half the LOD. Log transformed data analyzed by 1-way ANOVA followed by Holm-Sidak’s multiple comparisons. (A) ‘*’ denotes p=<0.0001 (prophylactic), <0.0001 (therapeutic). (C–E) 4- to 7-week old HFH4-hACE2 male and female mice were treated with peg-IFN-λ1 as done in (A–B) and infected with 105 PFU SARS-CoV-2 WT. n=8 vehicle; n=10 prohpylactic, n=7 therapeutic. (C) Percent starting weight. Dotted line represents weight loss criteria for humane euthanasia. Data analyzed by mixed effects analysis followed by Sidak’s multiple comparisons. (D) Survival. (E) Lung viral titer at 2 and 5dpi. 2dpi: n=4 vehicle, n=4 prophylactic, n=4 therapeutic: 5dpi: n=3 vehicle, n=4 prophylactic, n=2. Data analyzed by 2-way ANOVA followed by Dunnett’s multiple comparisons. ‘*’ denotes p=0.0037 (prophylactic, 2dpi), 0.0365 (therapeutic, 2dpi). All error bars represent standard error about the mean.
Figure 1.
Figure 1.. Generation of mouse adapted SARS-CoV-2 MA.
(A) Amino acid (AA) table of group 2B spike receptor binding domain (RBD) hACE2 interaction residues. AA positions are numbered relative to SARS-CoV-1 (above) and SARS-CoV-2 (below). Green residues are contacts as determined by published crystal structures. AAs colored by BLOSUM62 conservation score relative to SARS-CoV-1 Urbani (red=least conserved; blue=most conserved). SARS-CoV-1 Urbani, SARS-CoV-1 MA15, WIV1, and SHC014 can utilize mACE2 as a functional receptor whereas SARS-CoV-2 cannot. Red box indicates Q498 in SARS-CoV-2 that is a hACE2 contact for both SARS-CoV-1 and SARS-CoV-2, and is uniquely divergent in SARS-CoV-2. (B) SARS-CoV-2 WT RBD and hACE2 interface (PDB: 6m0j). SARS-CoV-2 Q498 (red) interacts with Q42 (magenta) of hACE2. (C) Modelling of SARS-CoV-2 WT RBD and mACE2. SARS-CoV-2 Q498 no longer interacts with Q42 of mACE2. (D) Modelling of SARS-CoV-2 Q498Y and P499T (orange) substitutions restore interaction with Q42 of mACE2. (E) Modelling of SARS-CoV-2 Q498Y/P499T maintains interaction with Q42 of hACE2. (F–G) Single step growth curve of SARS-CoV-2 WT and SARS-CoV-2 MA in Vero E6 cells (F) and differentiated primary human bronchiolar epithelial cells (HAEs) (G). Dotted line represents limit of detection (LOD). Log transformed data analyzed by 2-way ANOVA followed by Sidak’s multiple comparisons. (F) ‘*’ denotes p=0.0053 (36 hours). (H) Non-permissive DBT-9 cells were transfected to express hACE2 or mACE2 and infected with SARS-CoV-2 WT and SARS-CoV-2 MA. Viral RNA was quantified by qRT-PCR at 24 hours post infection and scaled to empty vector transfected cells. Log transformed data analyzed by 2-way ANOVA followed by Dunnett’s multiple comparisons. ‘*’ denotes p=0.0322 (hACE2), <0.0001 (mACE2). (F-H) n=3 techical replicates for each group, representative of 2 independent experiments. Error bars represent standard deviation about the mean.
Figure 2:
Figure 2:. SARS-CoV-2 MA replicates in young BALB/c mice.
12-week-old female BALB/c mice were mock infected (gray), or infected with 105 PFU SARS-CoV-2 WT (black) or MA (red). Data combined from two independent experiments. (A) Percent starting weight. Dotted line represents weight loss criteria for humane euthanasia. Data analyzed by mixed effects analysis followed by Dunnett’s multiple comparisons. (B–C) Viral lung (B) and nasal turbinate (C) titer. 2dpi: n=5 WT, n=10 MA; 4dpi: n=5 WT, n=9 MA. Dotted line represents limit of detection (LOD). Undetected samples are plotted at half the LOD. Log transformed data analyzed by 2-way ANOVA followed by Sidak’s multiple comparisons. ‘ND’=not determined. (B) ‘*’ denotes p=<0.0001. (D–E) Whole body plethysmography assessing pulmonary function for PenH (D) and Rpef (E). Data analyzed by 2-way ANOVA followed by Dunnett’s multiple comparisons. Error bars represent standard error about the mean. (D) ‘*’ denotes p=0.012 (2dpi), 0.0025 (3dpi), 0.0030 (4dpi), 0.0018 (6dpi). (E) ‘*’ denotes p=0.0426 (1dpi), 0.0194 (2dpi), 0.0442 (3dpi) (F–H) 200X images of lung sections from 2dpi (F) and 4dpi (G) and 100X images of nasal turbinates from 2dpi (H). Top: hematoxylin and eosin (H&E). Bottom: immunohistochemistry staining (IHC) for SARS-CoV-2 nucleocapsid protein, counterstained with hematoxylin. Scale bars=200 μm. Representative of two independent experiments.
Figure 3.
Figure 3.. SARS-CoV-2 MA replicates in old BALB/c mice with minor disease.
1-year-old female BALB/c were mock infected (gray), or infected with 105 PFU SARS-CoV-2 WT (black) or MA (red). Data combined from two independent experiments. (A) Percent starting weight. Dotted line represents weight loss criteria for humane euthanasia. Data analyzed by mixed effects analysis followed by Dunnett’s multiple comparisons. ‘*’ denotes p=<0.0001 (3dpi), 0.0305 (4dpi). (B–C) Viral lung (B) and nasal turbinate (C) titer. 2dpi & 4dpi: n=5 WT, n=10 MA. Dotted line represents limit of detection (LOD). Undetected samples are plotted at half the LOD. Log transformed data analyzed by 2-way ANOVA followed by Sidak’s multiple comparisons. ‘ND’=not determined (B) ‘*’ denotes p=<0.0001. (D–E) Whole body plethysmography assessing pulmonary function for PenH (D) and Rpef (E). Data analyzed by 2-way ANOVA followed by Dunnett’s multiple comparisons. Error bars represent standard error about the mean. (D) ‘*’ denotes p=0.0014 (2dpi). (E) ‘*’ denotes p=<0.0001 (2dpi), 0.0242 (3dpi), 0.0130 (4dpi), 0.0481 (5dpi). (F–H) 200X images of lung sections from 2dpi (F) and 4dpi (G) and 100X images of nasal turbinates from 2dpi (H). Top: hematoxylin and eosin (H&E). Bottom: immunohistochemistry staining (IHC) for SARS-CoV-2 nucleocapsid protein, counterstained with hematoxylin. Scale bars=200 μm. Representative of two independent experiments.
Figure 4.
Figure 4.. Evaluation of prevention and intervention strategies against SARS-CoV-2 MA infection in mice.
(A–C) Groups of 10-week-old female BALB/c mice were vaccinated with VRPs expressing wildtype spike (S, n=10), nucleocapsid (N, n=8), or GFP (n=4). (A) 50% inhibitory concentration (IC50) of sera from 3 weeks post boost to neutralize SARS-CoV-2 WT. Dotted line represents limit of detection (LOD). Log transformed data analyzed by 1-way ANOVA followed by Dunnett’s multiple comparisons. ‘*’ denotes p=0.0003. (B–C) Lung (B) and nasal turbinate (C) viral titer on 2dpi. Dotted line represents LOD. Undetected samples are plotted at half the LOD. Log transformed data analyzed as in (A). (B) ‘*’ denotes p=<0.0001. (C) ‘*’ denotes p=0.0360. (D) Human primary airway epithelial cells were pretreated for 24hrs with peg-IFN-λ1 followed by infection with SARS-CoV-2 WT. Infectious virus in apical washes from 48 hours post infection was titered. Remdesivir (RDV) was used as positive control. Data representative of two independent experiments in unique human donors. (E–I) 1-year-old female BALB/c mice were subcutaneously treated with vehicle or with 2μg peg-IFN-λ1 prophylactically or therapeutically and infected with SARS-CoV-2 MA. n=5 per group per timepoint. (E) Percent starting weight. Dotted line represents weight loss criteria for humane euthanasia. Data analyzed by mixed effects analysis followed by Dunnett’s multiple comparisons. (B) ‘*’ denotes p=<0.0001 (prophylactic, 2dpi), 0.0128 (therapeutic, 2dpi), 0.0042 (prophylactic, 4dpi), 0.0037 (therapeutic, 4dpi). (F–G) Viral titers in the lung (F) and nasal turbinates (G) at 2 and 4dpi. Dotted line represents LOD. Log transformed data analyzed by 2-way ANOVA followed by Dunnett’s multiple comparisons. (H–I) Whole body plethysmography assessing pulmonary function for PenH (H) and Rpef (I). Data analyzed as in (E). All error bars represent standard error about the mean. (H) ‘*’ denotes p=0.0083 (prophylactic, 2dpi), 0.0080 (therapeutic, 2dpi), 0.0029 (prophylactic, 3dpi), 0.0020 (therapeutic, 3dpi), 0.0327 (therapeutic, 4dpi). (I) ‘*’ denotes p=0.0442 (prophylactic, 1dpi), 0.0033 (therapeutic, 1dpi), 0.0048 (prophylactic, 2dpi), 0.0118 (therapeutic, 3dpi), 0.0259 (prophylactic, 4dpi), 0.0247 (therapeutic, 4dpi).

Update of

Similar articles

Cited by

References

    1. Li Q et al. Early Transmission Dynamics in Wuhan, China, of Novel Coronavirus-Infected Pneumonia. N Engl J Med 382, 1199–1207, doi: 10.1056/NEJMoa2001316 (2020). - DOI - PMC - PubMed
    1. Corbett KS et al. SARS-CoV-2 mRNA Vaccine Development Enabled by Prototype Pathogen Preparedness. bioRxiv, doi: 10.1101/2020.06.11.145920 (2020). - DOI - PMC - PubMed
    1. Hassan AO et al. A SARS-CoV-2 Infection Model in Mice Demonstrates Protection by Neutralizing Antibodies. Cell 182, 744–753 e744, doi: 10.1016/j.cell.2020.06.011 (2020). - DOI - PMC - PubMed
    1. Zhou P et al. A pneumonia outbreak associated with a new coronavirus of probable bat origin. Nature 579, 270–273, doi: 10.1038/s41586-020-2012-7 (2020). - DOI - PMC - PubMed
    1. Hou YJ et al. SARS-CoV-2 Reverse Genetics Reveals a Variable Infection Gradient in the Respiratory Tract. Cell 182, 429–446 e414, doi: 10.1016/j.cell.2020.05.042 (2020). - DOI - PMC - PubMed

Publication types

MeSH terms