. 2020 Aug 25;10(9):1665.
doi: 10.3390/nano10091665.

Investigating a Lock-In Thermal Imaging Setup for the Detection and Characterization of Magnetic Nanoparticles

Affiliations

Investigating a Lock-In Thermal Imaging Setup for the Detection and Characterization of Magnetic Nanoparticles

Lukas Steinmetz et al. Nanomaterials (Basel). .

Abstract

Magnetic hyperthermia treatments utilize the heat generated by magnetic nanoparticles stimulated by an alternating magnetic field. Therefore, analytical methods are required to precisely characterize the dissipated thermal energy and to evaluate potential amplifying or diminishing factors in order to ensure optimal treatment conditions. Here, we present a lock-in thermal imaging setup specifically designed to thermally measure magnetic nanoparticles and we investigate theoretically how the various experimental parameters may influence the measurement. We compare two detection methods and highlight how an affordable microbolometer can achieve identical sensitivity with respect to a thermal camera-based system by adapting the measurement time. Furthermore, a numerical model is used to demonstrate the optimal stimulation frequency, the degree of nanomaterial heating power, preferential sample holder dimensions and the extent of heat losses to the environment. Using this model, we also revisit some technical assumptions and experimental results that previous studies have stated and suggest an optimal experimental configuration.

Keywords: lock-in thermal imaging; magnetic nanoparticles; measurement instrument; thermal imaging.


Conflict of interest statement

Both Christoph Geers and Mathias Bonmarin have equities in the company Nanolockin GmbH that is commercializing lock-in thermal imaging instruments for NP detection and that might benefit from the research performed in this study.

Figures

Figure 1
Figure 1
Measurement apparatus designed to investigate thermal signals of magnetic NPs in an AMF. (A): Schematic diagram of the laboratory setup. The alternating magnetic field is generated using a commercial coil system (MagnethermTM V1.5, nanoTherics, Warrington, UK). The frame grabber card transfers the temperature images in real time to a personal computer for further processing, and it synchronizes the stimulation. (B): Schematic description of a potential alternative affordable setup. The temperature images acquired by a microbolometer camera are sent in real time via USB to a microcomputer for processing without the need of an additional frame grabber. A web server running on the microcomputer allows for a wireless data transfer to a laptop or tablet. As the camera is operating on a rolling frame basis it acts as a master clock sending trigger signals to the stimulation source.
Figure 2
Figure 2
(A): Picture of the custom-made polystyrene sample holder designed to investigate NP samples in the liquid state. 9 identical semi-spherical cuvettes allow for the simultaneous investigation of multiple samples. (B): 2D axi-symmetrical model of one single cuvette with the surrounding sample holder. The cuvette diameter d as well as the sample holder thickness l can be varied. The sample is considered to be a homogeneous heat source. Convection and radiation losses take place at the sample and sample holder surfaces, whereas the bottom of the sample holder is insulated. A tetrahedral finite element mesh is used, with a mesh size chosen to ensure numerical stability. (C): Simulation results of the sample holder surface and bulk temperature computed using the numerical model described in Section 2.2.
Figure 3
Figure 3
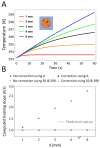
Variations of the cuvette diameter. (A): Time-dependent temperature of the sample for different cuvette diameters. For smaller diameters the signal reaches the quasi-steady state faster than for a larger cuvette, for which the signal is still in the thermal relaxation phase after 60 s. (B): Computed heating slope for different cuvette diameters. Heating slope values are normalized. As expected, for large cuvettes, a correction of the non-initial heating is required to extract accurate values. SAR calculations using the in-phase and in-quadrature signal or the amplitude signal alone lead to similar values.
Figure 4
Figure 4
Variations of the sample holder thickness. (A): Time-dependent temperature of the sample for different sample holder thickness values l. For larger thickness, the signal reaches the quasi-steady state faster than for a thinner sample holder, for which the signal is still in the thermal relaxation phase after 60 s. (B): Computed heating slope β (normalized) for different sample holder thickness values. Heating slope calculations using the in-phase and in-quadrature signal or the amplitude signal alone lead to similar values. Correction of the thermal relaxation phase is required, in particular for thinner sample holders.
Figure 5
Figure 5
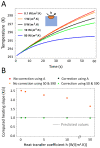
Variations of the heat loss coefficient. (A): Time-dependent temperature of the sample for different Newton coefficients h. For high h values, the thermal relaxation phase is shorter. (B): Computed β (normalized) for different values of h. Correction for the initial heating is required especially for high h values, for which the thermal relaxation phase is longer. β calculations using the in-phase and in-quadrature signal or the amplitude signal alone lead to similar values.
Figure 6
Figure 6
Variations of the stimulation frequency. (A): Time-dependent temperature of the sample for different stimulation frequencies. The stimulation frequency exhibits no effect on the duration of the thermal relaxation phase. (B): Computed heating slope β (normalized) for different stimulation frequencies. Correction for the unsteady initial heating is required for all frequencies. (C): Corrected heating slope values computed using the in-phase and in-quadrature signals or the amplitude alone. At low frequencies (less than 1 Hz), the exact calculation using the in-phase and in-quadrature signals leads to slightly more accurate results.
Figure 7
Figure 7
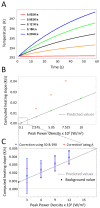
Variations of the heating slope. (A): Time-dependent temperature of the sample for different values of the heating slope. The heating slope influences the duration of the thermal relaxation phase as well as the signal amplitude. (B): Computed heating slope β (normalized) for different peak power density. Intuitively, the calculation using the amplitude is preferable in terms of sensitivity due to the ratio in Equation (12). (C): Extended view of the computed heating slope for low power values. Dots represent mean values whereas error bars the standard deviation, computed for 100 measurements. The black dot represents the experimental value of the background signal measured outside the cuvettes.
Figure 8
Figure 8
(A): Investigation of SPIONs with different size using measurements of the heating slope as a function of magnetic NP concentration for various sizes (triplicate experiment). Solid lines show best fit linear regression curves through the data. (B): Lower concentrations, approaching the limit of detection. In agreement with the model, the standard deviation increases at lower heating slopes. We plotted the value of the background that was previously used as limit of detection. Inset: Example of an heating slope image where the nine cuvettes are loaded with an identical sample. The homogeneous background signal outside the cuvette area was previously used to estimate the minimal measurable signal. Data taken with permission from [22].
Figure 9
Figure 9
Comparison of LIT thermal investigations on 21 nm SPIONs using a microbolometer sensor (PI-460, Optris, Berlin, Germany) and a quantum sensor (Onca-MWIR-InSb-320, XenICs, Leuven, Belgium) (triplicate experiment). Solid lines show best fit linear regression curves through the data. To compensate for the lower sensitivity of the microbolometer sensor, measurement times were adjusted, i.e., 30 s and 500 s were set for the Onca camera and the PI-460, respectively.

Similar articles

Cited by

References

    1. Rosensweig R.E. Heating magnetic fluid with alternating magnetic field. J. Magn. Magn. Mater. 2002;252:370–374. doi: 10.1016/S0304-8853(02)00706-0. - DOI
    1. Lin M.M., Kim D.K., El Haj A.J., Dobson J. Development of superparamagnetic iron oxide nanoparticles (SPIONS) for translation to clinical applications. IEEE Trans. Nanobiosci. 2008;7:298–305. doi: 10.1109/TNB.2008.2011864. - DOI - PubMed
    1. Mahmoudi M., Sant S., Wang B., Laurent S., Sen T. Superparamagnetic iron oxide nanoparticles (SPIONs): Development, surface modification and applications in chemotherapy. Adv. Drug Deliv. Rev. 2011;63:24–46. doi: 10.1016/j.addr.2010.05.006. - DOI - PubMed
    1. Lattuada M., Hatton T.A. Functionalization of monodisperse magnetic nanoparticles. Langmuir. 2007;23:2158–2168. doi: 10.1021/la062092x. - DOI - PubMed
    1. Laurent S., Dutz S., Häfeli U.O., Mahmoudi M. Magnetic fluid hyperthermia: Focus on superparamagnetic iron oxide nanoparticles. Adv. Colloid Interface Sci. 2011;166:8–23. doi: 10.1016/j.cis.2011.04.003. - DOI - PubMed

LinkOut - more resources