. 2020 Sep;13(3):171-184.
doi: 10.14802/jmd.20029. Epub 2020 Aug 31.

Emerging Concepts of Motor Reserve in Parkinson's Disease

Affiliations

Emerging Concepts of Motor Reserve in Parkinson's Disease

Seok Jong Chung et al. J Mov Disord. 2020 Sep.

Abstract

The concept of cognitive reserve (CR) in Alzheimer's disease (AD) explains the differences between individuals in their susceptibility to AD-related pathologies. An enhanced CR may lead to less cognitive deficits despite severe pathological lesions. Parkinson's disease (PD) is also a common neurodegenerative disease and is mainly characterized by motor dysfunction related to striatal dopaminergic depletion. The degree of motor deficits in PD is closely correlated to the degree of dopamine depletion; however, significant individual variations still exist. Therefore, we hypothesized that the presence of motor reserve (MR) in PD explains the individual differences in motor deficits despite similar levels of striatal dopamine depletion. Since 2015, we have performed a series of studies investigating MR in de novo patients with PD using the data of initial clinical presentation and dopamine transporter PET scan. In this review, we summarized the results of these published studies. In particular, some premorbid experiences (i.e., physical activity and education) and modifiable factors (i.e., body mass index and white matter hyperintensity on brain image studies) could modulate an individual's capacity to tolerate PD pathology, which can be maintained throughout disease progression.

Keywords: Dopamine transporter; Motor reserve; Parkinson’s disease; Positron-emission tomography.


Conflict of interest statement

Conflicts of Interest

The authors have no financial conflicts of interest.

Figures

Figure 1.
Figure 1.
Schematic drawing for representing MR in PD. A: Individuals with low MR might manifest parkinsonian symptoms at mild levels of PD pathology. B: When DAT activity in the posterior putamen is used as an indirect marker for the PD pathological burden, individuals with low MR would exhibit higher UPDRS motor scores at a similar level of DAT activity. MR: motor reserve, PD: Parkinson’s disease, DAT: dopamine transporter, UPDRS: Unified Parkinson’s Disease Rating Scale.
Figure 2.
Figure 2.
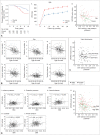
Premorbid experiences and MR. A: A scatterplot showing the relationship between DAT activity in the posterior putamen and motor deficits according to the premorbid physical activity. The highest tertile group (red) showed a significantly steeper slope compared with the middle tertile (green, p = 0.002) and the low tertile group (blue, p = 0.001), suggesting that engagement in premorbid exercise acts as a proxy for an active reserve in patients with PD [Adapted from Sunwoo et al. Parkinsonism Relat Disord 2017;34:49-53 (13)]. B: A scatterplot showing the relationship between DAT activity in the posterior putamen and motor deficits according to the level of education. Patients with higher education (closed circle) exhibited lower UPDRS motor scores compared to those with lower education (open circle) despite having a similar DAT activity in the posterior putamen (p = 0.032) [Adapted from figure from Sunwoo et al. J Neurol Sci 2016;362:118-120 (18)]. C: I. A scatterplot showing the relationship between DAT activity in the posterior putamen and motor deficits according to smoking status. Although mean DAT activity in the posterior putamen (p = 0.016) and ventral putamen (p = 0.028) was higher in current smokers (red) compared to ex-smokers (green) and never-smokers (blue), a similar slope of motor deficits relative to DAT activity among the groups suggests that current smoking does not enhance MR in individuals with PD. II. Comparison of longitudinal increases in LED according to smoking status. No significant differences in changes in LED were noted among the smoking groups (interaction between group and time, p = 0.948), suggesting that current smoking has no additional clinical benefits in prognostic aspects [Adapted from Lee et al. Ann Neurol 2017;82:850-854 (28)]. MR: motor reserve, DAT: dopamine transporter, PD: Parkinson’s disease, UPDRS: Unified Parkinson’s Disease Rating Scale, LED: levodopa-equivalent dose.
Figure 3.
Figure 3.
Demographic variables and motor reserve. A: I. Survival curves of the development of FOG in patients with young-onset PD (n = 66) and old-onset PD (n = 73). The old-onset group demonstrated an increased risk for developing FOG compared with the young-onset group (p = 0.007). II. Comparison of longitudinal increases in LED according to age at onset. The old-onset group required higher doses of dopaminergic medications for symptom control compared with the young-onset group (interaction between group and time, p < 0.001). III. A scatterplot showing the relationship between DAT activity in the posterior putamen and motor deficits according to age of onset. The old-onset group (green circle) exhibited more severe motor deficits than the young-onset group (red circle) after controlling for sex, disease duration, and DAT activity in the posterior putamen (p = 0.016) [Adapted from Chung et al. J Mov Disord 2019;12:113-119 (36)]. B: Scatterplots showing the relationship between DAT activity in the striatal subregions and age of onset according to sex. Women (closed triangle) exhibited higher DAT activity in all the striatal subregions compared with men (open circle). Women (dotted line) exhibited a more rapid decrease in DAT activity in the antero-dorsal striatum (anterior caudate, p = 0.004; posterior caudate, p = 0.003; anterior putamen, p = 0.013) but not in the sensorimotor striatum (posterior putamen, p = 0.424; ventral putamen, p = 0.121) compared with men (solid line) [Adapted from Lee et al. J Mov Disord 2015;8:130-135 (45)]. C: A scatterplot showing the relationship between DAT activity in the posterior putamen and motor deficits according to handedness. Patients with dominant-side onset PD (closed triangle) showed lower UPDRS motor scores compared with nondominant-side onset PD (open circle) despite exhibiting a similar level of DAT activity in the posterior putamen (p = 0.013) [Adapted from Ham et al. Mov Disord 2015;30:1921-1925 (52)]. FOG: freezing of gait, PD: Parkinson’s disease, LED: levodopa-equivalent dose, DAT: dopamine transporter, UPDRS: Unified Parkinson’s Disease Rating Scale. Demographic variables and motor reserve. D: I–V. Scatterplots showing the relationship between DAT activity in the striatal subregions and BMI. BMI was positively correlated with DAT activity in the anterior putamen (r = 0.162, p = 0.001), posterior putamen (r = 0.133, p = 0.009), ventral striatum (r = 0.134, p = 0.008), caudate nucleus (r = 0.159, p = 0.002), and total striatum (r = 0.164, p = 0.001) [Adapted from Lee et al. Neurobiol Aging 2016;38:197-204 (55)]. VI. A scatterplot showing the relationship between DAT activity in the posterior putamen and motor deficits according to BMI. The low BMI group (the first and second quintile group) exhibited higher UPDRS motor scores than the high BMI group (the fourth and fifth quintile group) after controlling for age, sex, and DAT activity in the posterior putamen. DAT: dopamine transporter, BMI: body mass index, UPDRS: Unified Parkinson’s Disease Rating Scale.
Figure 4.
Figure 4.
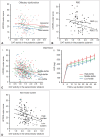
Preclinical and clinical presentation and motor reserve. A: A scatterplot showing the relationship between DAT activity in the posterior putamen and motor deficits according to olfactory function. Normosmic PD patients (blue) exhibited lower UPDRS motor scores than hyposmic PD patients (red) at similar levels of DAT activity (p = 0.016) [Adapted from Lee et al. Neurology 2015;85:1270-1275 (8)]. B: A scatterplot showing the relationship between DAT activity in the posterior putamen and motor deficits according to the presence of RBD. PD patients with clinically probable RBD (closed circle) exhibited higher UPDRS motor scores than those without clinically probable RBD (open circle) at similar levels of DAT activity (p = 0.046) [Adapted from Chung et al. Eur J Neurol 2017;24:1314-1319 (70)]. C: I. A scatterplot showing the relationship between DAT activity in the posterior putamen and motor deficits according to the BDI scores. The highest tertile group (red circle) exhibited higher UPDRS motor scores than the lowest tertile group (blue circle) after controlling for DAT activity in the posterior putamen (p = 0.046). II. Comparison of longitudinal increases in LED according to the BDI scores. The highest tertile group required higher doses of dopaminergic medications for symptom control compared with the lowest tertile group [Adapted from Lee et al. PLoS One 2018;13:e0203303 (73)]. D: A scatterplot showing the relationship between DAT activity in the posterior putamen and motor deficits according to the NMS burden. The high NMS burden group (closed circle) exhibited higher UPDRS motor scores compared with the low NMS burden group (open circle) at similar levels of DAT activity (p = 0.004) [Adapted from Chung et al. PLoS One 2016;11:e0161316 (80)]. DAT: dopamine transporter, PD: Parkinson’s disease, UPDRS: Unified Parkinson’s Disease Rating Scale, RBD: rapid eye movement sleep behavior disorder, BDI: Beck Depression Inventory, LED: levodopa-equivalent dose, NMS: nonmotor symptoms.
Figure 5.
Figure 5.
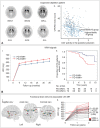
Neuroimaging markers and MR. A: I. Examples of PD groups according to ISR and AI. The ISR-H exhibited a slower longitudinal increase in doses of dopaminergic medications than the ISR-L (p = 0.003). The AI-H exhibited milder parkinsonian motor signs than the AI-L despite their greater decrease in DAT activity in the posterior putamen. The AI-H group also showed a slower longitudinal increase in doses of dopaminergic medications than the AI-L group (p < 0.001) [Adapted from Chung et al. Clin Nucl Med 2018;43:787-792 (88)]. II. A scatterplot showing the relationship between DAT activity in the posterior putamen and motor deficits according to the AI value. The highest tertile AI group (sky-blue circle and solid line) exhibited lower UPDRS motor scores than the lowest tertile AI group (dark blue circle and dashed line) despite a greater decrease in DAT activity in the posterior putamen. B: WMH signals. I. Longitudinal increases in LED. The PD group with moderate to severe WMH received higher doses of dopaminergic medications compared with the PD group with minimal WMH [Adapted from Chung et al. Parkinsonism Relat Disord 2019;66:105-109 (100)]. II. Curves of Kaplan-Meier estimates of the onset of FOG in PD patients with moderate to severe WMH and matched PD patients with minimal WMH. The moderate to severe WMH group exhibited an increased risk for developing FOG than the minimal WMH group (PLog-rank < 0.001). C: I. Functional brain network associated with MR (MR network) at a primary threshold of p-value 0.001. A network-based statistic analysis identified that the MR network is composed of the basal ganglia, hippocampus, amygdala, inferior frontal cortex, insula, and cerebellar vermis. II. Spaghetti plot showing longitudinal changes in LED according to the MR network strength. The MRN-L (lower quartile, red line) exhibited a steeper increase in LED at 1-year and 2-year follow-up visits than the MRN-H (upper quartile, black line) [Adapted from Chung et al. Mov Disord 2020;35:577-586 (22)]. MR: motor reserve, PD: Parkinson’s disease, ISR: intersubregional ratio, AI: asymmetry index, ISR-H: highest tertile group according to ISR, ISR-M: middle tertile group according to ISR, ISR-L: lowest tertile group according to ISR, AI-H: highest tertile group according to AI, AI-M: middle tertile group according to AI, AI-L: lowest tertile group according to AI, DAT: dopamine transporter, UPDRS: Unified Parkinson’s Disease Rating Scale, WMH: white matter hyperintensity, LED: levodopa-equivalent dose, FOG: freezing of gait, MRN-L: low MR network strength group, MRN-H: high MR network strength group.
Figure 6.
Figure 6.
Prognostic implications of MR. A: Classification of the patients with PD according to MR. MR estimates of each patient were calculated based on the baseline UPDRS motor score and DAT activity in the posterior putamen. The general linear model was used to predict the UPDRS motor scores using age, disease duration, and the natural logarithm of DAT activity in the posterior putamen. The solid line (black) indicates the regression line of the general linear model, and the dotted lines (red) indicate the range of ± 0.5 standard deviations of the fitted values. PD-H (standardized residuals < -0.5); PD-L (standardized residuals > 0.5). B: I. Longitudinal increases in LED. The low MR group received higher doses of dopaminergic medications for symptom control compared with the high MR group during the follow-up period. II. Curves of Kaplan-Meier estimates of the onset of levodopa-induced dyskinesia in PD groups. The low MR group exhibited an increased risk for the early development of levodopa-induced dyskinesia compared with the high MR group (PLog-rank < 0.001). III. Curves of Kaplan-Meier estimates of the onset of FOG in the PD groups. The low MR group exhibited an increased risk of developing FOG compared to the high MR group (PLog-rank = 0.045) [Adapted from Chung et al. Neurobiol Aging 2020;92:1-6 (111)]. MR: motor reserve, PD: Parkinson’s disease, UPDRS: Unified Parkinson’s Disease Rating Scale, DAT: dopamine transporter, PD-H: PD group with high MR, PD-L: PD group with low MR, LED: levodopa-equivalent dose, FOG: freezing of gait, LID: levodopa-induced dyskinesia.

References

    1. Pettigrew C, Soldan A. Defining cognitive reserve and implications for cognitive aging. Curr Neurol Neurosci Rep. 2019;19:1. - PMC - PubMed
    1. Stern Y. Cognitive reserve in ageing and Alzheimer’s disease. Lancet Neurol. 2012;11:1006–1012. - PMC - PubMed
    1. Fearnley JM, Lees AJ. Ageing and Parkinson’s disease: substantia nigra regional selectivity. Brain. 1991;114(Pt 5):2283–2301. - PubMed
    1. Wilson RS, Nag S, Boyle PA, Hizel LP, Yu L, Buchman AS, et al. Neural reserve, neuronal density in the locus ceruleus, and cognitive decline. Neurology. 2013;80:1202–1208. - PMC - PubMed
    1. Palmer SJ, Ng B, Abugharbieh R, Eigenraam L, McKeown MJ. Motor reserve and novel area recruitment: amplitude and spatial characteristics of compensation in Parkinson’s disease. Eur J Neurosci. 2009;29:2187–2196. - PubMed

LinkOut - more resources