Randomized Controlled Trial
. 2021 Jan 1;178(1):39-47.
doi: 10.1176/appi.ajp.2020.19080886. Epub 2020 Aug 28.

Treatment-Specific Associations Between Brain Activation and Symptom Reduction in OCD Following CBT: A Randomized fMRI Trial

Affiliations
Randomized Controlled Trial

Treatment-Specific Associations Between Brain Activation and Symptom Reduction in OCD Following CBT: A Randomized fMRI Trial

Luke J Norman et al. Am J Psychiatry. .

Abstract

Objective: The authors sought to examine whether brain activity is associated with treatment response to cognitive-behavioral therapy (CBT) in adolescents and adults with obsessive-compulsive disorder (OCD), and whether any associations are treatment specific relative to an active control psychotherapy (stress management therapy; SMT).

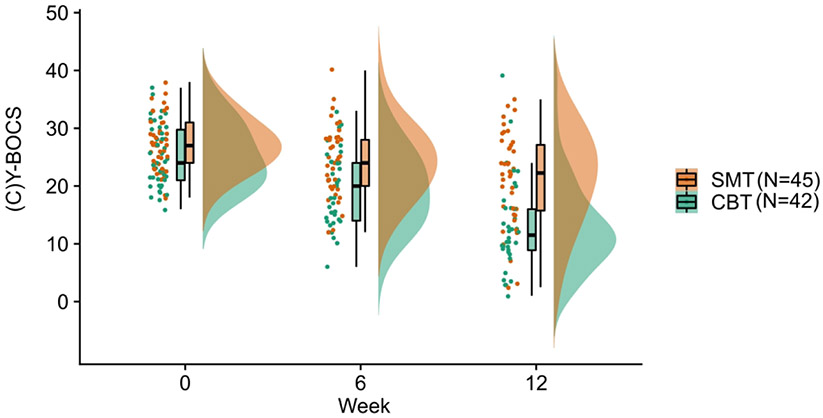
Methods: Eighty-seven patients with OCD (age range 12-45 years; 57 female, 39 medicated) were randomly assigned to receive 12 weeks of CBT or SMT. Prior to treatment, functional MRI scans were conducted in patients performing an incentive flanker task, which probes brain activation to both cognitive control and reward processing. Voxelwise linear mixed-effects models examined whether baseline brain activation was differentially associated with change in scores on the Yale-Brown Obsessive Compulsive Scale (standard or Children's version) over the course of CBT or SMT treatment.

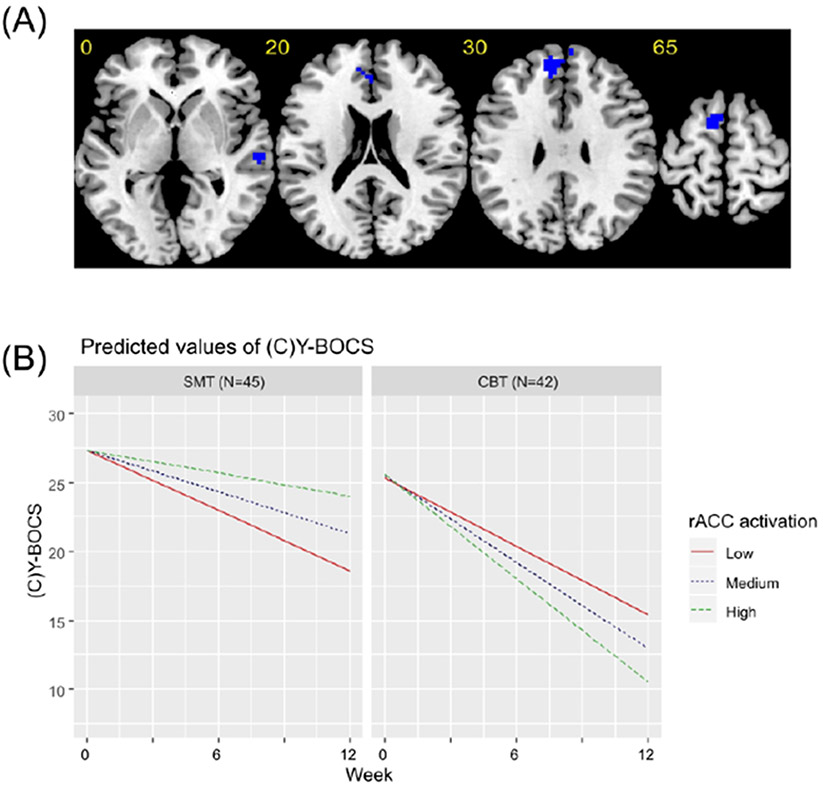
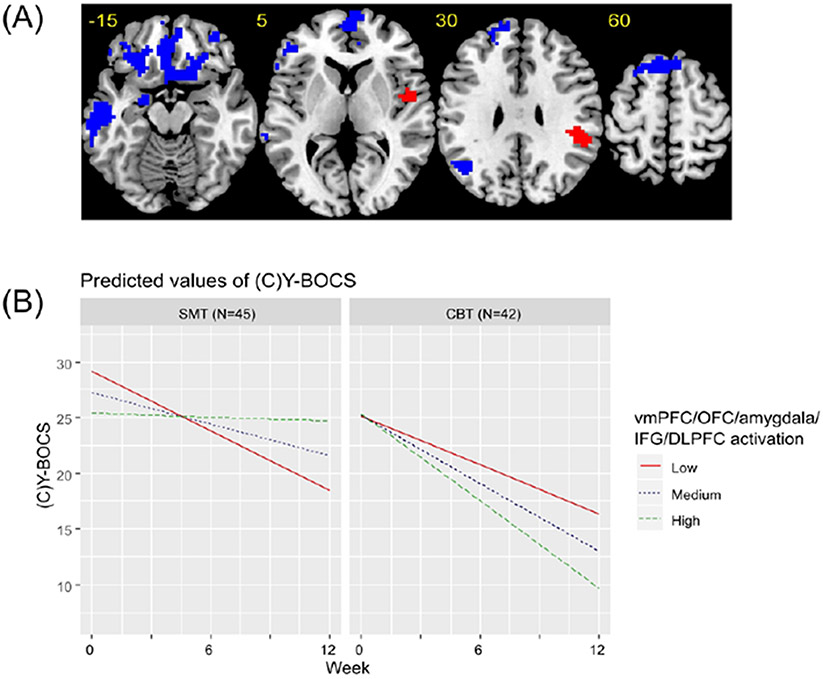
Results: Within the CBT group, a better treatment response was significantly associated with greater pretreatment activation within the right temporal lobe and rostral anterior cingulate cortex during cognitive control and within the ventromedial prefrontal, orbitofrontal, lateral prefrontal, and amygdala regions during reward processing. In contrast, reduced pretreatment activation within a largely overlapping set of regions was significantly associated with a better treatment response to SMT.

Conclusions: The study findings demonstrate that associations between brain activation and treatment response were treatment specific to CBT relative to a control psychotherapy and that these associations were stable from adolescence to mature adulthood. Such treatment-specific associations are important for the development of biomarkers to personalize treatment in OCD.

Trial registration: ClinicalTrials.gov NCT02437773.

Keywords: Cognitive-Behavioral Therapy; Inhibitory Control; Obsessive-Compulsive Disorder; Reward Processing; fMRI.


Conflict of interest statement

Conflict of Interest Disclosures

SFT has received research support from Neuronetics, St. Jude Medical (now Abbott), Boehringer–Ingelheim, and Otsuka Pharmaceutical. The remaining authors report no financial relationships with commercial interests.

Figures

Figure 1.
Figure 1.. Raincloud plot of the change in OCD symptoms over the course of CBT and SMT treatment in patients with OCD.
Patients who underwent CBT (B=−6.13, t=−12.89, p< 0.001, 95% CI (−7.07, −5.18)) and SMT (B =−2.94, t=−5.64, p<0.001, 95% CI (−3.9, −1.9)) showed a significant decrease in symptoms over the course of treatment. There was a significant treatment group by week interaction. Patients who underwent CBT showed a steeper reduction in (C)Y-BOCS scores over time compared to patients who underwent SMT (B=−3.21, t=−4.52, p=0.001, 95% CI (−4.61, −1.81)).
Figure 2.
Figure 2.. Brain regions significant in the linear mixed effects model for the cognitive control contrast.
(A) Axial slices showing brain regions that were significant in the linear mixed-effects model of the interactive effect of voxel-activation during cognitive control, treatment group and week on (Child’s) Yale-Brown Obsessive Compulsive Scale ((C)Y-BOCS) scores. All regions are presented at an uncorrected cluster forming threshold of p<0.001 and a familywise error corrected cluster threshold of p<0.05, except for the cluster in the rostral anterior cingulate (rACC), which is presented using an uncorrected cluster forming threshold of p<0.0025 and a familywise error corrected cluster threshold of p<0.05. Blue indicates regions where more pre-treatment activation was associated with greater symptom reduction over time in patients undergoing CBT, but a smaller reduction in symptoms over time in patients undergoing SMT. (B) Graphs showing predicted model estimates for cognitive behavioral therapy (CBT) and stress management therapy (SMT) groups. The y-axis represents the predicted (C)Y-BOCS based on model estimates, and separate lines indicate level of rACC activation (“Low” = one standard deviation below mean, “Medium” = mean, “High” = one standard deviation above the mean). Graphs for other regions are given in the Supplement.
Figure 3.
Figure 3.. Brain regions significant in the linear mixed effects model for the reward processing contrast.
(A) Axial slices showing brain regions that were significant in the linear mixed-effects model of the interactive effect of voxel-activation during reward processing, treatment group and week on (Child’s) Yale-Brown Obsessive Compulsive Scale ((C)Y-BOCS) scores. All regions are presented at an uncorrected cluster forming threshold of p<0.001 and a familywise error corrected cluster threshold of p<0.05. Blue indicates regions where more pre-treatment activation was associated with greater symptom reduction over time in patients undergoing CBT, but a smaller reduction in symptoms over time in patients undergoing SMT. Red indicates regions where more pre-treatment activation was associated with a smaller reduction in symptoms over time in patients undergoing CBT, but a greater reduction in symptoms over time in patients undergoing SMT. (B) Graphs showing predicted model estimates for cognitive behavioral therapy (CBT) and stress management therapy (SMT) groups. The y-axis represents the predicted (C)Y-BOCS based on model estimates, and separate lines indicate level of vmPFC/OFC/amygdala/IFG/DLPFC activation (“Low” = one standard deviation below mean, “Medium” = mean, “High” = one standard deviation above the mean). Graphs for other regions are given in the Supplement.

References

    1. Hirschtritt ME, Bloch MH, Mathews CA: Obsessive-Compulsive Disorder: Advances in Diagnosis and Treatment. JAMA 2017; 317:1358–1367 - PubMed
    1. Strauss AY, Huppert JD, Simpson HB, et al.: What matters more? Common or specific factors in cognitive behavioral therapy for OCD: Therapeutic alliance and expectations as predictors of treatment outcome. Behav Res Ther 2018; 105:43–51 - PMC - PubMed
    1. Skapinakis P, Caldwell DM, Hollingworth W, et al.: Pharmacological and psychotherapeutic interventions for management of obsessive-compulsive disorder in adults: a systematic review and network meta-analysis. Lancet Psychiatry 2016; 3:730–739 - PMC - PubMed
    1. Norman LJ, Taylor SF, Liu Y, et al.: Error Processing and Inhibitory Control in Obsessive-Compulsive Disorder: A Meta-analysis Using Statistical Parametric Maps. Biol Psychiatry 2019; 85:713–725 - PMC - PubMed
    1. Goodkind M, Eickhoff SB, Oathes DJ, et al.: Identification of a common neurobiological substrate for mental illness. JAMA Psychiatry 2015; 72:305–315 - PMC - PubMed

Publication types

Associated data