

Dynamic RMST curves for survival analysis in clinical trials
- PMID: 32854619
- PMCID: PMC7534804
- DOI: 10.1186/s12874-020-01098-5
Dynamic RMST curves for survival analysis in clinical trials
Abstract
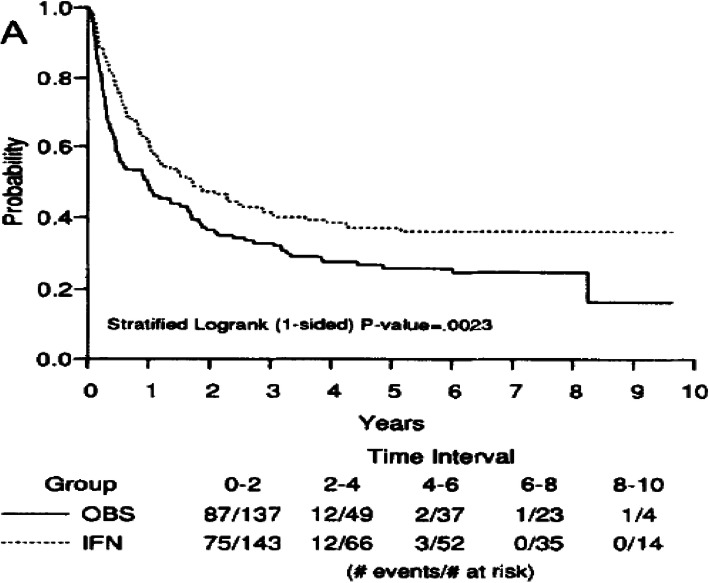
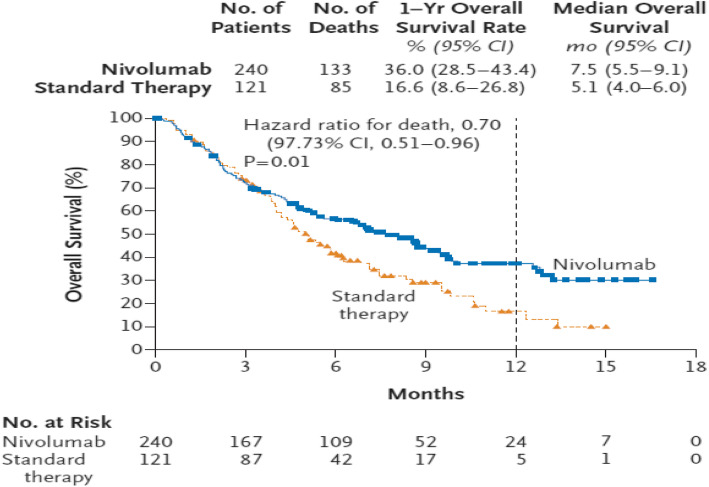
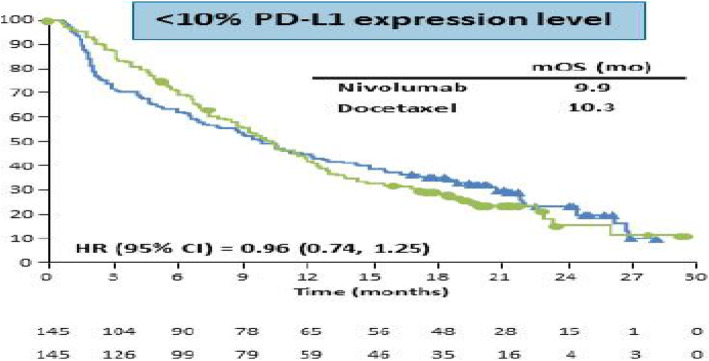
Background: The data from immuno-oncology (IO) therapy trials often show delayed effects, cure rate, crossing hazards, or some mixture of these phenomena. Thus, the proportional hazards (PH) assumption is often violated such that the commonly used log-rank test can be very underpowered. In these trials, the conventional hazard ratio for describing the treatment effect may not be a good estimand due to the lack of an easily understandable interpretation. To overcome this challenge, restricted mean survival time (RMST) has been strongly recommended for survival analysis in clinical literature due to its independence of the PH assumption as well as a more clinically meaningful interpretation. The RMST also aligns well with the estimand associated with the analysis from the recommendation in ICH E-9 (R1), and the test/estimation coherency. Currently, the Kaplan Meier (KM) curve is commonly applied to RMST related analyses. Due to some drawbacks of the KM approach such as the limitation in extrapolating to time points beyond the follow-up time, and the large variance at time points with small numbers of events, the RMST may be hindered.
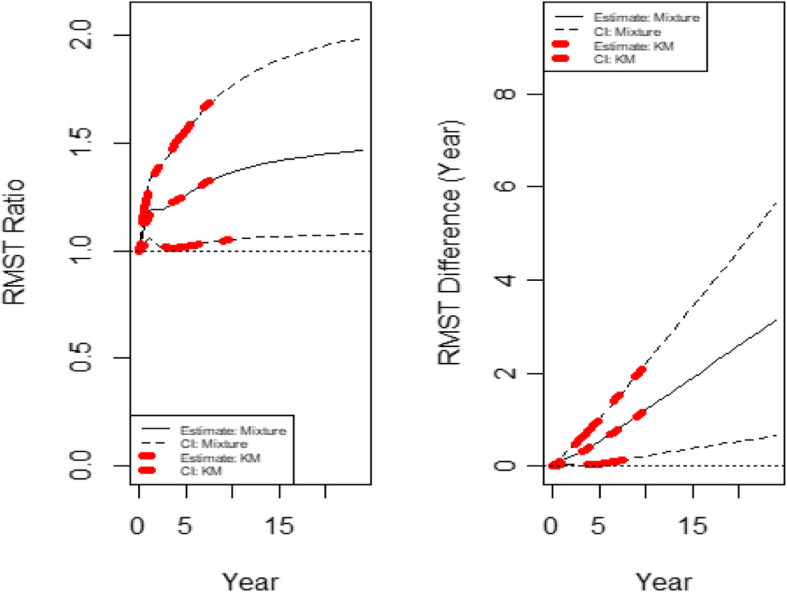
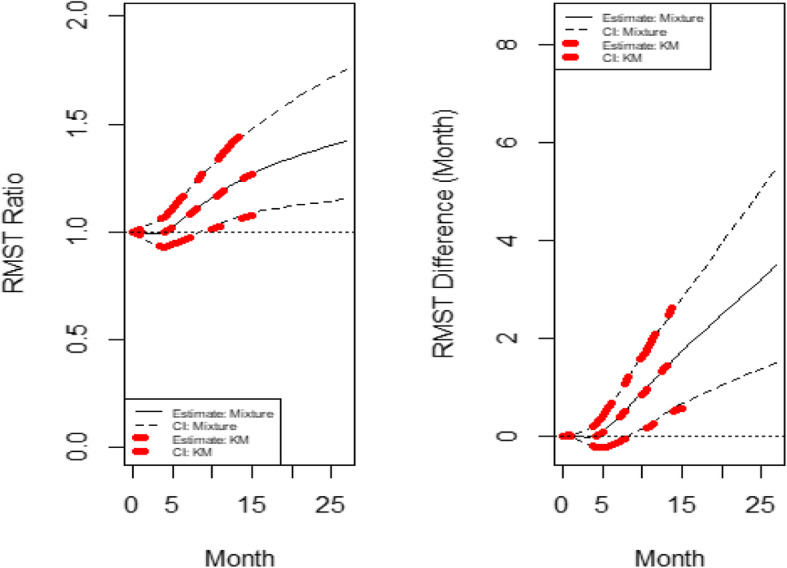
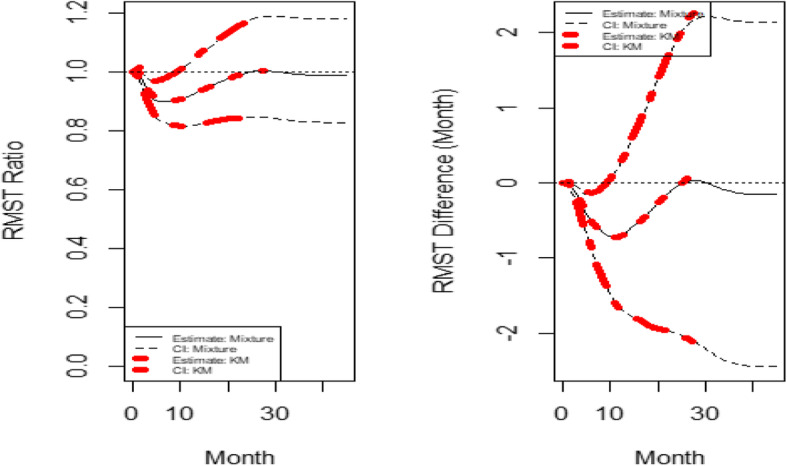
Methods: The dynamic RMST curve using a mixture model is proposed in this paper to fully enhance the RMST method for survival analysis in clinical trials. It is constructed that the RMST difference or ratio is computed over a range of values to the restriction time τ which traces out an evolving treatment effect profile over time.
Results: This new dynamic RMST curve overcomes the drawbacks from the KM approach. The good performance of this proposal is illustrated through three real examples.
Conclusions: The RMST provides a clinically meaningful and easily interpretable measure for survival clinical trials. The proposed dynamic RMST approach provides a useful tool for assessing treatment effect over different time frames for survival clinical trials. This dynamic RMST curve also allows ones for checking whether the follow-up time for a study is long enough to demonstrate a treatment difference. The prediction feature of the dynamic RMST analysis may be used for determining an appropriate time point for an interim analysis, and the data monitoring committee (DMC) can use this evaluation tool for study recommendation.
Keywords: Estimand; Immuno-oncology trial; Log-rank test; Mixture Weibull; RMST; Survival.
Conflict of interest statement
The authors declare that they have no competing interests
Figures
References
-
- Callegaro A, Spiessens B. Testing treatment effect in randomized clinical trials with possible nonproportional hazards. Statistics Biopharmaceutical Research. 2017;9(2):204–211. doi: 10.1080/19466315.2016.1257436. - DOI
-
- Rufibach K. Treatment effect quantification for time-to-event endpoints-Estimands, analysis strategies, and beyond. Pharm Stat. 2019;18:145–65. - PubMed
MeSH terms
LinkOut - more resources
Full Text Sources
