. 2020 Aug 27;20(1):397.
doi: 10.1186/s12870-020-02584-0.

Saving time maintaining reliability: a new method for quantification of Tetranychus urticae damage in Arabidopsis whole rosettes

Affiliations

Saving time maintaining reliability: a new method for quantification of Tetranychus urticae damage in Arabidopsis whole rosettes

Dairon Ojeda-Martinez et al. BMC Plant Biol. .

Abstract

Background: The model species Tetranychus urticae produces important plant injury and economic losses in the field. The current accepted method for the quantification of the spider mite damage in Arabidopsis whole rosettes is time consuming and entails a bottleneck for large-scale studies such as mutant screening or quantitative genetic analyses. Here, we describe an improved version of the existing method by designing an automatic protocol. The accuracy, precision, reproducibility and concordance of the new enhanced approach are validated in two Arabidopsis accessions with opposite damage phenotypes. Results are compared to the currently available manual method.

Results: Image acquisition experiments revealed that the automatic settings plus 10 values of brightness and the black background are the optimal conditions for a specific recognition of spider mite damage by software programs. Among the different tested methods, the Ilastik-Fiji tandem based on machine learning was the best procedure able to quantify the damage maintaining the differential range of damage between accessions. In addition, the Ilastik-Fiji tandem method showed the lowest variability within a set of conditions and the highest stability under different lighting or background surroundings. Bland-Altman concordance results pointed out a negative value for Ilastik-Fiji, which implies a minor estimation of the damage when compared to the manual standard method.

Conclusions: The novel approach using Ilastik and Fiji programs entails a great improvement for the quantification of the specific spider mite damage in Arabidopsis whole rosettes. The automation of the proposed method based on interactive machine learning eliminates the subjectivity and inter-rater-variability of the previous manual protocol. Besides, this method offers a robust tool for time saving and to avoid the damage overestimation observed with other methods.

Keywords: Arabidopsis thaliana; Assess; Chlorotic spots; CompuEye; Fiji; Ilastik; Machine learning; Photoshop; Plant damage quantification; Tetranychus urticae.


Conflict of interest statement

The authors declare that they have no competing interests.

Figures

Fig. 1
Fig. 1
Flow chart of the analysis procedure using the Ilastik-Fiji method. Eight rosettes for control or treated rosettes were scanned either on black or white background (a), rosettes are individualized, and the total area of each rosette is estimated using Photoshop (b). A selection of individual rosettes is imported to Ilastik (c) and used to train the program (d), to distinguish mite damage (red), from healthy rosette (green) and background (yellow). All the images are processed and exported as 8-bit (e). The previous images are imported into Fiji and the damaged areas extracted and exported as black and white images (f). The damaged area is calculated for treated and control rosettes (g). Control rosettes are then used to correct the damage area from mite-treated plants. Black and white scale bars indicate 1 cm
Fig. 2
Fig. 2
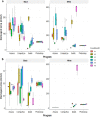
Box-and-whiskers plots representing the estimated damaged area (mm2). Data were obtained from each system under different lighting conditions and white and black backgrounds: (a) Without control rosette correction, and (b) after error correction using rosette controls. Data were obtained from A. thaliana Col-0 genotype, infested with 50 T. urticae adults for 4 days; n = 3. Lighting conditions (Brightness, Contrast for each case): A1 = 1,-56; A2 = 50,-25; A6 = 90,-100; A4 = Automatic threshold (30,-69 White; 40,-69 Black); A3 and A5 values were selected for each background subtracting and adding 10 values of brightness, respectively, maintaining contrast values. Black dots indicate outlier values
Fig. 3
Fig. 3
Box-and-whiskers plots representing the estimated damaged area (mm2) obtained from each of the systems under different lighting conditions and white (top row) and black (lower row) backgrounds. Data were obtained from A. thaliana Col-0, Bla-2 and Kon genotypes, infested with 20 T. urticae adults for 4 days; n = 8. Lighting conditions (brightness, contrast for each case): w2 and b2 (central column) = Automatic threshold (30,-20 White; 40,-10 Black); w1, w3, b1 and b3 values were selected for each background subtracting and adding 10 values of brightness, respectively, maintaining contrast values. Black dots indicate outlier values
Fig. 4
Fig. 4
Bland-Altman plot comparing reproducibility of the three automatic methods and the standard on different backgrounds. Each panel compares the results of the methods on white versus black background for the genotypes Bla-2 (upper panel), Col-0 (middle panel) and Kon (lower panel). Method identification is on top of its corresponding column. The Y axis represents the damage values on white background minus the values estimated on the black background. The central solid line indicates the mean difference, the two outer dashed lines indicate ±1.96 standard deviations
Fig. 5
Fig. 5
Area selection accuracy on two lighting conditions and backgrounds. The identification of damaged areas by the two software’s that has the best accuracy (Ilastik and Assess), is assessed using the standard (Photoshop, top row). Results are shown for the brightest conditions on both backgrounds: w3 (white background, middle row) and b3 (black background, lower row). Damaged areas are represented by red colour (Assess and Photoshop) and black colour (Ilastik). Lighting conditions (brightness, contrast for each case): w3 and b3 (40,-20 White; 50,-10 Black, respectively). Black scale bar indicates 1 cm
Fig. 6
Fig. 6
Bland-Altman plots of estimated damage area (automated method vs Photoshop). The central solid line indicates the mean difference, the two outer dashed lines indicate ±1.96 standard deviations. The observations that correspond to each A. thaliana genotype are shown in different colors and shapes. Black triangles indicate Bla-2, red dots indicate Col-0 and green squares indicate Kon. Data were obtained from A. thaliana Col-0, Bla-2 and Kon genotypes, infested with 20 T. urticae adults for 4 days; n = 8. Lighting conditions (brightness, contrast for each case): w2 and b2 = Automatic threshold (30,-20 White; 40,-10 Black); w3 and b3 values were selected for each background adding 10 values of brightness, maintaining contrast values
Fig. 7
Fig. 7
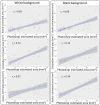
Spearman correlation coefficient (rs) describing the relationship between the damage estimated areas by Photoshop and by the automatic methods. The blue line represents the best fit and the grey areas show a confidence interval with 95% probability
Fig. 8
Fig. 8
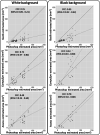
Lin’s concordance correlation analysis of T. urticae damage estimated manually (Photoshop) versus automatic methods. The solid line represents the line of concordance, indicating perfect agreement among methods. The dotted line indicates the line of the best fit to the values. The coefficient (CCC) is represented for each case and its respective 95% confidence interval (CI)
Fig. 9
Fig. 9
Box-and-whiskers plots of the damaged area percentage identified on control rosettes. Each automatic method is assessed under different lighting conditions and on white (top row) and black (lower row) backgrounds. Data are obtained from A. thaliana Col-0, Bla-2 and Kon genotypes, n = 8. Lighting conditions (brightness and contrast for each case): w2 and b2 (central column) = Automatic threshold (30,-20 White; 40,-10 Black); w1, w3, b1 and b3 values are selected for each background subtracting and adding 10 values of brightness, respectively, maintaining contrast values. Black dots indicate outlier values
Fig. 10
Fig. 10
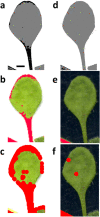
“Damaged areas” identified by the automatic methods on control rosettes. Identified areas are compared on a leaf among the three automatic methods as an example. A white background (a-c) and a black background (d-f) are used for comparison. Damaged areas are identified by Ilastik in black (a, d). Red colour identifies damaged tissue by Assess (b, e) and by CompuEye (c, f). Black scale bar indicates 1 mm
Fig. 11
Fig. 11
Analysis of the overestimation phenomenon that occurs in the Photoshop method. A random region of a rosette processed by the standard method (a) is zoomed (b). Healthy tissue can be seen, as indicated by black arrows (c), inside the squares assumed by the method to be filled by chlorotic tissue. Black scale bar indicates 1 cm. The sides of the squares on b and c are 0.25 mm

Similar articles

Cited by

References

    1. Grbic M, Van Leeuwen T, Clark RM, Rombauts S, Rouze P, Grbic V, et al. The genome of Tetranychus urticae reveals herbivorous pest adaptations. Nature. 2011;479:487–492. - PMC - PubMed
    1. Luedeling E, Steinmann KP, Zhang M, Brown PH, Grant J, Girvetz EH, et al. Climate change effects on walnut pests in California. Glob Chang Biol. 2011;17:228–238.
    1. Van Leeuwen T, Dermauw W. The molecular evolution of xenobiotic metabolism and resistance in Chelicerate mites. Annu Rev Entomol. 2016;61:475–498. - PubMed
    1. Park YL, Lee JH. Leaf cell and tissue damage of cucumber caused by two spotted spider mite (Acari: Tetranychidae) J Econ Entomol. 2002;95:952–957. - PubMed
    1. Farouk S, Osman MA. The effect of plant defence elicitors on common bean (Phaseolus vulgaris L.) growth and yield in absence or presence of spider mite (Tetranychus urticae Koch) infestation. J Stress Physiol Biochem. 2011;7:5–22.

LinkOut - more resources