. 2020 Aug 27;20(1):814.
doi: 10.1186/s12885-020-07216-2.

Comprehensive analysis of prognostic tumor microenvironment-related genes in osteosarcoma patients

Affiliations

Comprehensive analysis of prognostic tumor microenvironment-related genes in osteosarcoma patients

Chuan Hu et al. BMC Cancer. .

Abstract

Background: Tumor microenvironment (TME) plays an important role in malignant tumors. Our study aimed to investigate the effect of the TME and related genes in osteosarcoma patients.

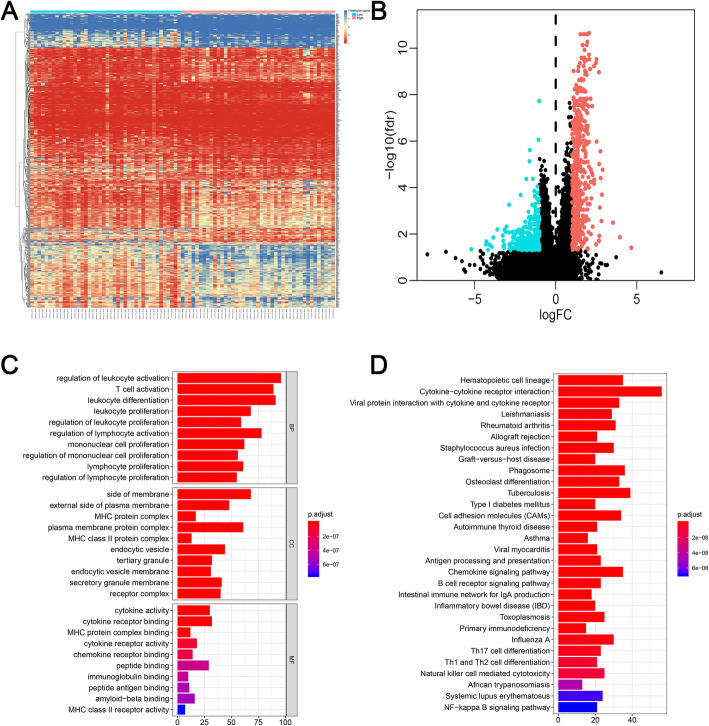
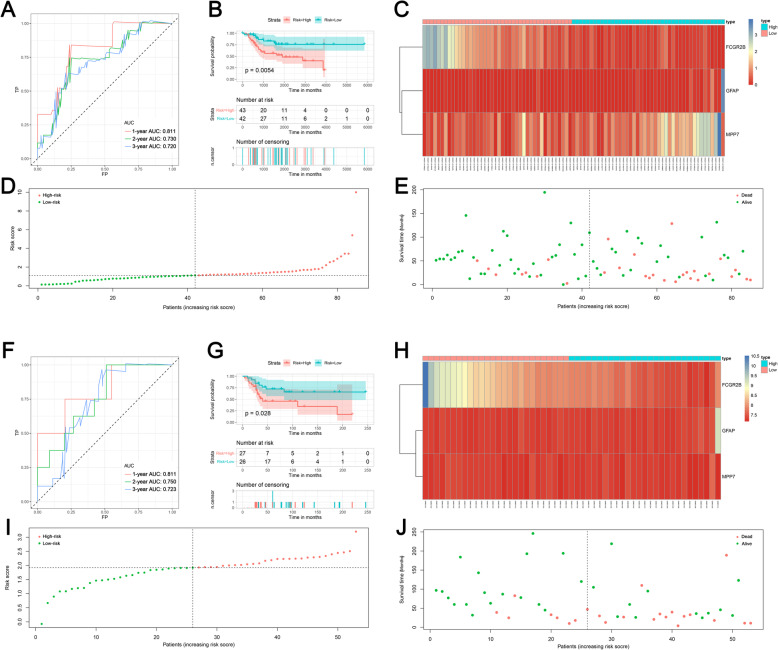
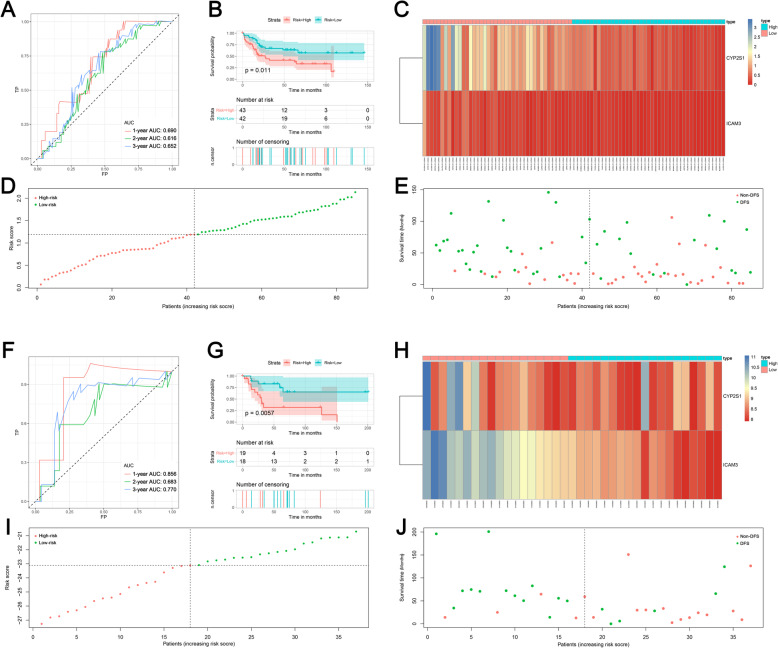
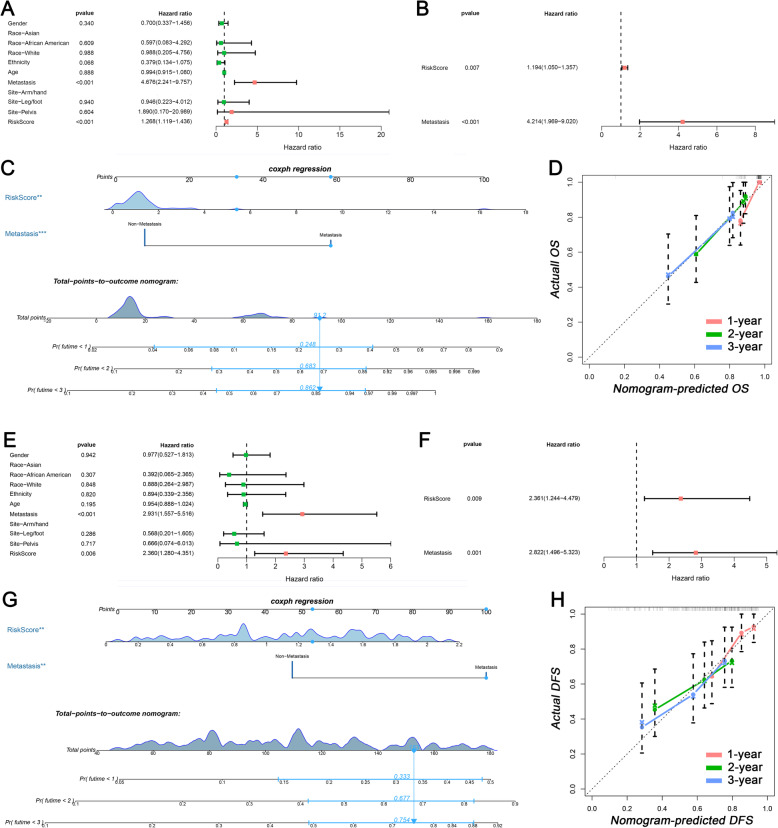
Methods: Gene expression profiles and clinical data of osteosarcoma patients were downloaded from the TARGET dataset. ESTIMATE algorithm was used to quantify the immune score. Then, the association between immune score and prognosis was studied. Afterward, a differential analysis was performed based on the high- and low-immune scores to determine TME-related genes. Additionally, Cox analyses were performed to construct two prognostic signatures for overall survival (OS) and disease-free survival (DFS), respectively. Two datasets obtained from the GEO database were used to validate signatures.

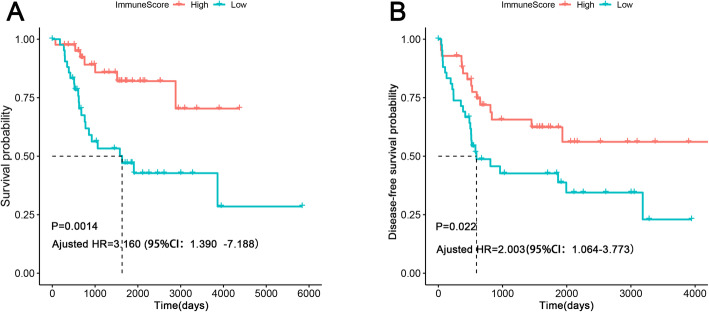
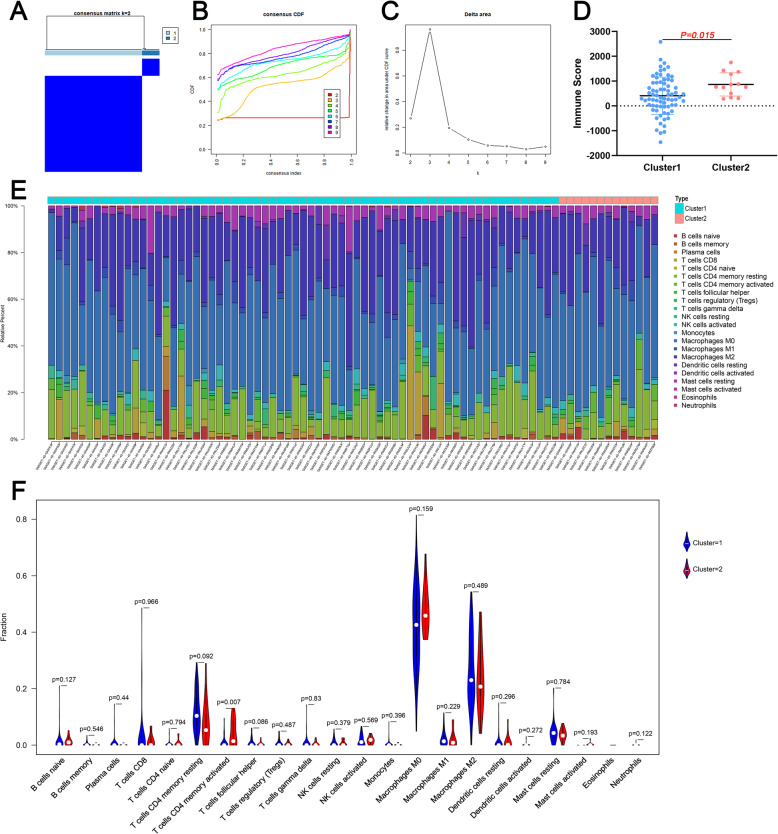
Results: Eighty-five patients were included in our research. The survival analysis indicated that patients with higher immune score have a favorable OS and DFS. Moreover, 769 genes were determined as TME-related genes. The unsupervised clustering analysis revealed two clusters were significantly related to immune score and T cells CD4 memory fraction. In addition, two signatures were generated based on three and two TME-related genes, respectively. Both two signatures can significantly divide patients into low- and high-risk groups and were validated in two GEO datasets. Afterward, the risk score and metastatic status were identified as independent prognostic factors for both OS and DFS and two nomograms were generated. The C-indexes of OS nomogram and DFS nomogram were 0.791 and 0.711, respectively.

Conclusion: TME was associated with the prognosis of osteosarcoma patients. Prognostic models based on TME-related genes can effectively predict OS and DFS of osteosarcoma patients.

Keywords: Immune features; Nomogram; Osteosarcoma; Prognosis; Tumor microenvironment.


Conflict of interest statement

The authors declare that they have no competing interests.

Figures

Fig. 1
Fig. 1
Association between immune score and prognosis in osteosarcoma patients. a Kaplan-Meier survival analysis of overall survival for patients with high vs. low immune score; b Kaplan-Meier survival analysis of disease-free survival for patients with high vs. low immune score
Fig. 2
Fig. 2
Differentially expressed genes with the immune score in osteosarcoma patients. a Heatmap of significantly differentially expressed genes based on immune score; b The volcano figure to show the upregulated and downregulated genes. c GO analysis of differentially expressed genes. d KEGG of differentially expressed genes. GO: Gene Ontology; KEGG: Kyoto Encyclopedia of Genes and Genomes
Fig. 3
Fig. 3
The immune landscape of the tumor microenvironment. a-c Unsupervised clustering of all samples based on the overlapping DEGs; d Comparison of immune score between two clusters; e The distribution of 22 types of immune cells in osteosarcoma patients; f The comparison of 22 types of immune cells between clusters. DEG: Differentially expressed gene
Fig. 4
Fig. 4
Establishment and validation of the prognostic model for overall survival based on significant DEGs; a Receiver operating characteristic curves of prognostic signature in the training cohort; b The survival curve showed the different overall survival status between high- and low-risk patients. c The heat map showed the expression of prognostic genes in the training cohort. d The risk curve of each sample reordered by risk score; e The scatter plot showed the overall survival status of osteosarcoma patients in the training cohort; f Receiver operating characteristic curves of prognostic signature in validation cohort; g The survival curve showed the different overall survival status between high- and low-risk patients. h The heat map showed the expression of prognostic genes in the validation cohort. i The risk curve of each sample reordered by risk score; j The scatter plot showed the overall survival status of osteosarcoma patients in the validation cohort
Fig. 5
Fig. 5
Establishment and validation of the prognostic model for disease-free survival based on significant DEGs; a Receiver operating characteristic curves of prognostic signature in the training cohort; b The survival curve showed the different disease-free status between high- and low-risk patients. c The heat map showed the expression of prognostic genes in the training cohort. d The risk curve of each sample reordered by risk score; e The scatter plot showed the disease-free status of osteosarcoma patients in the training cohort; f Receiver operating characteristic curves of prognostic signature in validation cohort; g The survival curve showed the different disease-free status between high- and low-risk patients. h The heat map showed the expression of prognostic genes in the validation cohort. i The risk curve of each sample reordered by risk score; j The scatter plot showed the disease-free status of osteosarcoma patients in the validation cohort
Fig. 6
Fig. 6
Nomograms based on the tumor microenvironment related genes for osteosarcoma patients. a Univariate COX analysis of overall survival-related variables; b Multivariate COX analysis of overall survival-related variables; c Nomogram for predicting the overall survival in osteosarcoma patients; d1-, 2-, and 3-year calibration curveS of overall survival nomogram; e Univariate COX analysis of disease-free survival-related variables; f Multivariate COX analysis of disease-free survival-related variables; g Nomogram for predicting the disease-free survival in osteosarcoma patients; h1-, 2-, and 3-year calibration curveS of disease-free survival nomogram

Similar articles

Cited by

References

    1. Jaffe N, Bruland OS, Bielack S. Pediatric and adolescent osteosarcoma, vol. 152. New York: Springer Science & Business Media; 2010.
    1. Vander RG. Osteosarcoma and its variants. Orthopedic Clin North Am. 1996;27(3):575–581. - PubMed
    1. Biermann JS, Adkins D, Benjamin R, Brigman B, Chow W, Conrad EU, 3rd, Frassica D, Frassica FJ, George S, Healey JH, et al. Bone cancer. J Natl Compr Cancer Netw. 2007;5(4):420–437. - PubMed
    1. Simpson S, Dunning MD, de Brot S, Grau-Roma L, Mongan NP, Rutland CS. Comparative review of human and canine osteosarcoma: morphology, epidemiology, prognosis, treatment and genetics. Acta Vet Scand. 2017;59(1):71. - PMC - PubMed
    1. Chen X, Cates JM, Du Y-C, Jain A, Jung SY, Li X-N, Hicks JM, Man TK. Mislocalized cytoplasmic p27 activates PAK1-mediated metastasis and is a prognostic factor in osteosarcoma. Mol Oncol. 2020;14(4):846–864. - PMC - PubMed

MeSH terms