Observational Study
. 2020 Aug 27;20(1):818.
doi: 10.1186/s12885-020-07290-6.

Characterization of longitudinal transformation of T2-hyperintensity in oligodendroglioma

Affiliations
Observational Study

Characterization of longitudinal transformation of T2-hyperintensity in oligodendroglioma

Dieter H Heiland et al. BMC Cancer. .

Abstract

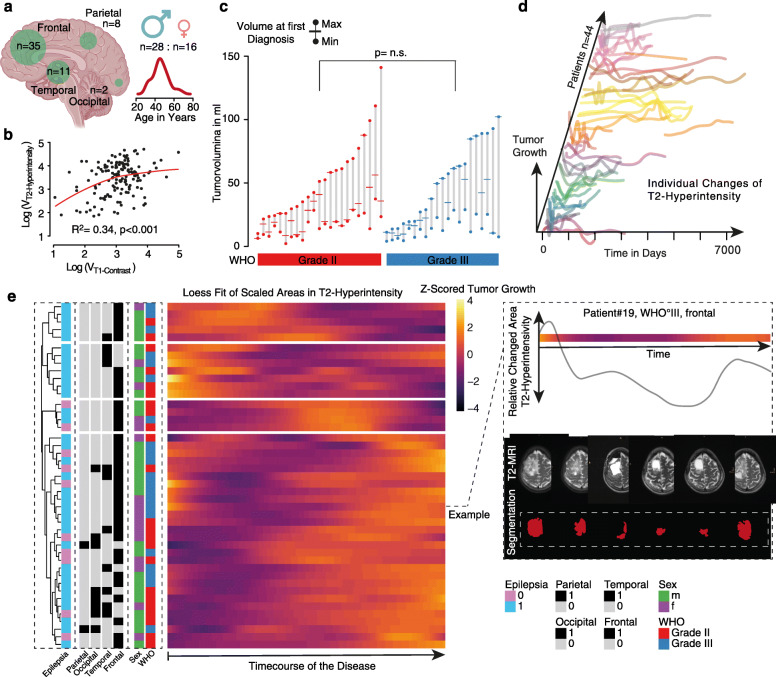
Background: Oligodendroglioma (ODG) are CNS resistant tumors characterized by their unique molecular signature, namely a combined deletion of 1p and 19q simultaneously to an IDH1/2 mutation. These tumors have a more favorable clinical outcome compared to other gliomas and a long-time survival that ranges between 10 and 20 years. However, during the course of the disease, multiple recurrences occur and the optimal treatment at each stage of the disease remains unclear. Here we report a retrospective longitudinal observation study of 836 MRI examinations in 44 ODG patients.

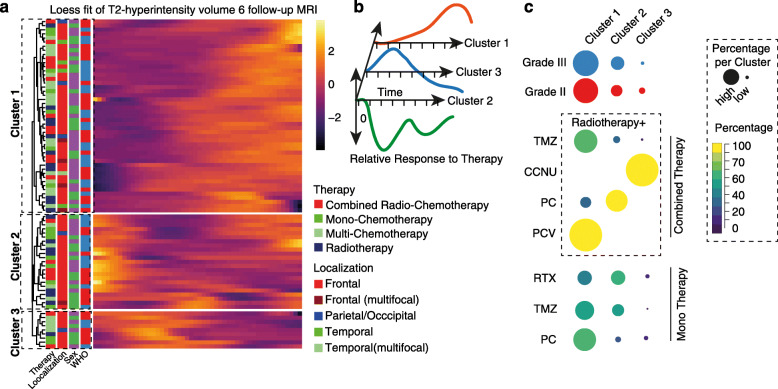
Methods: We quantified the volume of T2-hyperintensity to compute growth behavior in dependence of different treatment modalities, using various computational models.

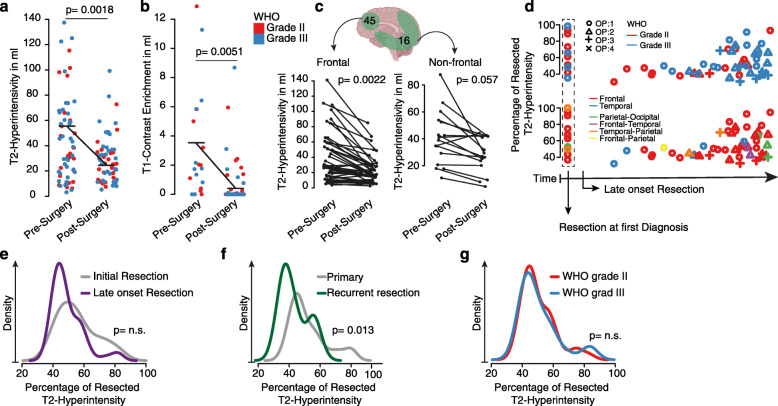
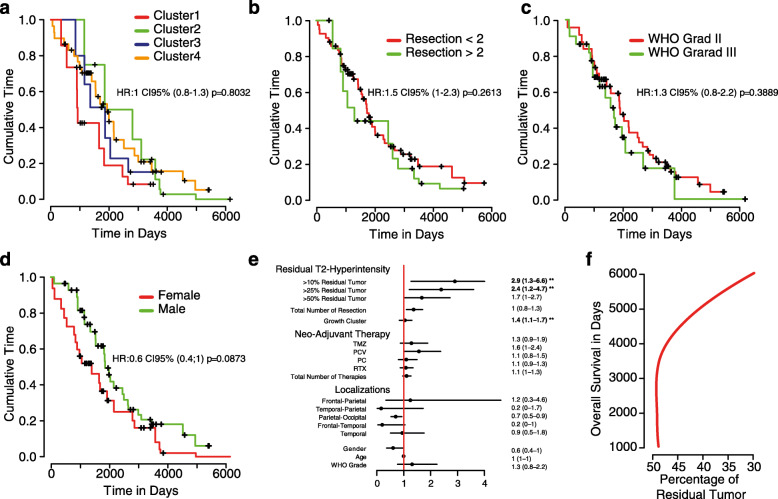
Results: The identified growth pattern revealed dynamic changes, which were found to be patient-specific an did not correlate with clinical parameter or therapeutic interventions. Further, we showed that, surgical resection is beneficial for overall survival regardless the WHO grad or timepoint of surgery. To improve overall survival, an extent of resection above 50% is required. Multiple resections do not generally improve overall survival, except a greater extent of resection than in previous surgeries was achieved.

Conclusions: Our data aids to improve the interpretation of MRI images in clinical practice.

Keywords: MR-imaging; Oligodendroglioma; Segmentation.


Conflict of interest statement

No potential conflicts of interest were disclosed by the authors.

Figures

Fig. 1
Fig. 1
a Overview of major characteristics of the cohort, distribution of age, gender and tumor localization (b) A scatter plot indicate the correlation between T1 contrast enriched volume and T2-hyperintensity volume. c A waterfall plot illustrates the minimal and maximal volume (T2-hyperintensity) and the volume at first diagnosis, colors indicate the determined WHO grade. d Line plots show individual growth curves based on T2-hyperintensity changes over the course of the disease. Each patient is colored differently. Time marked the individual course of the disease, Timpoint:0; Day of initial diagnosis. e Heatmap of loess fitted growth curved (Time ~ T2-hyperintensity changes), darker colors show less growth, brighter colors indicate timepoints of increased growing. At the left side, clinical characteristics are aligned to each patient (as rows). On the right side, an example of one patient was shown in order to improve understanding of the heatmap, including the heatmap, growth curve and corresponding T2-MRI images. At the right bottom, the color code for clinical parameters is given
Fig. 2
Fig. 2
a Scatter plot of T2-hyperintensity volume. b Scatter plot of T1-contrast enrichment volume pre- and postsurgery of ODG. Colors indicate the WHO grade and black lines illustrate median difference between pre- and postsurgery. Significance was tested by Wilcoxon Rank Sum test. c Connected lines illustrate the difference between pre- and postsurgery volume in frontal (n = 45) surgeries and non-frontal (n = 16) surgeries, significance was tested by Wilcoxon Rank Sum test. d Scatter plot of time-dependent (x-axis) differences of extent of resection (y-axis percentage of resected tumor). Shapes indicate the number of surgeries and colors indicate WHO grade (upper plot) or localizations (bottom plot). e Density of percentage of resection (x-axis) between initial or late onset resection as indicated by the colors. f Density of percentage of resection (x-axis) between primary and recurrent tumor as indicated by the colors. g Density of percentage of resection (x-axis) between WHO grade II and III as indicated by the colors
Fig. 3
Fig. 3
a Heatmap of loess fitted growth curve of a 2 years interval after initiation of radio- or chemotherapies (Time ~ T2-hyperintensity changes), darker colors show less growth, brighter colors indicate timepoints of increased growing. At the left side, clinical characteristics are aligned to each therapy (as rows). At the right bottom, the color code for clinical parameters is given. b) Mean fitted curve of patients with similar growth behavior merged into cluster 1–3. c) Percentage of therapies or clinical features in each cluster, illustrated as dots (colored according to percentage) with size according to percentage, larger dots indicate higher percentage
Fig. 4
Fig. 4
a-d Survival curves based on Kaplan-Meier statistics for growth pattern of T2-Hyperintensity clusters (a) number of resections (b), WHO grade (c) and Gender (d). e Cox-Regression of multiple clinical features, *p < 0.05, **p < 0.01, (f) Loess model of overall survival ~percentage of residual tumor

References

    1. Ho VKY, Reijneveld JC, Enting RH, Bienfait HP, Robe P, Baumert BG, et al. Changing incidence and improved survival of gliomas. Eur J Cancer. 2014;50:2309–2318. doi: 10.1016/j.ejca.2014.05.019. - DOI - PubMed
    1. Simonetti G, Gaviani P, Botturi A, Innocenti A, Lamperti E, Silvani A. Clinical management of grade III oligodendroglioma. Cancer Manag Res. 2015;7:213–223. doi: 10.2147/CMAR.S56975. - DOI - PMC - PubMed
    1. Louis DN, Perry A, Reifenberger G, von Deimling A, Figarella-Branger D, Cavenee WK, et al. The 2016 World Health Organization classification of tumors of the central nervous system: a summary. Acta Neuropathol. 2016;131:803–820. doi: 10.1007/s00401-016-1545-1. - DOI - PubMed
    1. Halani SH, Yousefi S, Velazquez Vega J, Rossi MR, Zhao Z, Amrollahi F, et al. Multi-faceted computational assessment of risk and progression in oligodendroglioma implicates NOTCH and PI3K pathways. npj Precision Onc. 2018;2:24. doi: 10.1038/s41698-018-0067-9. - DOI - PMC - PubMed
    1. van den Bent MJ, Brandes AA, Taphoorn MJB, Kros JM, Kouwenhoven MCM, Delattre J-Y, et al. Adjuvant procarbazine, lomustine, and vincristine chemotherapy in newly diagnosed anaplastic oligodendroglioma: long-term follow-up of EORTC brain tumor group study 26951. J Clin Oncol. 2013;31:344–350. doi: 10.1200/JCO.2012.43.2229. - DOI - PubMed

Publication types

MeSH terms