. 2020 Aug 27;18(1):106.
doi: 10.1186/s12915-020-00828-x.

Nutritional status impacts dengue virus infection in mice

Affiliations

Nutritional status impacts dengue virus infection in mice

Christina Chuong et al. BMC Biol. .

Abstract

Background: Dengue virus (DENV) is estimated to infect 390 million people annually. However, few host factors that alter disease severity are known. Malnutrition, defined as both over- and undernutrition, is a growing problem worldwide and has long been linked to dengue disease severity by epidemiological and anecdotal observations. Accordingly, we sought to establish a mouse model to assess the impact of nutritional status on DENV disease severity.

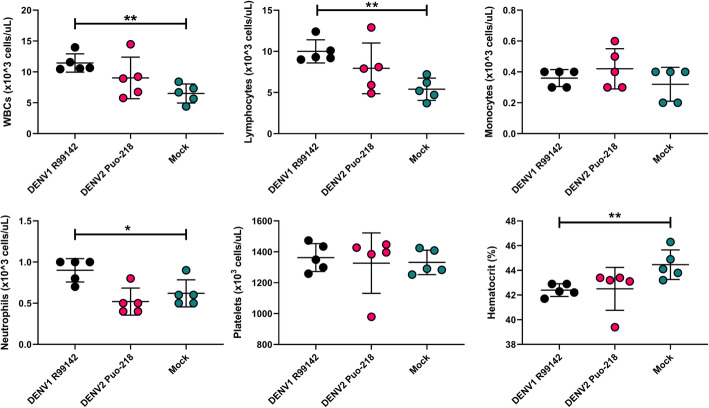
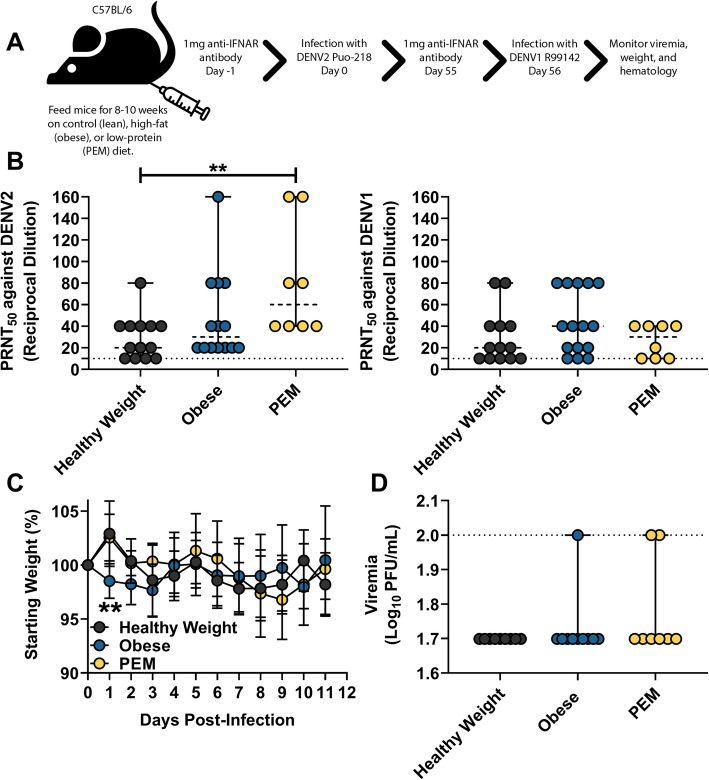
Results: Using transiently immunocompromised mice, we established a model of mild dengue disease with measurable viremia. We then applied it to study the effects of healthy weight, obese, and low-protein diets representing normal, over-, and undernutrition, respectively. Upon infection with DENV serotype 2, obese mice experienced more severe morbidity in the form of weight loss and thrombocytopenia compared to healthy weight groups. Additionally, obesity altered cytokine expression following DENV infection. Although low protein-fed mice did not lose significant weight after DENV2 infection, they also experienced a reduction in platelets as well as increased spleen pathology and viral titers.

Conclusions: Our results indicate that obese or undernourished mice incur greater disease severity after DENV infection. These studies establish a role for nutritional status in DENV disease severity.

Keywords: Arbovirus; Dengue virus; Disease severity; Malnutrition; Nutrition; Nutritional immunology.


Conflict of interest statement

The authors declare that they have no competing interests.

Figures

Fig. 1
Fig. 1
Dengue virus (DENV) replication in wild-type immunocompetent mice treated with interferon receptor blocking antibody. a Four-week- or 10-week-old female C57BL/6 J mice were treated with 1 mg of antibody to block interferon receptor signaling (IFNAR blocking antibody) and then infected with either DENV1 R99142, DENV2 NGC, or DENV2 Puo-218. b Percent weight loss throughout the study following infection. c Viremia following infection as determined by plaque assay in Vero cells. Values are means ± SD from groups of 5–10 animals, except for the mock, which had 2 animals. The studies in 4-week-old mice were repeated only once. The studies in 10-week-old mice were repeated twice, except for the DENV2 NGC groups, which was performed once. Data from the two biological replicates were combined for the 10-week-old mice. No statistical comparisons were made. The dotted line represents the limit of detection (LOD); all negative samples were given a value of 0.5 × LOD for statistical purposes
Fig. 2
Fig. 2
Hematological changes following dengue virus infection. Ten-week-old female C57BL/6 J mice were treated with 1 mg of antibody to block interferon receptor signaling (IFNAR blocking antibody) and then infected with DENV1 R99142 or DENV2 Puo-218. Hematological analysis was performed 7 days post-infection. Values are means ± SD from groups of 5 animals. Statistical comparisons were made to the mock group using one-way ANOVA with Dunnett’s comparison. *p < 0.05 and **p < 0.01. Studies were performed in one biological replicate
Fig. 3
Fig. 3
Protection mediated by a prior dengue virus infection on a heterologous or homologous challenge. a Six-week-old female C57BL/6 J mice were treated with 1 mg of antibody to block interferon receptor signaling (IFNAR blocking antibody) and then infected with DENV1 R99142 or DENV2 Puo-218. b Neutralizing antibodies measured by 50% plaque reduction neutralization test (PRNT50) against DENV2 Puo-218. Values are means ± SD from groups of 10 animals. ce Fifty-five days later, mice were again treated with 1 mg of IFNAR blocking antibody and then infected with DENV2 NGC. c Percent weight loss throughout the study following infection. d Viremia 2 days following infection as determined by plaque assay in Vero cells. e Hematological analysis was performed 7 days post-infection. Values are means ± SD from groups of 5–10 animals. Statistical comparisons were made using a one-way ANOVA with Dunnett’s comparison for all panels except c, which was made to the mock group using a repeated measures mixed-effects model analysis with Dunnett’s correction. *p < 0.05, **p < 0.01, ****p < 0.0001. Studies were performed in one biological replicate, except for b, which was performed in two independent biological replicates. The dotted line represents the limit of detection (LOD); all negative samples were given a value of 0.5 × LOD for statistical purposes
Fig. 4
Fig. 4
Nutritional status alters dengue virus (DENV) infection. a Six-week-old female C57BL/6 J mice were fed for 8–10 weeks on a control (healthy weight), high-fat (obese), or low-protein (protein-energy malnutrition, PEM) diet and then treated with 1 mg of antibody to block interferon receptor signaling (IFNAR blocking antibody). The next day, mice were infected with DENV2 Puo-218. b Percent weight loss throughout the study following infection. c Viremia following infection as determined by plaque assay in Vero cells. The dotted line represents the limit of detection (2.1 Log10 PFU/mL); all points below this line represent samples with no plaques, which we gave an arbitrary value of half of the limit of detection (1.8 Log10 PFU/mL). d Levels of platelets 7 days post-infection. Values are means ± SD from groups of 7–19 animals combined from 2 to 3 independent biological replicates, except for the pre-infection platelet levels, which were measured only once. Statistical comparisons were made to the healthy weight group using a repeated measures mixed-effects model analysis with Dunnett’s correction. *p < 0.05, **p < 0.01
Fig. 5
Fig. 5
Histopathology following infection with dengue virus (DENV) in mice with varying nutritional status. Six-week-old female C57BL/6 J mice were fed for 8–10 weeks on a control (healthy weight), high-fat (obese), or low-protein (protein-energy malnutrition, PEM) diet and then treated with 1 mg of antibody to block interferon receptor signaling (IFNAR blocking antibody). The next day, mice were infected with DENV2 Puo-218. a Histology scores from the spleen and liver collected 2 days post-infection. Values are presented as medians with the minimum and maximum of the range from groups of four animals. Statistical comparisons were made using the Kruskal-Wallis test with Dunn’s multiple comparisons test. *p < 0.05 and **p < 0.01. b Representative images of the liver and spleen collected before and after infection with DENV2. Black-filled arrows represent areas of inflammation. Black and white arrows represent areas of lipidosis. Scale bar, 100 μM. Data presented are from one biological replicate
Fig. 6
Fig. 6
The influence of nutritional status on a secondary dengue virus (DENV) infection with another serotype. a Six-week-old female C57BL/6 J mice were fed for 8–10 weeks on a control (healthy weight), high-fat (obese), or low-protein (protein-energy malnutrition, PEM) diet and then treated with 1 mg of antibody to block interferon receptor signaling (IFNAR blocking antibody). The next day, mice were infected with DENV2 Puo-218. Values are means ± SD from groups of 8–10 animals from two biological replicates. b Neutralizing antibodies measured by 50% plaque reduction neutralization test (PRNT50) against DENV2 Puo-218 and DENV1 R99142. Values are means ± SD from groups of 8–14 animals. c, d Fifty-five days later, mice were again treated with 1 mg of IFNAR blocking antibody and then infected with DENV1 R99142. c Percent weight loss throughout the study following infection. Statistical comparisons were made to the healthy weight group using a repeated measures mixed-effects model analysis with Dunnett’s correction. Values are means ± SD. d Viremia following infection as determined by plaque assay in Vero cells. For b and d, values are presented as medians with the minimum and maximum of the range and statistical comparisons were made against the healthy weight group using the Kruskal-Wallis test with Dunn’s multiple comparisons test. **p < 0.01. The dotted line represents the limit of detection (LOD); all negative samples were given a value of 0.5 × LOD for statistical purposes

References

    1. Bhatt S, Gething PW, Brady OJ, Messina JP, Farlow AW, Moyes CL, et al. The global distribution and burden of dengue. Nature. 2013;496:504–507. - PMC - PubMed
    1. Sangkawibha N, Rojanasuphot S, Ahandrik S, Viriyapongse S, Jatanasen S, Salitul V, et al. Risk factors in dengue shock syndrome: a prospective epidemiologic study in Rayong, Thailand. I. The 1980 outbreak. Am J Epidemiol. 1984;120:653–669. - PubMed
    1. Kouri GP, Guzmán MG, Bravo JR, Triana C. Dengue haemorrhagic fever/dengue shock syndrome: lessons from the Cuban epidemic, 1981. Bull World Health Organ. 1989;67:375–380. - PMC - PubMed
    1. Burke DS, Nisalak A, Johnson DE, Scott RM. A prospective study of dengue infections in Bangkok. Am J Trop Med Hyg. 1988;38:172–180. - PubMed
    1. Obesity and overweight. https://www.who.int/news-room/fact-sheets/detail/obesity-and-overweight. Accessed 25 Mar 2019.

Publication types