. 2020 Aug 27;27(1):90.
doi: 10.1186/s12929-020-00683-6.

Clinically relevant radioresistant rhabdomyosarcoma cell lines: functional, molecular and immune-related characterization

Affiliations

Clinically relevant radioresistant rhabdomyosarcoma cell lines: functional, molecular and immune-related characterization

Francesco Petragnano et al. J Biomed Sci. .

Abstract

Background: The probability of local tumor control after radiotherapy (RT) remains still miserably poor in pediatric rhabdomyosarcoma (RMS). Thus, understanding the molecular mechanisms responsible of tumor relapse is essential to identify personalized RT-based strategies. Contrary to what has been done so far, a correct characterization of cellular radioresistance should be performed comparing radioresistant and radiosensitive cells with the same isogenic background.

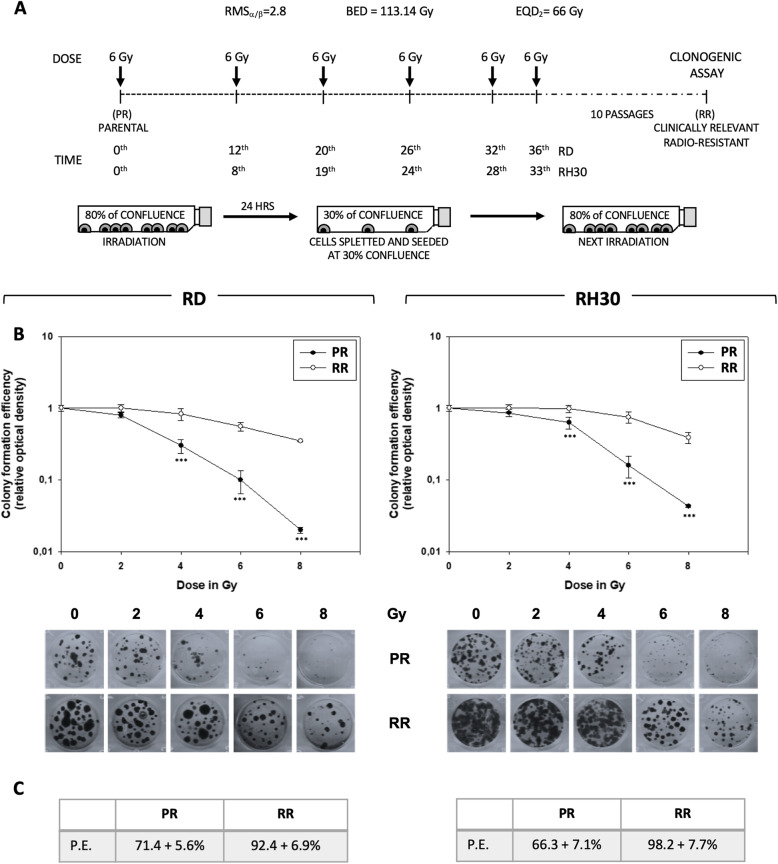
Methods: Clinically relevant radioresistant (RR) embryonal (RD) and alveolar (RH30) RMS cell lines have been developed by irradiating them with clinical-like hypo-fractionated schedule. RMS-RR cells were compared to parental isogenic counterpart (RMS-PR) and studied following the radiobiological concept of the "6Rs", which stand for repair, redistribution, repopulation, reoxygenation, intrinsic radioresistance and radio-immuno-biology.

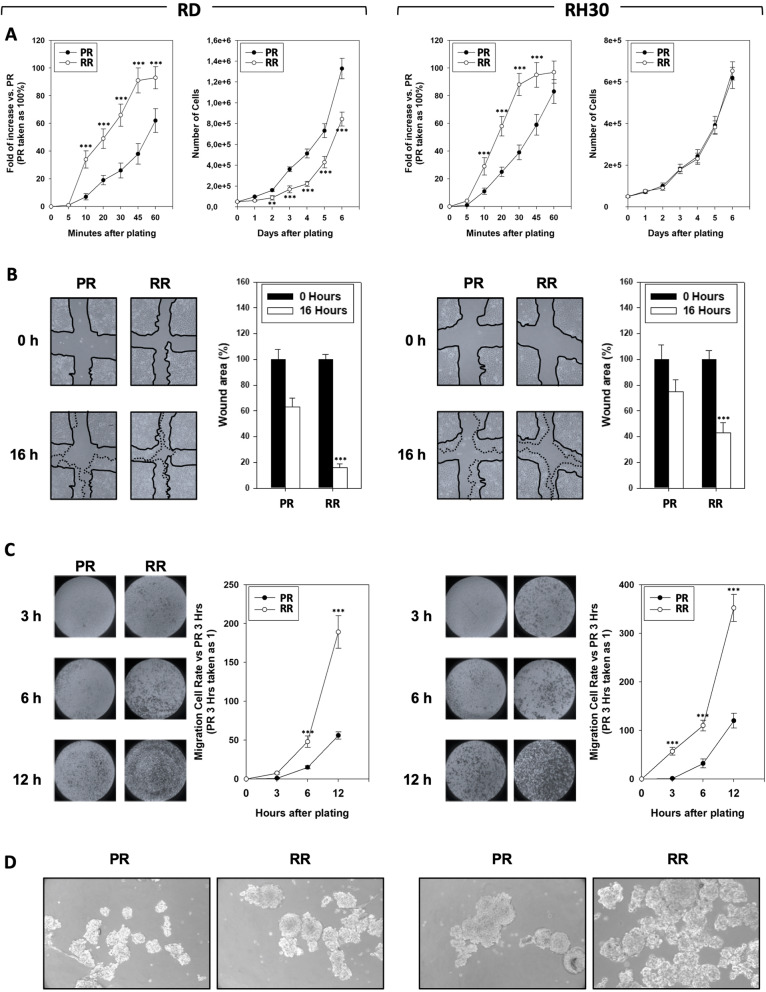
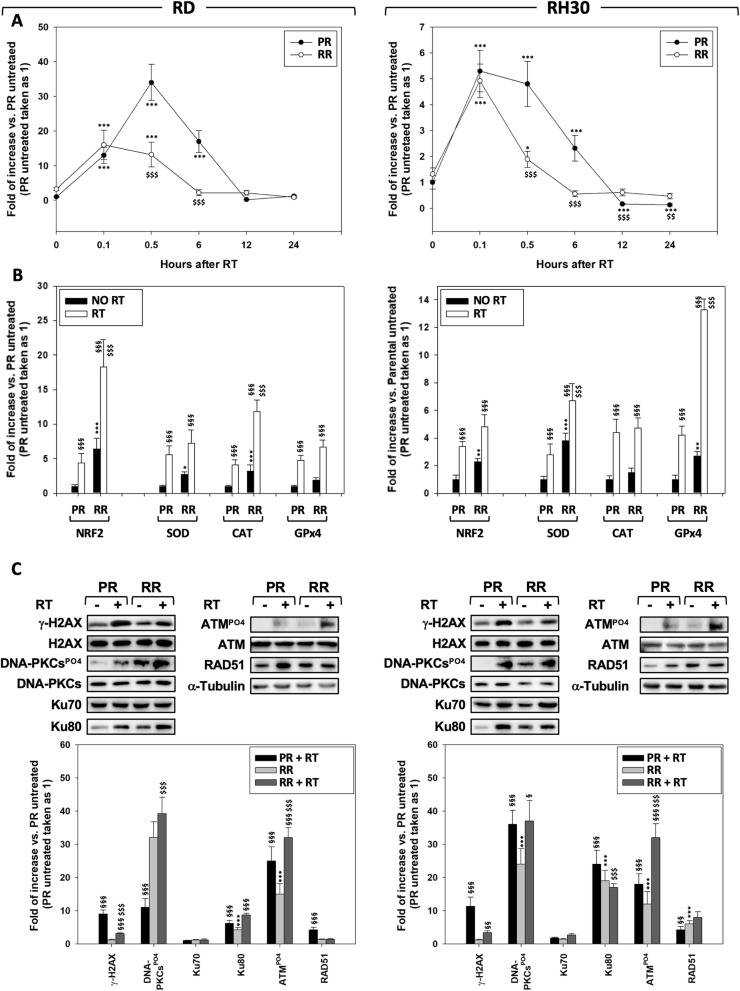
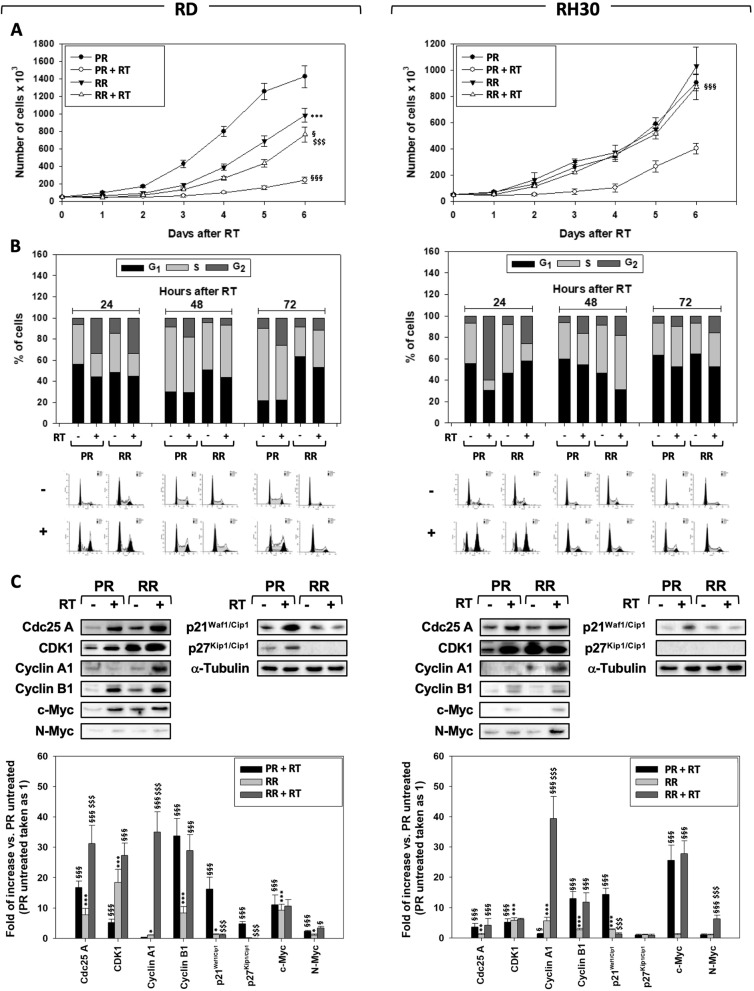
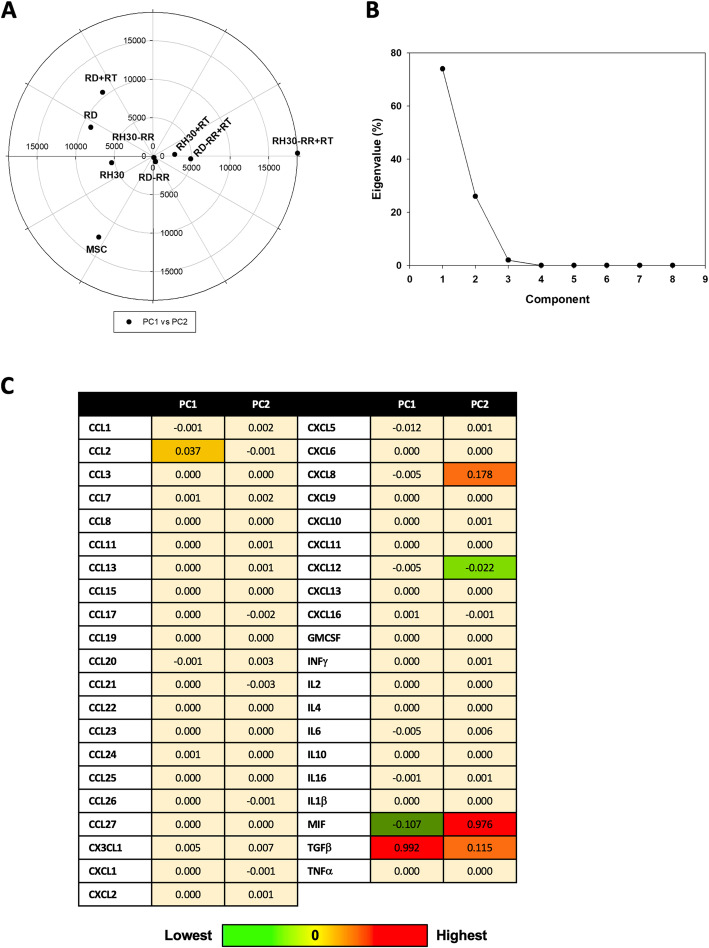
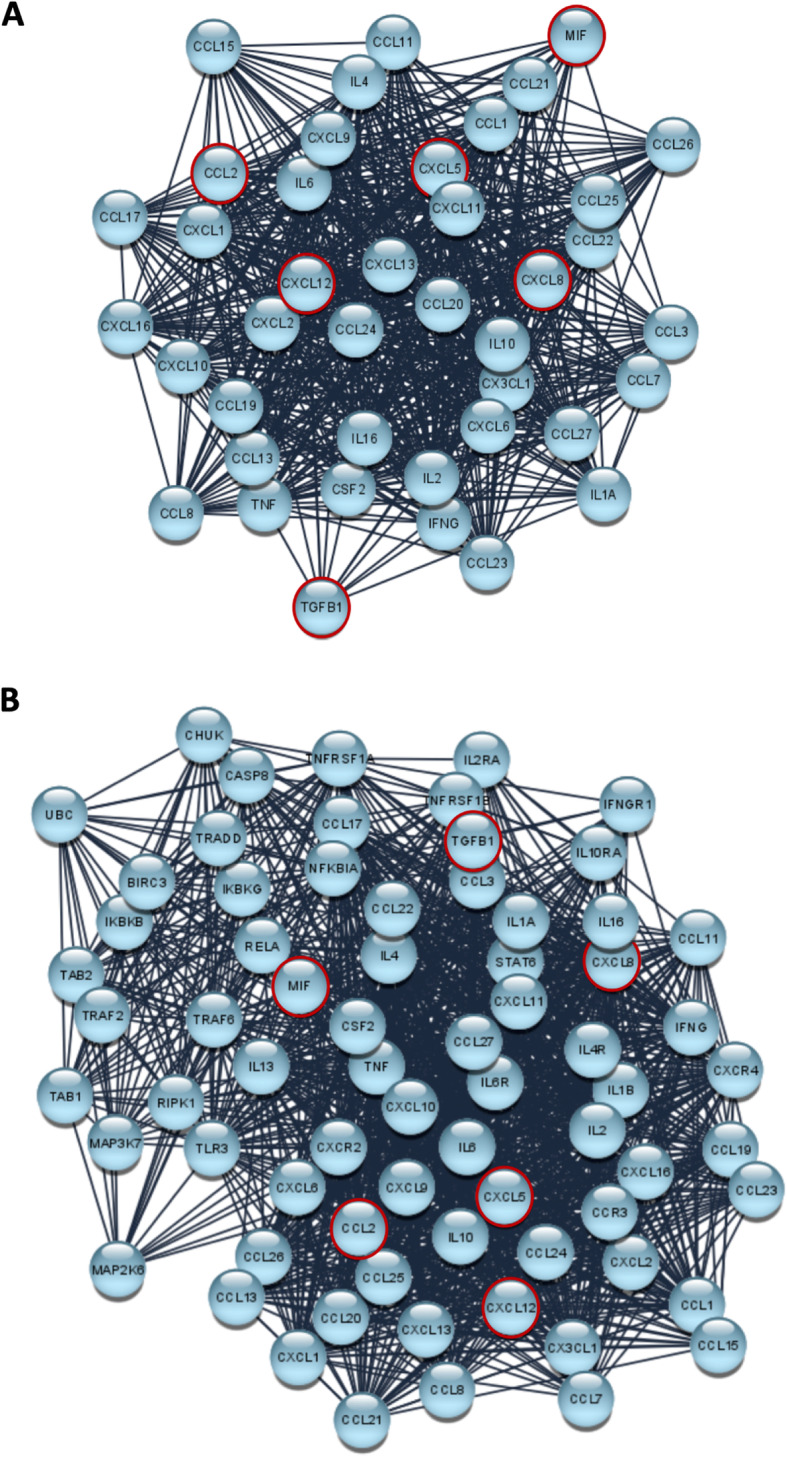
Results: RMS-RR cell lines, characterized by a more aggressive and in vitro pro-metastatic phenotype, showed a higher ability to i) detoxify from reactive oxygen species; ii) repair DNA damage by differently activating non-homologous end joining and homologous recombination pathways; iii) counteract RT-induced G2/M cell cycle arrest by re-starting growth and repopulating after irradiation; iv) express cancer stem-like profile. Bioinformatic analyses, performed to assess the role of 41 cytokines after RT exposure and their network interactions, suggested TGF-β, MIF, CCL2, CXCL5, CXCL8 and CXCL12 as master regulators of cancer immune escape in RMS tumors.

Conclusions: These results suggest that RMS could sustain intrinsic and acquire radioresistance by different mechanisms and indicate potential targets for future combined radiosensitizing strategies.

Keywords: Immunoescape; Radiobiology; Radioresistance; Radiotherapy; Rhabdomyosarcoma.


Conflict of interest statement

The authors declare no competing interests.

Figures

Fig. 1
Fig. 1
Development of clinically relevant radio-resistant cell line. a Representation of the radiation schedule used and the related radiobiological parameters. Growing RD and RH30 cells at 80% of confluence were irradiated with the dose of 6 Gy. 24 h after irradiation, 30% of irradiated cells were re-seeded and the next irradiation repeated when a confluence of 80% was reached again, this for 6 times to get a final equivalent dose (EQD2) to that reached with conventional fractionation of 66 Gy into daily dose of 2 Gy. b Upper Panel. Clonogenic assay of the parental (PR) and clinically relevant (RR) RD (Left Panel) and RH30 (Right Panel) lines with increasing dose of irradiation (2, 4, 6, 8 Gy). Data are expressed as relative optical density vs. non-irradiated cells, taken as 1. Representative crystal violet stained cultures 14 days after irradiation. c Percent of plating efficiency. Results represent the mean values of four independent experiments ± SD. Statistical significance: *p ≤ 0.05, **p ≤ 0.01, ***p ≤ 0.001 compared RMS-PR vs. RMS-RR
Fig. 2
Fig. 2
Onco-phenotype characterization of clinically relevant radio-resistant cell line. a Panels show the ability of RMS-PR and -RR to attach and spread (Left Panel) and proliferate (Right Panel) on a fibronectin coated plate. Data of attachment assay are expressed as fold of increase vs. non-irradiated cells, taken as 1. b Wound healing experiments in RMS-PR and RMS-RR cells. A scratch was made at time 0 and maintained or not for 16 h. The dotted lines represent the edges of the wound. Photographs (Left Panel) were taken under light microscope (10x magnification). The migration index was plotted in bar graphs as the % of wound area (Right Panel). c Matrigel invasion assay. Cells were allowed to invade for 24 h in serum-free medium. Pictures shown are the most representative from three independent experiments. The graph represents absorbance at 595 nm after incubation of the membranes with deoxycholic acid. Results represent the mean values of four independent experiments ± SD. Statistical significance: *p ≤ 0.05, **p ≤ 0.01, ***p ≤ 0.001 compared RMS-RR vs. RMS-PR. d Representative microphotographs of RMS-PR and RMS-RR cells after 14 days of incubation in stem cell medium
Fig. 3
Fig. 3
RMS-PR and -RR cells differently trigger anti-oxidant and DNA repair responsiveness after irradiation. a Mitochondrial superoxide anion production was assessed by MitoSox Red staining, 10 min (0.1), 30 min (0.5), 12 or 24 h after RT in RMS-PR and RMS-RR cells. b Gene expression of antioxidant enzymes nuclear factor erythroid 2-related factor (NRF2), superoxide dismutase (SOD-2), catalase (CAT) and glutathione peroxidase (GPx)-4 was investigated by real-time PCR, 12 h after RT. The gene expression was referenced to the ratio of the value of interest and basal conditions. The value of basal conditions was reported equal to 1. c Cell lysates from RMS-PR and RMS-RR cells untreated (−) or treated (+) with 6 Gy of irradiation collected 12 h after RT, were analyzed by immunoblotting with specific antibodies for indicated proteins; α-Tubulin expression shows the loading of samples. Western blot showed are representative of three different experiments. Statistical analyses: *p < 0.05, **p < 0.01, ***p < 0.001 RMS-RR NO RT vs. RMS-PR NO RT, §p < 0.05, §§p < 0.01, §§§p < 0.001 RMS-PR RT vs. RMS-PR NO RT and RMS-RR RT vs. RMS-RR NO RT, $p < 0.05, $$p < 0.01, $$$p < 0.001 RMS-RR RT vs. RMS-PR RT.
Fig. 4
Fig. 4
Irradiation differently changes cell cycle distribution in RMS-PR and -RR cells. a Effect of irradiation with 6 Gy on cell number of RMS-PR and RMS-RR. b FACS analysis performed on RMS-PR and RMS-RR cells after 24, 48 and 72 h from irradiation with 6 Gy. Representative of three different experiments. Results are representative of three different experiments performed in triplicate. c Cell lysates from RMS-PR and RMS-RR cells untreated (−) or treated (+) with 6 Gy of irradiation collected 12 h after RT, were analyzed by immunoblotting with specific antibodies for indicated proteins; α-Tubulin expression shows the loading of samples. Western blot showed are representative of three different experiments. Statistical analyses: *p < 0.05, **p < 0.01, ***p < 0.001 RMS-RR NO RT vs. RMS-PR NO RT, §p < 0.05, §§p < 0.01, §§§p < 0.001 RMS-PR RT vs. RMS-PR NO RT and RMS-RR RT vs. RMS-RR NO RT, $p < 0.05, $$p < 0.01, $$$p < 0.001 RMS-RR RT vs. RMS-PR RT.
Fig. 5
Fig. 5
Principal component analysis a) PCA analysis: scatter plot of different experimental conditions (MCS, RD, RD + RT, RH30, RH30 + RT, RD-RR, RD-RR + RT, RH30-RR, RH30-RR + RT) based on cytokines concentration. b) PCA analysis: scree plot of Principal Components: as it is evident PC1 and PC2 represent about 95% of total variance. c) PCA analysis: values of Principal Component 1 and 2 (PC1 and PC2) for the different cytokines. Color ranges from light yellow (lowest value) to red (highest value)
Fig. 6
Fig. 6
STRING analysis a) STRING analysis: CN: network representing the interaction among the examined cytokines (Cytokines Network, CN), as reported in STRING tool. The data are filtered for Homo sapiens and with a medium confidence score (0.400). The nodes and links are represented with the default layout and using the edge-weighted spring embedded layout (weighted for edge betweenness). The most relevant nodes as defined by PCA analysis are edged in red. b) STRING analysis: previous network after 4 cycles of enrichment (Enriched Cytokines Network, ECN). The nodes and links are represented with the default layout and using the edge-weighted spring embedded layout (weighted for edge betweenness). The most relevant nodes as defined by PCA analysis are edged in red

References

    1. Skapek SX, Ferrari A, Gupta AA, Lupo PJ, Butler E, Shipley J, Barr FG, Hawkins DS. Rhabdomyosarcoma. Nat Rev Dis Primers. 2019;5:1. - PMC - PubMed
    1. O'Sullivan B, Davis AM, Turcotte R, Bell R, Catton C, Chabot P, Wunder J, Kandel R, Goddard K, Sadura A, Pater J, Zee B. Preoperative versus postoperative radiotherapy in soft-tissue sarcoma of the limbs: a randomised trial. Lancet. 2002;359:2235–2241. - PubMed
    1. Sia J, Szmyd R, Hau E, Gee HE. Molecular mechanisms of radiation-induced Cancer cell death: a primer. Front Cell Dev Biol. 2020;13:41. - PMC - PubMed
    1. Golden EB, Apetoh L. Radiotherapy and immunogenic cell death. Semin Radiat Oncol. 2015;25:11–17. - PubMed
    1. Schaue D, Kachikwu EL, McBride WH. Cytokines in radiobiological responses: a review. Radiat Res. 2012;178:505–523. - PMC - PubMed

MeSH terms