. 2020 Aug 27;15(1):48.
doi: 10.1186/s13024-020-00400-9.

CNS axonal degeneration and transport deficits at the optic nerve head precede structural and functional loss of retinal ganglion cells in a mouse model of glaucoma

Affiliations

CNS axonal degeneration and transport deficits at the optic nerve head precede structural and functional loss of retinal ganglion cells in a mouse model of glaucoma

Prabhavathi Maddineni et al. Mol Neurodegener. .

Abstract

Background: Glaucoma is a leading neurodegenerative disease affecting over 70 million individuals worldwide. Early pathological events of axonal degeneration and retinopathy in response to elevated intraocular pressure (IOP) are limited and not well-defined due to the lack of appropriate animal models that faithfully replicate all the phenotypes of primary open angle glaucoma (POAG), the most common form of glaucoma. Glucocorticoid (GC)-induced ocular hypertension (OHT) and its associated iatrogenic open-angle glaucoma share many features with POAG. Here, we characterized a novel mouse model of GC-induced OHT for glaucomatous neurodegeneration and further explored early pathological events of axonal degeneration in response to elevated IOP.

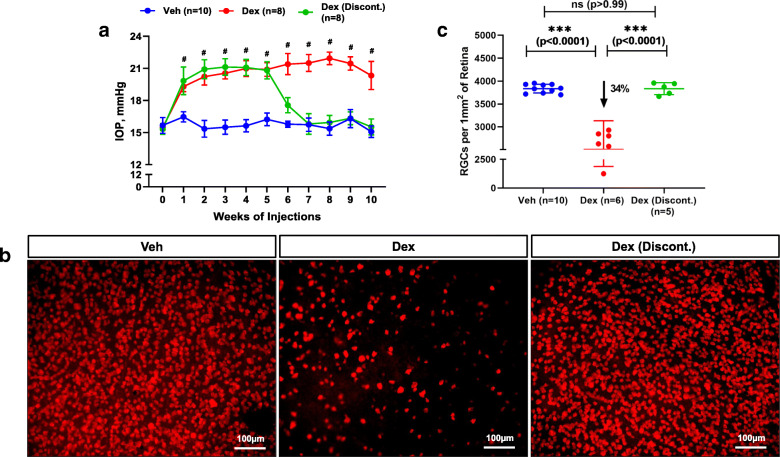
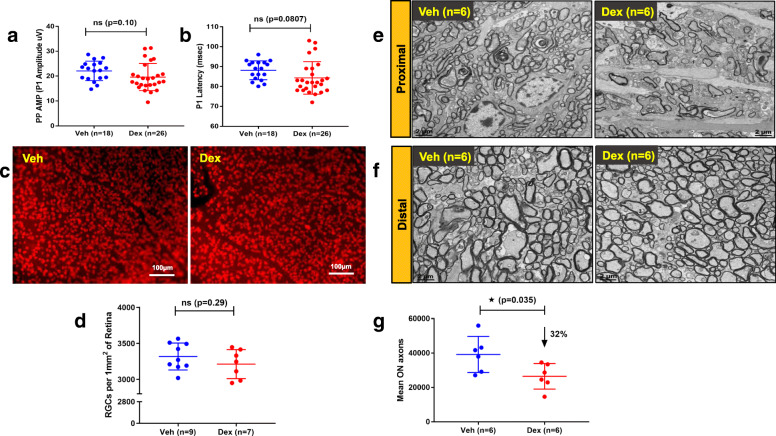
Methods: C57BL/6 J mice were periocularly injected with either vehicle or the potent GC, dexamethasone 21-acetate (Dex) once a week for 10 weeks. Glaucoma phenotypes including IOP, outflow facility, structural and functional loss of retinal ganglion cells (RGCs), optic nerve (ON) degeneration, gliosis, and anterograde axonal transport deficits were examined at various stages of OHT.

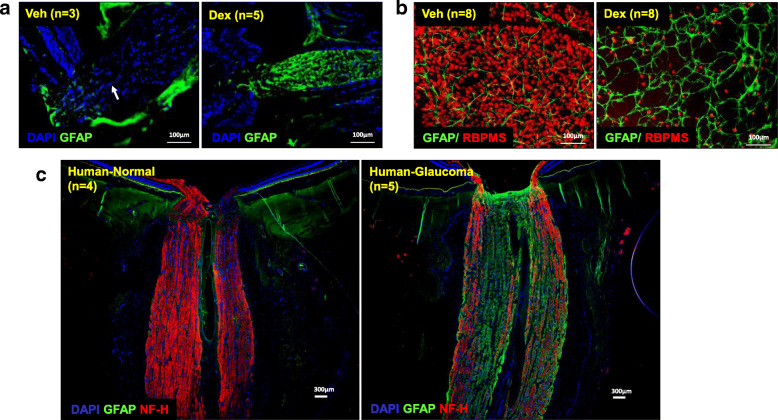
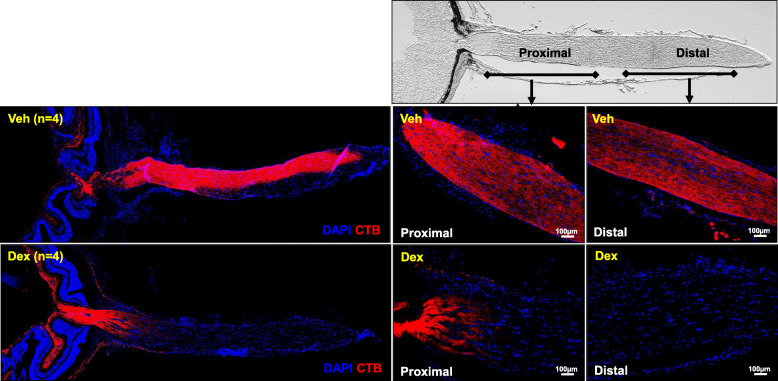
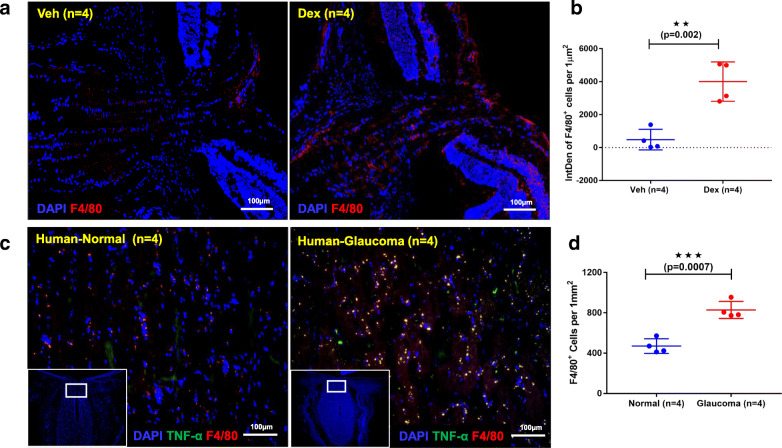
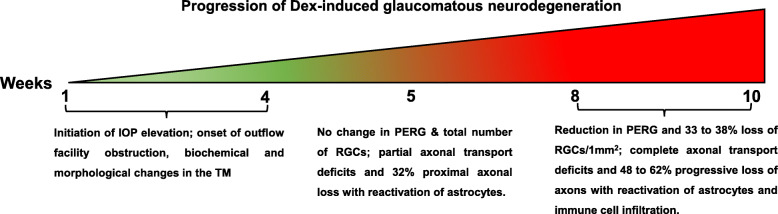
Results: Prolonged treatment with Dex leads to glaucoma in mice similar to POAG patients including IOP elevation due to reduced outflow facility and dysfunction of trabecular meshwork, progressive ON degeneration and structural and functional loss of RGCs. Lowering of IOP rescued Dex-induced ON degeneration and RGC loss, suggesting that glaucomatous neurodegeneration is IOP dependent. Also, Dex-induced neurodegeneration was associated with activation of astrocytes, axonal transport deficits, ON demyelination, mitochondrial accumulation and immune cell infiltration in the optic nerve head (ONH) region. Our studies further show that ON degeneration precedes structural and functional loss of RGCs in Dex-treated mice. Axonal damage and transport deficits initiate at the ONH and progress toward the distal end of ON and target regions in the brain (i.e. superior colliculus). Most of anterograde transport was preserved during initial stages of axonal degeneration (30% loss) and complete transport deficits were only observed at the ONH during later stages of severe axonal degeneration (50% loss).

Conclusions: These findings indicate that ON degeneration and transport deficits at the ONH precede RGC structural and functional loss and provide a new potential therapeutic window for rescuing neuronal loss and restoring health of damaged axons in glaucoma.

Keywords: And optic nerve head axonal degeneration; Anterograde transport deficits; Glucocorticoid-induced glaucoma; Intraocular pressure; Mouse model of glaucoma; Neurodegeneration; Ocular hypertension; Optic nerve degeneration; POAG; Retinal ganglion cell loss; Trabecular meshwork.


Conflict of interest statement

Authors declare no conflict of interest.

Figures

Fig. 1
Fig. 1
Periocular administration of Dex leads to elevated IOP, reduced aqueous humor outflow facility and increased ECM deposition in mouse TM tissue. a C57BL/6 J mice were periocularly injected with either Veh or Dex in both eyes once a week for 10 weeks, and IOPs were monitored weekly. Dex injections lead to sustained and significant IOP elevation. Data are shown as mean ± SD (n = 10 in each group, 2-WAY ANOVA with multiple comparison, ***p = 0.0005, #p < 0.0001). b Age matched C57BL/6 J mice were injected bilaterally once a week for 4 weeks with either Veh or Dex, and outflow facility was measured using constant flow infusion method. A significant reduction (~ 37.8%) in outflow facility was observed in 4 weeks post Dex-injected mice compared to Veh-injected mice (n = 8 in each group, unpaired t-test, two tailed, mean ± SD, *p = 0.027). c Anterior segment tissues after 10 weeks of Veh (left panel) and Dex (right panel) injected mice were immunostained with ECM markers including fibronectin (FN), collagen I (ColI) and laminin along with α-smooth muscle actin (SMA) or phalloidin. Iridocorneal angles are represented by a rectangle white box in each representative image. Increased deposition of ECM proteins and actin was observed in TM tissues of Dex-injected eyes compared to Veh-injected eyes (n = 4 or 6; TM, trabecular meshwork; CB, ciliary body)
Fig. 2
Fig. 2
Dex-induced OHT leads to functional and structural loss of RGCs in mice. C57BL/6 J mice were periocularly injected with Veh or Dex for 10 weeks and RGC functional loss was examined by PERG. Representative wave graphs are shown for Veh (a) and Dex (b) injected mice. PERG amplitude (c) and latency (d) demonstrated a significant functional loss of RGCs in Dex-injected mice as evident from reduced amplitudes with increased latencies. Data are shown as mean ± SD (n = 18 in Veh and n = 22 in Dex, unpaired t-test, two tailed, ***p < 0.0001). e Representative images of immunostaining of whole mount retina with RGC specific marker, RBPMS in periphery, mid-periphery and center of retinas of 10 weeks post Veh or Dex-injected mice. A significant loss of RGCs (33% loss) is observed in Dex-injected mice (f). Data are shown as mean ± SD (n = 22 in Veh and n = 18 in Dex, unpaired t-test, two tailed, **p = 0.004, ***p < 0.0001)
Fig. 3
Fig. 3
Dex-induced OHT leads to optic nerve axonal degeneration in mice. Optic nerves from 10-week Veh or Dex-injected mice were subjected to PPD staining (a & b) and TEM imaging (C) to examine optic nerve degeneration. a Representative images of PPD stained optic nerves show severe axonal degeneration along with gliosis and glial scar in 10 weeks Dex-injected mice compared to Veh-injected mice. b The mean axon counts in 10 weeks Dex-injected mice show a significant reduction in number of healthy axons compared to Veh-injected mice. Data are shown as mean ± SD (n = 5 in Veh and n = 4 in Dex, unpaired t-test, two-tailed, ***p = 0.0004). c TEM images confirm extensive glial scar and degenerated axons in Dex-injected mice compared to Veh-injected mice. In addition, we observed unmyelinated axons, vacuoles, infiltrating immune cells that were associated with optic nerve degeneration in Dex-injected mice compared to Veh-injected mice (n = 4). (* unmyelinated axons; # glial scar; vacuoles; infiltrating immune cells)
Fig. 4
Fig. 4
Dex-induced glaucomatous neurodegeneration is IOP dependent. Three-month old C57BL/6 J mice were injected bilaterally once a week for 8 weeks with either Veh or Dex, and given topical ocular eye drops of either control (water) or Cosopt (b.i.d) + Latanoprost (once a day) for 8 weeks. a Dex injected mice receiving control eye drops (DexControl) show sustained and significant IOP elevation compared to Veh injected mice receiving control eye drops (VehControl), IOP is significantly reduced in Dex-injected mice receiving Cosopt+Latanoprost eye drops (DexCosopt + Latanoprost) compared to DexControl mice. Data are shown as mean ± SD (n = 8 to 10 in each group, 2-WAY ANOVA with multiple comparison, #p < 0.0001). b Reduction of IOP prevents Dex-induced RGC functional loss. PERG was measured in mice treated with periocular injections of Veh or Dex along with or without topical ocular eye drops of Cosopt+Latanoprost. DexControl mice demonstrate significant reduction in PERG amplitudes compared to VehControl or DexCosopt + Latanoprost mice. There is no difference in PERG amplitudes between VehControl and DexCosopt + Latanoprost mice. Data are shown as mean ± SD (n = 8 to 10 in each group, One WAY ANOVA with multiple comparison). c Reduction of IOP prevents Dex-induced RGC structural loss. Representative images of whole mount retina immunostained with RBPMS and corresponding RGC counts are shown. There is a significant reduction in RGC numbers in DexControl mice compared to VehControl mice, whereas DexCosopt + Latanoprost mice did not show RGC loss compared to VehControl mice. Data are shown as mean ± SD (n = 4 or 5, One WAY ANOVA with multiple comparison, ***p < 0.0001). d Reduction of IOP prevents Dex-induced optic nerve degeneration. PPD stained optic nerve axons were counted and total number of axons per optic nerve are represented in a dot plot. DexControl mice showed significant axonal degeneration compared to VehControl mice, and axonal degeneration was prevented in DexCosopt + Latanoprost mice. Data are shown as mean ± SD (n = 4, One WAY ANOVA with multiple comparison, *p = 0.01)
Fig. 5
Fig. 5
Withdrawal of Dex results in IOP reduction and prevents Dex-induced RGC loss. Three-month old C57BL/6 J mice were injected bilaterally once a week for 5-weeks with either Veh or Dex. Dex-treated mice were randomly divided in two groups. Dex treatment was withdrawn in one group while another group continued to receive Dex for additional 5 weeks. a Weekly IOP measurements revealed sustained and significant IOP elevation in Dex-injected mice compared to Veh-injected mice. Withdrawal of Dex injections caused significant reduction of elevated IOP in Dex discontinued group. Data are shown as mean ± SD (n = 8 to 10 in each group, 2-WAY ANOVA with multiple comparison, #p < 0.0001). b Representative RBPMS stained whole mount retinal images and c total RGC quantitation revealed a significant loss of RGCs in 10 weeks Dex-injected mice while no RGC loss was observed in Dex discontinued mice compared to Veh injected mice. Data are shown as mean ± SD (n = 10 in Veh, n = 6 in Dex and n = 5 in Dex discontinued group, One WAY ANOVA with multiple comparison, *p = 0.03, ***p < 0.0001)
Fig. 6
Fig. 6
Sustained Dex-induced IOP elevation causes robust activation of astrocytes in ONH, ON and retina. Longitudinal sections of optic nerves (a) and whole mount retinas (b) were collected from 10 weeks post Veh or Dex-injected mice, and immunostained for reactive astrocytes with GFAP (green). a Hypertrophic reactive astrocytes with increased expression of GFAP were observed in ONH cross sections in 10 weeks Dex-injected mice (n = 5) compared to Veh-injected mice (n = 3). b Immunostaining of whole mount retinas with GFAP (green) and RBPMS (red) show relatively higher number reactive astrocytes and decreased RGCs in 10 weeks Dex-injected mice compared to Veh-injected mice (n = 8). c For comparisons, longitudinal sections of aged-matched human normal and glaucomatous optic nerves were immunostained with antibodies specific for GFAP and neurofilament-heavy chain (NF-H) (red). Loss of NF-H with increased GFAP expressing reactive astrocytes are observed throughout the length of human glaucomatous optic nerve compared to aged-matched normal human optic nerve. In addition, there is a robust activation of astrocytes in human glaucomatous ONH (n = 5) compared to normal ONH (n = 4)
Fig. 7
Fig. 7
Dex-induced OHT leads to axonal transport deficits in mice. C57BL/6 J mice treated with Veh and Dex for 10 weeks and injected intravitreally with red fluorescently tagged CTB dye (Alexa fluor 555). The proximal (close to ONH) and distal (close to optic chiasm) regions of optic nerve are marked in DIC image of optic nerve on the upper panel. Veh-injected mice showed an uninterrupted axoplasmic anterograde transportation of CTB along the entire length of optic nerve including both proximal and distal regions. However, CTB transport was blocked completely at ONH and no CTB was detected in distal region of optic nerve (n = 4)
Fig. 8
Fig. 8
Glaucomatous neurodegeneration is associated with activation of F4/80 positive macrophage-like cells. a&b 10 weeks Veh and Dex-injected eyes are enucleated, sectioned through ONH and analyzed for F4/80 positive cells by immunostaining. The corresponding images from 10 weeks post Dex-injected eyes showed an increased number of F4/80 positive macrophage-like cells at ONH compared to 10 weeks Veh injected eyes (n = 4). c&d For comparisons, a similar trend is observed in the human glaucomatous ONH, where the number of F4/80 positive macrophage-like cells expressing TNF-α (green) is significantly higher in glaucomatous ONH compared to age matched normal ONH (n = 4 in normal and n = 4 in glaucoma). Data are shown as mean ± SD (unpaired t-test, two tailed, **p = 0.002, ***p = 0.0007)
Fig. 9
Fig. 9
Optic nerve degeneration precedes structural and functional loss of RGCs. Three-month old C57BL/6 J mice were injected bilaterally once a week for 5 weeks with Veh or Dex. The structural and functional loss of RGCs was analyzed by PERG and immunostaining (a-d). Optic nerve degeneration was examined via TEM and PPD staining (e-g). Dot graphs show PERG amplitudes (a) and latency (b) demonstrating no significant loss of RGC function in Dex-injected mice after 5 weeks of treatment. Data are shown as mean ± SD (n = 18 in Veh and n = 26 in Dex, unpaired t-test, ns = not statistically significant, p > 0.05). In consistence with PERG data, the flat mount retinal images stained with RBPMS (c) and the corresponding dot plots (d) showed no significant RGC loss between the 5 weeks post Veh and Dex injected mice (n = 9 in Veh and n = 7 in Dex). The data are shown as mean ± SD (unpaired t-test, two tailed, ns = not statistically significant, p > 0.05). The representative TEM images (e&f) show axonal degeneration and glial scar formation in proximal region (close to ONH) (e) and not at distal ON region of 5 weeks post Dex injected compared to Veh injected mice (n = 6) (f). The mean optic nerve axonal counts at the proximal region of optic nerves show a significant axonal loss in 5 weeks Dex-treated mice compared to control mice (g). The data are shown as mean ± SD (n = 6, unpaired t-test, two tailed, p = 0.035)
Fig. 10
Fig. 10
Anterograde transport persists during initial stages of optic nerve degeneration. Three-month old C57BL/6 J mice were injected unilaterally with Veh and Dex once a week for 5 or 8 weeks and axonal anterograde transport deficits were tracked through entire visual pathway including optic nerve and superior colliculus (SC) using fluorescently tagged CTB. CTB Alexa Fluor 555 (Red) and CTB Alexa Fluor 488 (Green) were used to tract transport deficits in Veh and Dex-injected eyes respectively. a Representative DIC images connecting eyes to the brain from 5 weeks injected mice show an active transportation of CTB in both Veh and Dex-injected eyes. b Representative DIC images show accumulation of CTB (green fluorescence) at the ONH in 8 weeks Dex-injected eyes compared to contralateral Veh-injected eyes (CTB-red fluorescence). c Serial frontal sections of brain confirm a loss of axonal transport of CTB with mild deficits in the posterior SC regions in 5 weeks Dex-injected eyes compared to contralateral Veh-injected eyes (n = 5). d Serial frontal sections of brain confirm the axonal transport deficits of CTB in SC regions corresponding to 8 weeks Dex-injected eyes compared to contralateral Veh injected eyes indicating complete axonal anterograde transport deficits during later stages of axonal damage (n = 5)
Fig. 11
Fig. 11
Partial axonal transport deficits at the ONH is associated with early stages of optic nerve degeneration in Dex-treated mice. Three months old C57BL/6 J mice were injected unilaterally with Veh and Dex once a week for 5 weeks and axonal anterograde transport was tracked along the entire length of optic nerve using fluorescently tagged CTB. CTB Alexa Fluor 555 (Red) and CTB Alexa Fluor 488 (Green) were used to tract transport deficits in Veh and Dex-injected eyes respectively n = 3. a Graphical representation of serial cross sections of optic nerve at the proximal (close to glial lamina), center and distal (close to optic chiasma) regions. b Serial cross sections of optic nerve images show partial accumulation of CTB (green fluorescence) at proximal ON region in 5 weeks Dex injected eyes compared to contralateral Veh-injected eyes (CTB-red fluorescence). c Fluorescent intensities of CTB from proximal to distal ON in 5 weeks of Veh and Dex injected mice was analyzed by Image J and shown graphically. For each optic nerve, an average of fluorescent intensities of 3 images from each region were taken into the consideration. The data are shown as mean ± SD (n = 3, One WAY ANOVA with multiple comparison; ns = not significant, *p = 0.02)
Fig. 12
Fig. 12
The schematic diagram showing the timeline of the progression of glaucomatous neurodegeneration in mouse model of Dex-induced OHT. Dex treatment leads to significant IOP elevation starting from 1 week of injection, which is associated with reduced outflow facility. These changes are associated with ECM accumulation and increased cytoskeleton proteins in the TM. About 32% ON axonal loss and activation of astrocytes in ONH was observed at 5 weeks of Dex treatment. At this stage, we did not observe functional or structural loss of RGCs. Most of the CTB transport was active at this stage. At 8 and 10 weeks of treatment, there was 48 and 62% loss of optic nerve axons respectively. At this stage, significant structural (30–40%) and functional loss of RGCs was observed. We also observed complete blockage of axoplasmic transport along with activation of astrocytes and infiltration of immune cells

Similar articles

Cited by

References

    1. Kingman S. Glaucoma is second leading cause of blindness globally. Bull World Health Organ. 2004;82(11):887–888. - PMC - PubMed
    1. Tham YC, Li X, Wong TY, Quigley HA, Aung T, Cheng CY. Global prevalence of glaucoma and projections of glaucoma burden through 2040: a systematic review and meta-analysis. Ophthalmology. 2014;121(11):2081–2090. - PubMed
    1. Quigley HA, Broman AT. The number of people with glaucoma worldwide in 2010 and 2020. Br J Ophthalmol. 2006;90(3):262–267. - PMC - PubMed
    1. Foster A, Resnikoff S. The impact of vision 2020 on global blindness. Eye (Lond) 2005;19(10):1133–1135. - PubMed
    1. Kapetanakis VV, Chan MP, Foster PJ, Cook DG, Owen CG, Rudnicka AR. Global variations and time trends in the prevalence of primary open angle glaucoma (POAG): a systematic review and meta-analysis. Br J Ophthalmol. 2016;100(1):86–93. - PMC - PubMed

Publication types