. 2021 Oct 1;106(10):2707-2719.
doi: 10.3324/haematol.2020.265462.

Fetal hemoglobin rescues ineffective erythropoiesis in sickle cell disease

Affiliations

Fetal hemoglobin rescues ineffective erythropoiesis in sickle cell disease

Sara El Hoss et al. Haematologica. .

Abstract

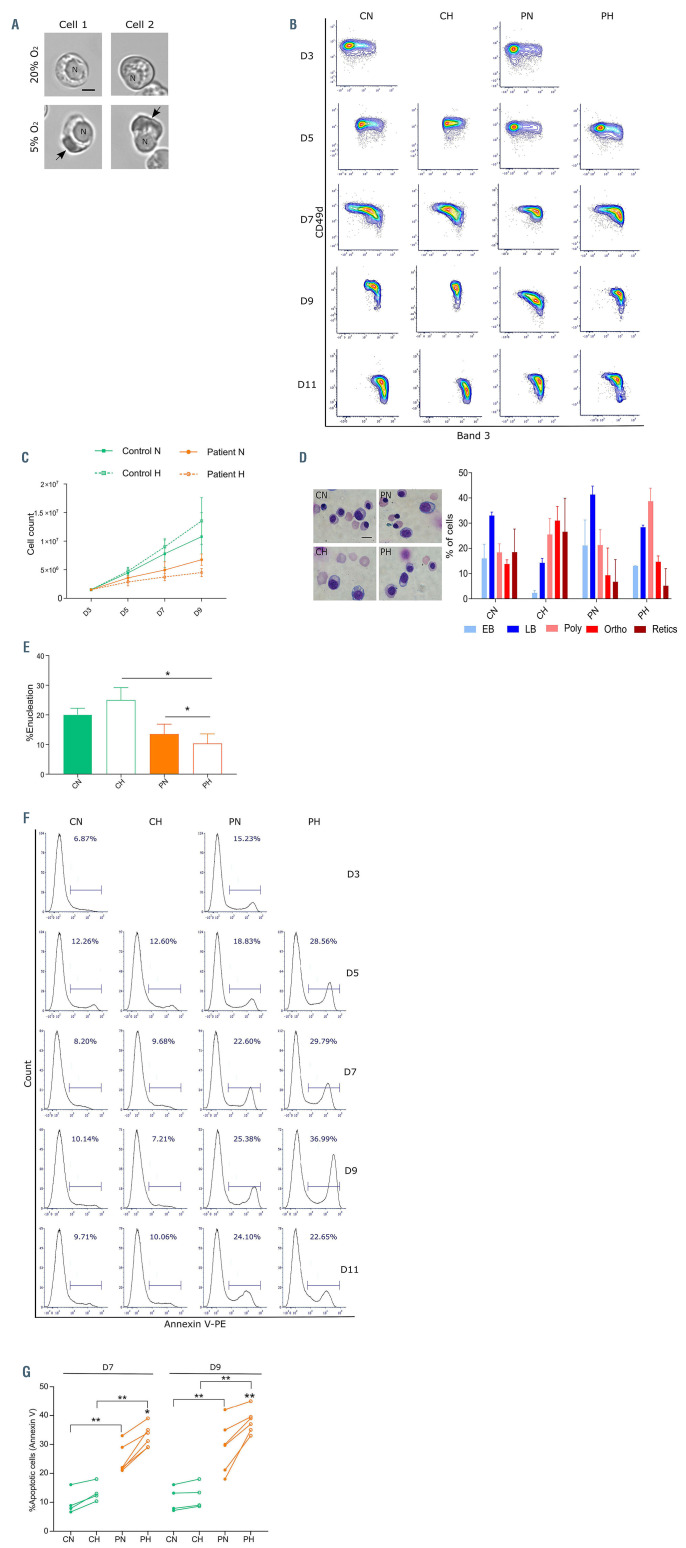
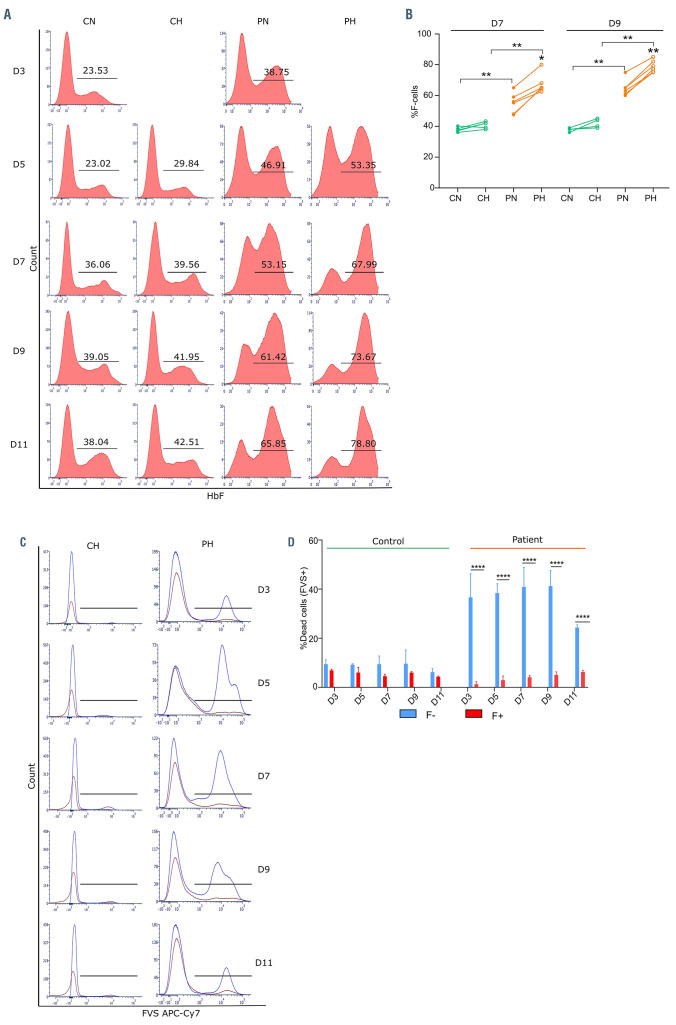
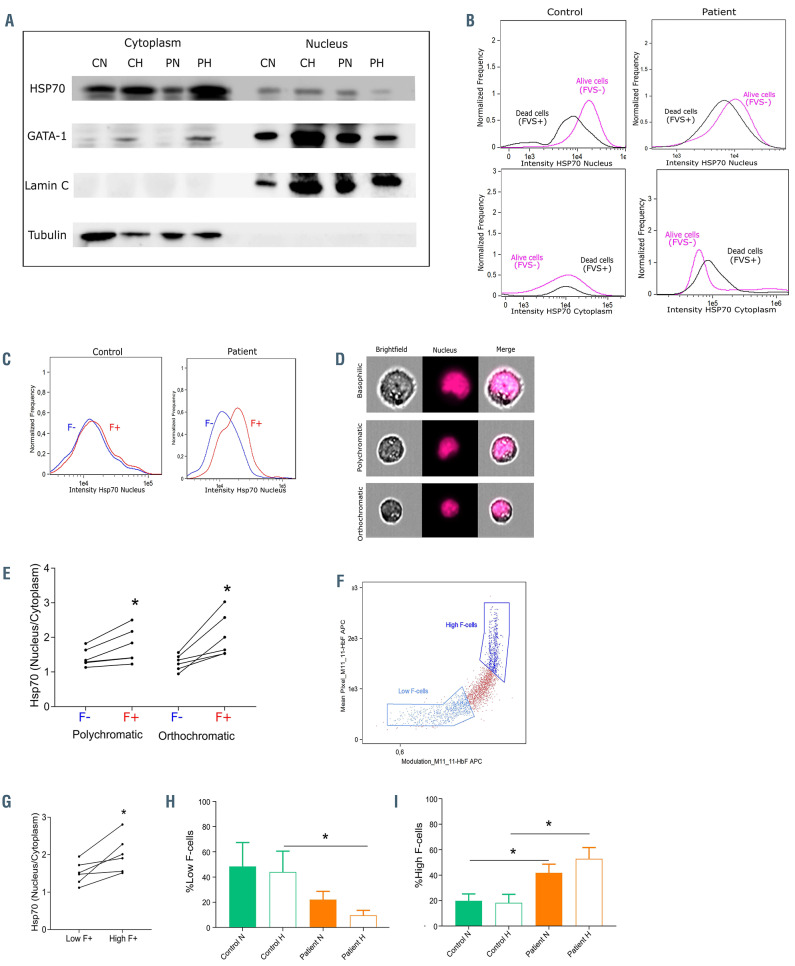
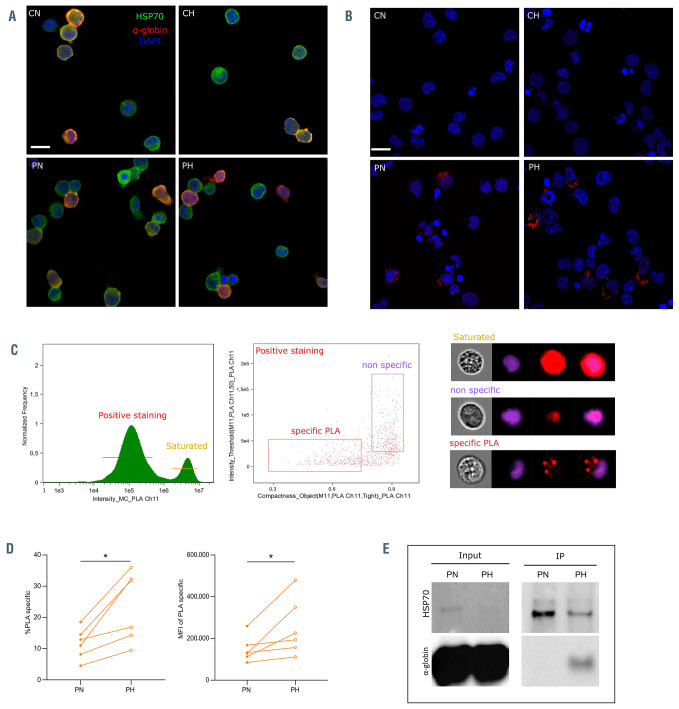
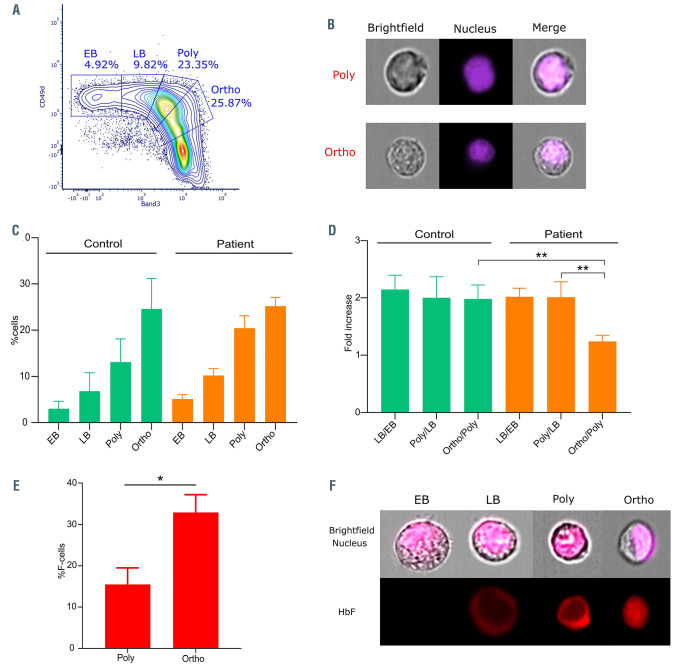
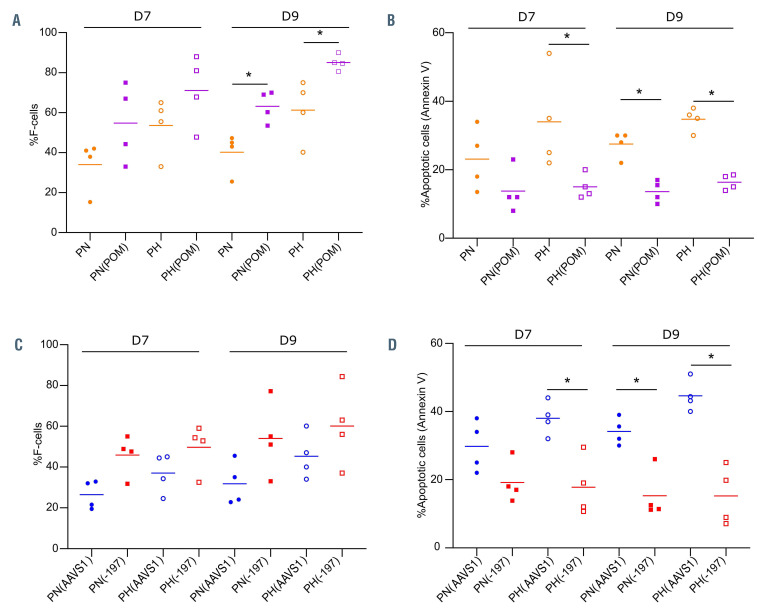
While ineffective erythropoiesis has long been recognized as a key contributor to anemia in thalassemia, its role in anemia of sickle cell disease (SCD) has not been critically explored. Using in vitro and in vivo derived human erythroblasts we assessed the extent of ineffective erythropoiesis in SCD. Modeling the bone marrow hypoxic environment, we found that hypoxia induces death of sickle erythroblasts starting at the polychromatic stage, positively selecting cells with high levels of fetal hemoglobin (HbF). Cell death was associated with cytoplasmic sequestration of heat shock protein 70 and was rescued by induction of HbF synthesis. Importantly, we document that in the bone marrow of SCD patients similar cell loss occurs during the final stages of terminal differentiation. Our study provides evidence for ineffective erythropoiesis in SCD and highlights an anti-apoptotic role for HbF during the terminal stages of erythroid differentiation. These findings imply that the beneficial effect on anemia of increased HbF levels is not only due to the increased life span of red cells but also a consequence of decreased ineffective erythropoiesis.


Figures

Figure 1.
Figure 1.
Cell proliferation and apoptosis during terminal erythroid differentiation in vitro under normoxia and partial hypoxia. (A) Microscopy images of two sickle cell disease (SCD) in vitro cultured erythroblasts incubated for 30 minutes at 20% (upper panel) and 5% (lower panel) oxygen. “N” represents the nucleus and the arrow points to the HbS polymers formed under 5% oxygen; scale bar: 5 mm. (B) A contour plot representing the distribution of glycophorin A (GPA)-positive cells with respect to the expression of Band 3 (x-axis) and CD49d (y-axis) at day (D) 3, D5, D7, D9 and D11 of phase II of culture in control erythroid precursors under normoxia (CN) or hypoxia (CH), and in patient erythroid precursors under normoxia (PN) or hypoxia (PH). (C) Cell count of erythroid precursors at D3, 5, 7 and 9 in control (n=4) and patient (n=6) under normoxia (N) and hypoxia (H) (means ± standard error of the mean [SEM]). (D) May Grunwald-Giemsa staining of erythroid precursors at D9 of phase II of culture (left panel; scale bar: 10 mm) and graph representing the cellular distribution as means ± SEM of early basophilic (EB), late basophilic (LB), polychromatic (Poly), orthochromatic (Ortho) and reticulocytes (Retics) at D9 of culture of control normoxia (CN), control hypoxia (CH), patient normoxia (PN) and patient hypoxia (PH). (E) Percentage of enucleation measured at D11 for CN, CH, PN and PH erythroblasts (means ± SEM; CN and CH: n=3; PN and PH: n=6). (F) Flow cytometry plots showing percentage of apoptotic cells (Annexin V-positive cells) measured at D3, D5, D7, D9 and D11. (G) Percentage of apoptotic cells in control (n=4) and patients (n=6) under normoxia (N) and hypoxia (H) at D7 and D9 of phase II of culture. *P<0.05, **P<0.01; Wilcoxon paired test and Mann-Whitney test (E and G).
Figure 2.
Figure 2.
Distribution of erythroid precursors expressing fetal hemoglobin in vitro. (A) Flow cytometry plots showing the percentage of cells expressing fetal hemoglobin (F-cells) at day (D) 3, D5, D7, D9 and D11 of phase II of culture in control erythroid precursors under normoxia (CN) or hypoxia (CH), and in patient erythroid precursors under normoxia (PN) or hypoxia (PH). (B) Flow cytometry plots showing dead cells, measured by fixable viability stain (FVS APC-Cy7), in non-F-cells (F-) (blue curve) and F-cells (F+) (red curve) of control (CH) and patient (PH) cells under hypoxia. (C) Percentage of F-cells measured at D7 and D9 of phase II of culture in control (n=4) and patient cells (n=6) under normoxia (N) and hypoxia (H). (D) Percentage of dead cells (means ± standard error of the mean) measured in the F- and F+ subpopulations for control and patient cells under hypoxia. *P<0.05, **P<0.01, ****P<0.0001; Wilcoxon paired test and Mann-Whitney test (C); Mann-Whitney test (D)
Figure 3.
Figure 3.
HSP70 cytoplasmic and nuclear distribution. (A) Western blot analysis of HSP70, GATA-1, lamin C and tubulin performed on cytoplasmic and nuclear extracts of erythroid precursors at day 7 (D7) of phase II of culture from control normoxia (CN), control hypoxia (CH), patient normoxia (PN) and patient hypoxia (PH). (B) Distribution of the nuclear intensity (upper panel) and cytoplasmic intensity (lower panel) of HSP70 at D7 of phase II of culture in dead cells (FVS+) and live cells (FVS-) of control and patient cells under hypoxia. (C) Distribution of the nuclear intensity of HSP70 at D7 of phase II of culture in the F- and F+ subpopulations of control (left) and patient (right) cells under hypoxia. (D) Images of basophilic, polychromatic and orthochromatic subpopulations obtained by imaging flow cytometry. (E) HSP70 nucleus/cytoplasm ratio in F- and F+ polychromatic and orthochromatic patient erythroblasts at D7 of phase II of culture (n=6). (F) Dot plot representing the modulation mask of fetal hemoglobin (HbF) (x-axis) and mean pixel HbF values (y-axis) used to discriminate between low and high F-cells. (G) HSP70 nucleus/cytoplasm ratio in low and high F-cells of patients’ orthochromatic erythroblasts at D7 of phase II of culture under hypoxia (n=6). Percentage of (H) Low Fcells and (I) High F-cells in control (n=3) and patient (n=6) cells at normoxia and hypoxia at D7 of phase II of culture (means ± standard error of the mean). *P<0.05. Wilcoxon paired test (E and G) and Mann-Whitney unpaired test (H and I). FVS: fixable viability stain; F-cells: cells expressing fetal hemoglobin.
Figure 4.
Figure 4.
HSP70 and α-globin colocalization and co-immunoprecipitation. (A) Confocal microscopy images of control erythroid precursors under normoxia (CN) or hypoxia (CH), and of patient erythroid precursors under normoxia (PN) or hypoxia (PH) at day 7 (D7) of phase II of culture showing colocalization (in yellow) of HSP70 (green) and α-globin (red); nucleus is in blue (n=3); scale bar: 10 mm. (B) Proximity ligation assay (PLA) between HSP70 and α-globin at D7 of phase II of culture. Red spots indicate proximity (<40 nm) between both proteins. Spots were observed in PN and PH cultures, while no spots were seen in CN and CH. A representative image of each culture is shown (n=3); scale bar: 10 mm. (C) (Left) A histogram representing the intensity of APC signal generated by PLA, a gating of positive staining and saturated staining is indicated. (Middle) A dot plot representing an analysis mask using the compactness feature (x-axis) and intensity feature (y-axis) to discriminate between PLA-specific staining and non-specific staining. (Right) Representative images of each gate. (D) Percentage of cells (left) and mean fluorescence intensity (right) of PLA-specific staining in erythroid precursors of patient normoxia (PN) and patient hypoxia (PH) at D9 of phase II of culture (n=6). (E) Co-immunoprecipitation assay of HSP70 with α-globin using circulating sickle cell disease (SCD) red blood cells incubated under normoxia (PN) or hypoxia (PH) for 1 hour. HSP70 and α- globin bands are detected in the lysates (left panel) and after HSP70 immunoprecipitation (right panel). *P<0.05, Wilcoxon paired test (D).
Figure 5.
Figure 5.
Analysis of human terminal erythroid differentiation in vivo. (A) A contour plot representing the distribution of glycophorin A (GPA)-positive cells with respect to Band 3 (x-axis) and CD49d (y-axis) from a bone marrow sample of a sickle cell disease (SCD) patient. (B) Images obtained using imaging flow cytometry from the gating of polychromatic (Poly) and orthochromatic (Ortho) erythroblasts. Nucleus was stained with Hoechst. (C) Percentage of cells at the early basophilic (EB), late basophilic (LB), polychromatic (Poly) and orthochromatic (Ortho) stages in five bone marrow samples of controls (green) and SCD patients (orange) (means ± standard error of the mean [SEM]). (D) The fold increase of cells between the EB and LB (LB/EB), LB and Poly (Poly/LB), Poly and Ortho (Ortho/Poly) stages in five controls and five SCD patients (means ± SEM). (E) Percentage of cells expressing fetal hemoglobin (F-cells) in vivo in the polychromatic (Poly) and orthochromatic (Ortho) subpopulations of the patient bone marrow samples (n=5) (means ± SEM). (F) Imaging flow cytometry images of early basophilic (EB), late basophilic (LB), polychromatic (Poly) and orthochromatic (Ortho) precursors. Upper images are a merge of brightfield and nucleus, lower images are for fetal hemoglobin (HbF) staining (red). *P<0.05, **P<0.01; Mann-Whitney test (D and E).
Figure 6.
Figure 6.
Effect of fetal hemoglobin induction by pomalidomide or CRISPR/Cas9 on terminal erythroid differentiation of sickle cell disease erythroblasts. (A) Percentage of cells expressing fetal hemoglobin (F-cells) at day (D) 7 and D9 of phase II of culture of culture in patient erythroblasts under normoxia (PN), hypoxia (PH), normoxia with POM [PN(POM)] and hypoxia with POM [PH(POM)] (n=4). (B) Percentage of F-cells at D7 and D9 of phase II of culture in patient erythroblasts under normoxia (PN) and hypoxia (PH) treated with guide RNA (gRNA) targeting the LRF binding site (-197) or an unrelated locus as control (AAVS1) (n=4). Genome editing efficiency was 56.1 ± 9.6% and 79.2± 2.8% for -197 and AAVS1 samples, respectively. (C) Percentage of apoptotic cells measured by flow cytometry in PN, PH, PN(POM) and PH(POM) at D7 and D9 of phase II of culture of culture (n=4). (D) Percentage of apoptotic cells at D7 and D9 of phase II of culture in patient erythroblasts under normoxia (PN) and hypoxia (PH) treated with gRNA targeting the LRF binding site (-197) or an unrelated locus as control (AAVS1) (n=4). Horizontal bars represent the mean of each group; *P<0.05, Mann-Whitney test (A, B and D).

References

    1. Pauling L, Itano HA, Singer SJ, Wells IC. Sickle cell anemia, a molecular disease. Science. 1949;110(3):543-548. - PubMed
    1. Piel FB, Steinberg MH, Rees DC. Sickle cell disease. N Engl J Med. 2017;376(16):1561-1573. - PubMed
    1. Ware RE, de Montalembert M, Tshilolo L, Abboud MR. Sickle cell disease. Lancet. 2017;390(10091):311-323. - PubMed
    1. Arlet JB, Dussiot M, Moura IC, Hermine O, Courtois G.Novel players in beta-thalassemia dyserythropoiesis and new therapeutic strategies. Curr Opin Hematol. 2016;23(3):181-188. - PubMed
    1. Arlet JB, Ribeil JA, Guillem F, et al. . HSP70 sequestration by free alpha-globin promotes ineffective erythropoiesis in beta-thalassaemia. Nature. 2014;514(7521):242-246. - PubMed

Publication types

Substances