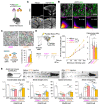
. 2020 Aug 28;369(6507):eabb4853.
doi: 10.1126/science.abb4853.

A synthetic synaptic organizer protein restores glutamatergic neuronal circuits

Affiliations

A synthetic synaptic organizer protein restores glutamatergic neuronal circuits

Kunimichi Suzuki et al. Science. .

Abstract

Neuronal synapses undergo structural and functional changes throughout life, which are essential for nervous system physiology. However, these changes may also perturb the excitatory-inhibitory neurotransmission balance and trigger neuropsychiatric and neurological disorders. Molecular tools to restore this balance are highly desirable. Here, we designed and characterized CPTX, a synthetic synaptic organizer combining structural elements from cerebellin-1 and neuronal pentraxin-1. CPTX can interact with presynaptic neurexins and postsynaptic AMPA-type ionotropic glutamate receptors and induced the formation of excitatory synapses both in vitro and in vivo. CPTX restored synaptic functions, motor coordination, spatial and contextual memories, and locomotion in mouse models for cerebellar ataxia, Alzheimer's disease, and spinal cord injury, respectively. Thus, CPTX represents a prototype for structure-guided biologics that can efficiently repair or remodel neuronal circuits.


Conflict of interest statement

Competing financial interests: K.S., K.T. and M. Y. are co-inventors on Japan patent application 2020-2879 (January 10th, 2020) describing the use of synthetic synapse connector for spinal cord injury.

Figures

Fig. 1
Fig. 1. Structure-guided design and biophysical characterization of CPTX.
(A) The CPTX concept. While Cbln1 induces synapse formation by binding to postsynaptic GluD2 and presynaptic Nrx(+4), NP1 induces clustering of postsynaptic AMPARs without inducing presynaptic elements. CPTX is a chimeric ESP consisting of Cbln1 and NP1 structural elements. (B) Crystal structure of the pentraxin domain of human NP1 (NP1PTX). The N- and C-termini are annotated. Calcium ions (Ca2+) and water molecules are shown as green and red spheres, respectively. 2mFo-DFc electron density is contoured at 1.0 σ. The Ca2+ coordination shell, which includes a cacodylate buffer molecule (CAC), is indicated by black lines. (C) Diagrams of CPTX and related constructs. CC, coiled-coil domain; PTX, pentraxin domain; CRR, cysteine-rich region; gC1q, globular C1q domain; 3Cl, triple coil. The graph on the right shows molecular masses of monomeric NP1PTX, trimeric NP1PTX-3Cl and hexameric CPTX. dRI, differential refractive index. (D) Binding isotherms for the interactions between the GluA1–4 or GluD2 ATDs and immobilized CPTX, NP1PTX and Cbln1. The GluA4 ATD interacted strongest with CPTX (K D ~ 4.5 ± 0.5 μM) and NP1PTX (K D ~ 11.0 ± 0.9 μM), but not with Cbln1. In contrast, the ATD of GluD2 only interacted with Cbln1 (K D > 100 μM). (E) Single-cycle kinetic sensorgrams for the interaction between the ectodomain of Nrx1β(±4) and immobilized CPTX. CPTX directly bound to Nrx1β(+4) (K D ~ 4.90 ± 0.90 nM), but not to Nrx1β(–4).
Fig. 2
Fig. 2. CPTX directly induces excitatory pre- and postsynaptic sites in vitro.
(A) CPTX induced the accumulation of presynaptic terminals of cerebellar granule cells onto co-cultured HEK293 cells displaying AMPAR ATDs. The intensities of the synaptophysin immunoreactivity (Syp; magenta) onto HEK293 cells (green) are quantified in the lower graph. Mock, vehicle (HEPES buffered saline (HBS)) controls. The bars represent the mean ± SEM. ***P < 0.001, **P < 0.01, n = 16–22 fields from 7 independent experiments, one-way ANOVA followed by Tukey’s test. Scale bar, 20 μm. (B) Beads coated with CPTX induced the formation of presynaptic boutons positive for endogenous synaptophysin (Syp) and neurexins (Nrxs), and postsynaptic boutons positive for GluA1–3, in co-cultured hippocampal neurons transfected with GFP. Arrowheads indicate beads immuno-positive for Syp (magenta, middle panel), Nrxs (cyan) or GluA1–3 (magenta, lower panel). Mock, beads coated with anti-HIS antibody. TL, transmitted light. Scale bar, 5 μm. The intensities of the Syp, Nrxs and GluA1–3 immunoreactivity onto beads are quantified in the upper graphs. The bars represent the mean ± SEM. ***P < 0.001, **P < 0.01, n = 21 fields from 5 experiments, one-way ANOVA followed by Tukey’s test. (C) CPTX localizes at excitatory synapses. Representative immunocytochemical staining images show Nrxs or VGluT1 (green), GluA1–4 (magenta) and HIS-tagged CPTX (cyan) in hippocampal neurons. Dendritic spines indicated by yellow arrowheads are magnified. Mean intensities of HIS signals in the Nrx-positive (Nrx+) or VGluT1-positive (VT1+) areas were measured and compared to those in the areas overlapping with GluA1–3 signals (GluA/Nrx+ or GluA/VT1+). The bars represent the mean ± SEM. ***P < 0.001, n = 24–26 fields from 2–3 independent experiments, Student’s t-test with Bonferroni correction. Scale bars, 2 μm (left panels), 1 μm (magnifications).
Fig. 3
Fig. 3. CPTX restores PF-PC synapses and motor coordination in GluD2-null mice.
(A) HIS-tagged CPTX injected into the GluD2-null cerebellum localizes at PF–PC synapses. Mock, vehicle. Scale bar, 500 μm. (B) HIS immunoreactivity in the molecular layer of the injected area (A) colocalized with VGluT1 (a PF marker), but not VGluT2 (a climbing fiber marker) or VGAT (an inhibitory input marker). The scatter plots show the 2D pixel intensity histograms for CPTX (green) and each synapse marker (magenta). Pearson’s correlation coefficient R values are indicated. Scale bar, 2 μm. (C) Representative electron microscopic images show free dendritic spines (f, blue) and contacted spines (c, red) innervated by PFs (green) in the GluD2-null cerebellum 3 d after injection of Cbln1 or CPTX. Scale bar, 500 nm. The fractions of contacted PC spines are quantified in the lower graph. ***P < 0.001, n = 10–20 sections from 1–2 mice, χ2 test. (D) CPTX restores functional PF–EPSCs in GluD2-null mice 3 d after injection. Representative traces are shown. The middle graph shows averaged input-output relationships of PF–EPSCs for each treatment. **P < 0.01, *P < 0.05, n.s. not significant, n = 30 cells each, two-way ANOVA followed by Scheffe post-hoc test. The right graph shows the paired-pulse ratio of the 2nd to 1st PF–EPSC amplitudes. *P < 0.05, n = 30 cells each, Kruskal-Wallis test followed by Scheffe post-hoc test. (E) CPTX improves the gait of GluD2-null mice 3 d after the injection. Representative footprints before and after CPTX injection are shown near the top. The lower graphs show the quantification of gait parameters. Each line represents an individual score before and after injection with either Cbln1 or CPTX. ***P < 0.001, **P < 0.01, *P < 0.05, n = 5–6 mice, Student’s (paired) t-test. Scale bar, 50 mm. The bars represent the mean ± SEM. (CE).
Fig. 4
Fig. 4. CPTX restores spines and LTP in the hippocampus of an Alzheimer’s disease model.
(A) CPTX restores dendritic spine density in 5xFAD mice. Representative Golgi-Cox staining of apical dendrites of CA1 pyramidal neurons in the dorsal hippocampus. Red marks indicate counted spines. Mock, vehicle (HBS buffer) controls. Scale bar, 5 μm. The graph shows the averaged spine density for 7–8 secondary apical dendrites for each animal. The bars represent the mean ± SEM. **P < 0.01, n = 4–5 mice, one-way ANOVA followed by Holm-Sidak post-hoc test. (B) CPTX restores Schaffer collateral (SC)-evoked field excitatory postsynaptic potentials (fEPSPs) in 5xFAD mice. The graph shows averaged input-output relationships of SC–fEPSPs for each treatment. Mock, vehicle (HBS buffer) controls. The bars represent the mean ± SEM. ***P < 0.001, **P < 0.01, *P < 0.05, n = 6–9 slices, repeated two-way ANOVA. (C) CPTX does not affect the presynaptic release probability. The graph shows the paired-pulse ratio of the 2nd to 1st SC-fEPSP amplitudes at 50-ms intervals. The bars represent the mean ± SEM. n.s. not significant, n = 8–9 slices, Student’s t-test. (D) CPTX increases the frequency and the amplitude of mEPSCs, but not mIPSCs, in the 5xFAD hippocampus. Representative traces are shown near the top. **P < 0.01, *P < 0.05, n = 9–15 cells, Student’s t-test. (E) CPTX restores LTP in 5xFAD mice. Application of theta-burst stimulation to SC three times induced a robust LTP at SC-CA1 synapses in the mock-treated WT, but not in the mock-treated 5xFAD hippocampus. Representative SC-fEPSP traces are shown. The bars represent the mean ± SEM. ***P < 0.001, **P < 0.01, n = 8–9 slices, one-way ANOVA on ranks followed by Holm-Sidak post-hoc test for the mean values from the last 15 min of the recording.
Fig. 5
Fig. 5. CPTX restores hippocampus-dependent behaviors in an Alzheimer’s disease model.
(A) CPTX improves spatial memory in 5xFAD mice. CPTX or Mock (vehicle) was injected in 5xFAD mice on day 0. On day 3, mice were placed at the start point (S) of a 3D-printed maze and the pellet was placed at the reward point (R). Two hours after the initial encoding (E) session, mice were returned to the same start point to examine memory integrity in the retrieval (R) session. On the next day, the position of reward was changed, and reversal learning (re-learning) was evaluated. Scale bar, 30 cm. The averaged total distances that mice traveled to reach the goal during the encoding and the retrieval sessions are shown in the lower graph. Log10 scaling of the y-axis facilitates comparison of distances before and after training. The bars represent the mean ± SEM. **P < 0.01, *P < 0.05, # P < 0.1, n = 8–11 mice, two-way repeated measures ANOVA followed by Fisher’s post-hoc Least Significant Difference (LSD) test. (B) CPTX restores context discrimination in 5xFAD mice. CPTX or Mock (vehicle) was injected in 5xFAD mice on day 0. Electrical shock was applied to wild-type and 5xFAD mice in context A on day 5. Freezing time was measured in context A and context B on day 6. The lower graph shows the mean (± SEM) freezing time of each group. ***P < 0.001, n = 8–11 mice, Student’s paired t-test.
Fig. 6
Fig. 6. CPTX promotes restoration of synapses and motor function in spinal cord injury.
(A) Schematic depiction of SCI caused by hemisection at the 10th thoracic vertebra (T10). The lower panels show representative horizontal sections of the spinal cord immunostained for VGluT2, HIS (CPTX) and GluA4 upon Mock (vehicle) or CPTX injection. Scale bar, 0.5 mm. (B) Representative orthogonal images obtained by Airyscan super-resolution microscopy indicating the localization of CPTX in proximity of VGluT2- and GluA4-immunopositive puncta. Scale bar, 0.5 μm. (C) Representative immunohistochemical staining images of coronal sections stained for VGluT2 (blue), GluA4 (green) and HIS (CPTX; magenta) from mock- or CPTX-treated spinal cords. Scale bar, 5 μm. (D) Quantification of the fraction of GluA4+/VGluT2+-double-positive puncta. The bars represent the mean ± SEM. *P < 0.05, n = 16 slices from 8 mice, Student’s t-test. (E–G) Time-course analyses of locomotion (Basso Mouse Scale (BMS) score) in SCI mice after injections. Mock (vehicle), Chondroitinase ABC (ChABC), Cbln1 or CTPX were injected into the spinal cord immediately (E) or 1 week after (F) hemisection, or immediately after contusion by impactors (G, 70 kdyn impact force). For the sham controls, the spinal cord was surgically exposed without imposing injury or injection. Mice that showed a BMS score of 1.5 at 1 week after hemisection were selected for F. **P < 0.01, *P < 0.05, n = 9 mice for each treatment, repeated two-way ANOVA with post-hoc Bonferroni-Dunn test (comparing the various treatments with Mock for each time point).

Comment in

References

    1. Nelson SB, Valakh V. Excitatory/inhibitory balance and circuit homeostasis in autism spectrum disorders. Neuron. 2015;87:684–698. - PMC - PubMed
    1. Palop JJ, Mucke L. Network abnormalities and interneuron dysfunction in Alzheimer disease. Nat Rev Neurosci. 2016;17:777–792. - PMC - PubMed
    1. Bozzi Y, Provenzano G, Casarosa S. Neurobiological bases of autism-epilepsy comorbidity: a focus on excitation/inhibition imbalance. Eur J Neurosci. 2018;47:534–548. - PubMed
    1. Foss-Feig JH, et al. Searching for cross-diagnostic convergence: neural mechanisms governing excitation and inhibition balance in schizophrenia and autism spectrum disorders. Biol Psychiatry. 2017;81:848–861. - PMC - PubMed
    1. Forrest MP, Parnell E, Penzes P. Dendritic structural plasticity and neuropsychiatric disease. Nat Rev Neurosci. 2018;19:215–234. - PMC - PubMed

Publication types

MeSH terms