. 2020 Aug 27;11(1):4284.
doi: 10.1038/s41467-020-17700-9.

Cell-surface receptors enable perception of extracellular cytokinins

Affiliations

Cell-surface receptors enable perception of extracellular cytokinins

Ioanna Antoniadi et al. Nat Commun. .

Abstract

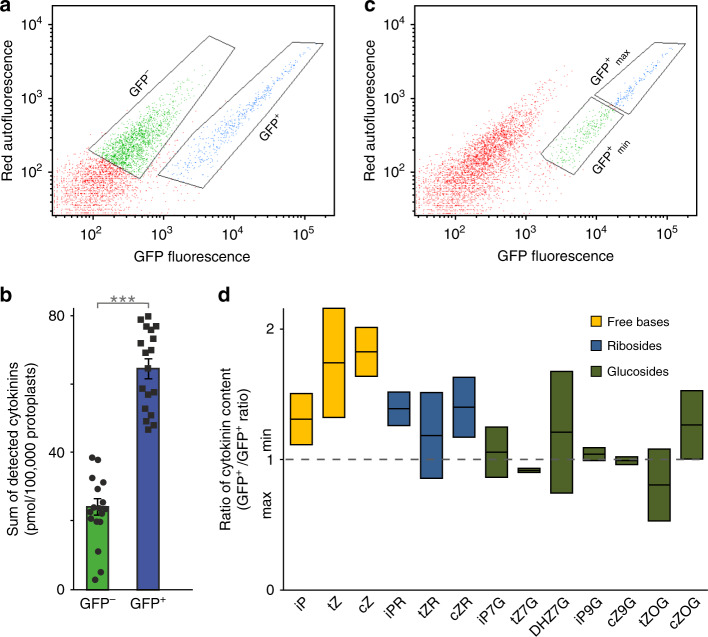
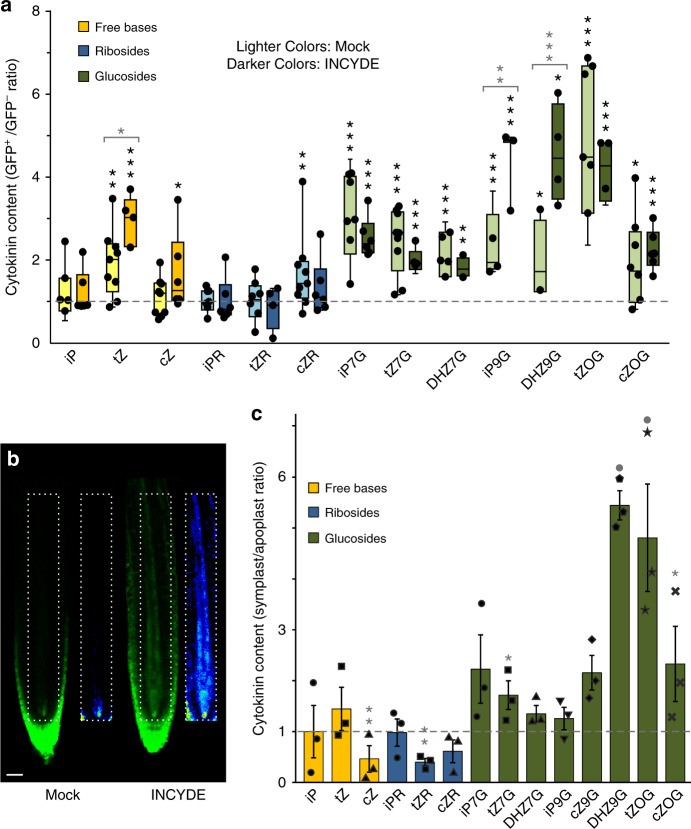
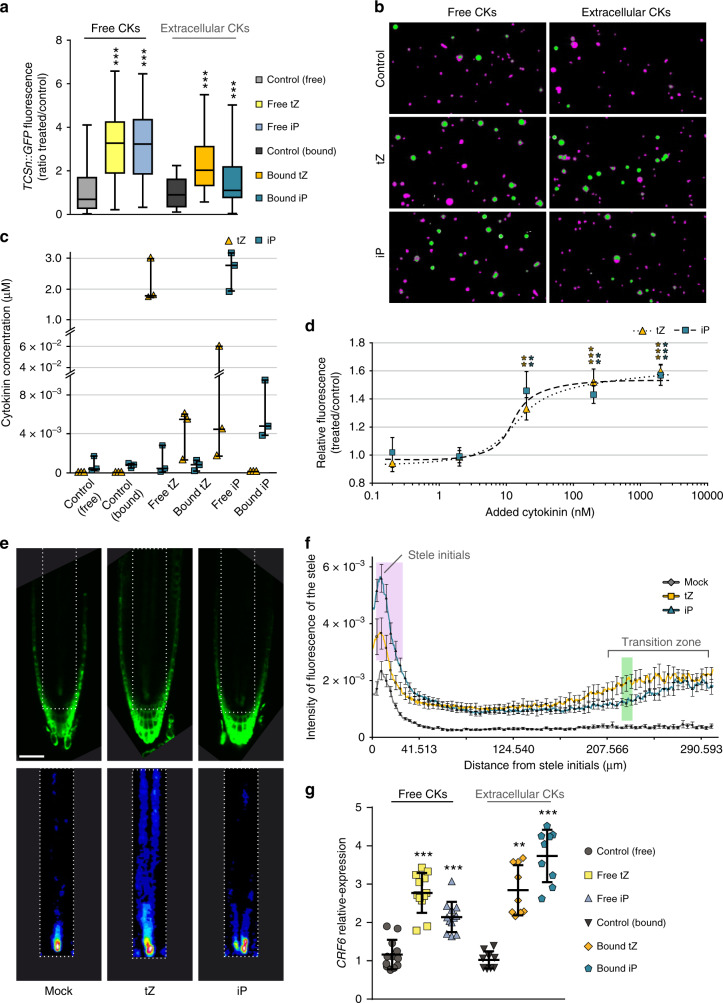
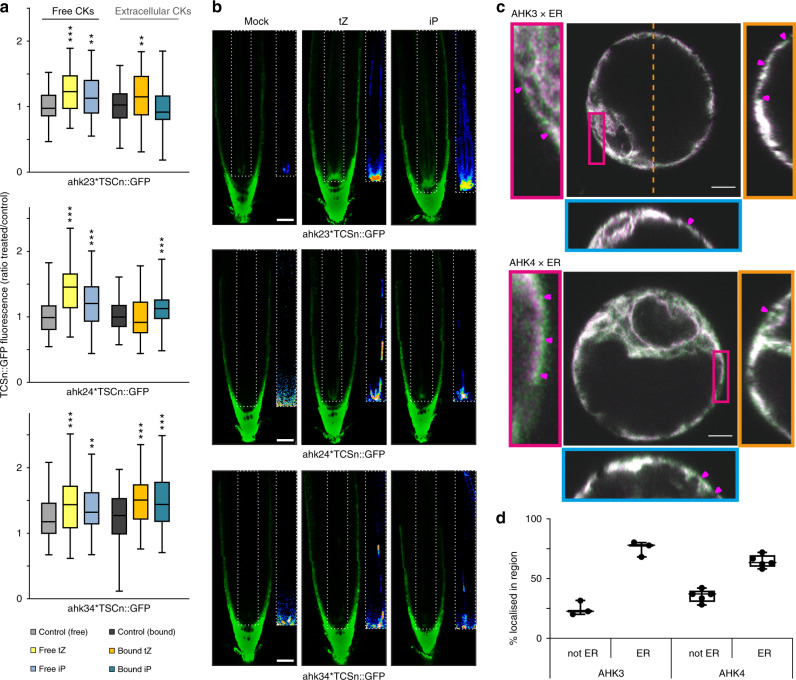
Cytokinins are mobile multifunctional plant hormones with roles in development and stress resilience. Although their Histidine Kinase receptors are substantially localised to the endoplasmic reticulum, cellular sites of cytokinin perception and importance of spatially heterogeneous cytokinin distribution continue to be debated. Here we show that cytokinin perception by plasma membrane receptors is an effective additional path for cytokinin response. Readout from a Two Component Signalling cytokinin-specific reporter (TCSn::GFP) closely matches intracellular cytokinin content in roots, yet we also find cytokinins in extracellular fluid, potentially enabling action at the cell surface. Cytokinins covalently linked to beads that could not pass the plasma membrane increased expression of both TCSn::GFP and Cytokinin Response Factors. Super-resolution microscopy of GFP-labelled receptors and diminished TCSn::GFP response to immobilised cytokinins in cytokinin receptor mutants, further indicate that receptors can function at the cell surface. We argue that dual intracellular and surface locations may augment flexibility of cytokinin responses.


Conflict of interest statement

The authors declare no competing interests.

Figures

Fig. 1
Fig. 1. Cell-level cytokinin content correlates with expression of the TCSn::GFP cytokinin reporter gene.
Analysed by fluorescence-activated cell sorting (FACS) and liquid chromatography–mass spectrometry (LC–MS). a Autofluorescence scattering intensity plotted against GFP fluorescence intensity for 50,000 events analysed, separating the TCSn::GFP root protoplasts into two populations, GFP cells (green) and GFP+ cells (blue) which were then selected (gated) for cell sorting. b Sum of detected cytokinin metabolites in sorted GFP+ and GFP cells, individual values as dot plot with bar (mean with s.e.m). Paired sample t-test applied (***p < 0.001, n = 9 biological replicates, two technical replicates for each biological replicate). c As for a, but showing selection of TCSn::GFP+ cell sub-populations with maximum fluorescence (GFP+max; blue) and minimum fluorescence (GFP+min; green). d Ratios of the concentration of cytokinin metabolites between GFP+max and GFP+min cells. Whiskers indicate entire range of values, central line is mean; n = 2. Bar colours represent different cytokinin metabolite groups: free bases (yellow), ribosides (blue), glucosides (green). All protoplast samples derived from 9-day-old Arabidopsis seedling roots. See also Supplementary Fig. 1.
Fig. 2
Fig. 2. Cytokinin response correlates with enrichment of intracellular trans-zeatin content and is enhanced by inhibition of cytokinin turnover, but bioactive extracellular cytokinins are also present.
a Ratio of cytokinin metabolite concentration between GFP+ and GFP protoplasts from 9-day-old TCSn::GFP seedlings roots, treated with or without 20 μM INCYDE during protoplasting. Cytokinins were quantified as fmol per 100,000 protoplasts. Colours represent different cytokinin metabolite groups: free bases (yellow), ribosides (blue) and glucosides (green). Darker bars are INCYDE-treated samples and lighter colours are corresponding mock treatment. Whiskers represent the entire range of values, boxes indicate first and third quartiles, centre line is median, dots are individual values; n = 9 for mock and n = 6 for treated samples. Black asterisks indicate statistically significant differences in cytokinin concentration between GFP+ and GFP cells of TCSn::GFP treated or mock samples (paired sample t-test). *p < 0.05; **p < 0.01; ***p < 0.001. Grey asterisks above brackets denote statistically significant difference in cytokinin ratios between mock and treated experiment (one-way ANOVA and Tukey’s test, significance levels as above). b Confocal imaging of TCSn::GFP 6-day-old roots with or without 10 μM INCYDE treatment for 6 h. Insets show the respective root vasculature in 16-colour LUT (Look-Up Tables; https://imagej.net/) highlighting the gradations of fluorescence intensity. Scale bar is 35 μm. c Detection of extracellular cytokinins: ratios of cytokinin concentrations in symplastic/apoplastic fluid extracted from 9-day-old Arabidopsis wild-type roots. Ratios were derived from cytokinin levels calculated as fmol (g fresh weight)1 of original tissue and are shown as scatter plot with bar (mean with s.e.m). n = 3 pools of at least 1500 roots; colour coding as in a. Grey asterisks or dots indicate statistically significant differences in cytokinin concentration between symplast and apoplast by paired sample t-test. Significance levels are: dot, p < 0.1; *p < 0.05; **p < 0.01.
Fig. 3
Fig. 3. Extracellular cytokinins activate cytokinin responses.
a Quantification of GFP fluorescence in protoplasts, derived from roots of 6-day-old TCSn::GFP seedlings, after treatment with or without free cytokinins (tZ or iP, 2 μM, denoted “free“) or immobilised cytokinins (tZ or iP, ligand mean density 10 μmol l1 equivalent, attached to Sepharose beads, denoted “bound”, also referred to as extracellular compounds). Negative controls without added cytokinin were incubations with and without beads (control free and bound, respectively). Whiskers represent the entire range of values, boxes indicate first and third quartiles, centre line is median); ***p < 0.001 by one-way ANOVA and Tukey’s test, indicating significant differences in fluorescence intensity between control and corresponding free or extracellular cytokinin treatments. Three independent experiments were performed, with each comprising data from n > 20 images, corresponding to >1000 protoplasts. Cytokinin treatment was for 16 h then 1 μM FM4-64 applied 5 min prior to confocal imaging. See also Supplementary Figs. 5–7b. b Images of the treated protoplast samples described in a. GFP (green) and FM4-64 (magenta) channels are overlaid. c Quantification of iP and tZ in the remaining protoplast samples after the 16 h cytokinin treatment from the experiments described in a. Dots are individual values; whiskers represent the entire range of values, boxes indicate first and third quartiles, centre line is mean. d Dose-response of GFP intensity in protoplasts of TCSn::GFP root protoplasts treated with 0.2, 2, 20, 200 or 2000 nM free tZ or iP for 16 h. Data are shown as ratio of treated/control. Error bars are s.e.m. and asterisks indicate significant differences in TCSn::GFP response (**p < 0.01; ***p < 0.001 by homoscedastic t-test). Other details as for a. e, f Responses of 6-day-old TCSn::GFP-expressing roots to treatment with 2 μM tZ or iP for 16 h. e Confocal images of roots, scale bar 54 μm. Top panels are GFP intensity signal; bottom panels show the respective root vasculature in 16-colour LUT (Look-Up Tables; https://imagej.net/) to better highlight regions with enhanced cytokinin response. f Quantification of GFP fluorescence intensity in the stele (n ≥ 11). Results are combined from two independent experiments, with the fluorescent signal of ten roots quantified in each experiment using ImageJ. Error bars are s.e.m. Both cytokinins significantly enhanced TCSn::GFP response compared with controls, while the highlighted areas in magenta (iP > tZ) and green (tZ > iP) show significant differences between tZ and iP responses (p < 0.05, homoscedastic t-test). g qRT-PCR analysis of expression of Cytokinin Response Factor 6 (CRF6) induced by free and extracellular bound cytokinins (experimental setup as in a). Dots are individual values, whisker represents s.d., centre line is mean. Data are relative expression by the 2ΔΔCt method. Asterisks indicate values significantly different from the corresponding control treatment (**p < 0.01; ***p < 0.001 by Mann–Whitney U test). Four biological replicates were analysed in triplicate.
Fig. 4
Fig. 4. Cytokinin responses when only one AHK receptor is active, and receptor localisation.
a Quantification of GFP fluorescence in protoplasts derived from roots of 6-day-old TCSn::GFP seedlings in wild type (Col-0), ahk3,4, ahk2,3 and ahk2,4 backgrounds, after treatment for 16 h with or without free cytokinins (tZ or iP, 2 μM, denoted “free”) or immobilised cytokinins (tZ or iP, ligand mean density 10 μmol l−1 equivalent, attached to Sepharose beads, denoted “bound”). Negative controls without added cytokinin were incubations with and without beads (control free and bound, respectively). Whiskers indicate entire range of values, box indicates first and third quartiles, and central line is mean; **p < 0.01; ***p < 0.001 by one-way ANOVA and Tukey’s test, indicating significant differences in fluorescence intensity between control and corresponding free or extracellular cytokinin treatments. Three independent experiments were performed with each comprising data from n > 20 images, corresponding to >1000 protoplasts. See also Supplementary Figs. 7 and 10. b Confocal images of roots from ahk3,4, ahk2,3 and ahk2,4 double mutants expressing TCSn::GFP, after treatment for 24 h with 100 nM tZ or iP. Scale bar is 39 μm. The inset panels show the respective root vasculature in 16-colour LUT (Look-Up Tables; https://imagej.net/) highlighting the gradations of fluorescence intensity. c 3D Airyscan images of Arabidopsis protoplasts expressing AHK3–GFP (green; above) and AHK4–GFP (below) and the ER maker RFP-p24δ5 (magenta). The left panel shows a zoomed in region of the cell (red rectangle). The right panel depicts the YZ orthogonal view of the Z-stack (orange dashed line). The bottom panel shows the XZ orthogonal view of the Z-stack (blue dashed line). Magenta arrows indicate regions of AHK-only signal on the cell surface. Scale bars, 5 µm. d Quantitative analysis of AHK-GFP signal co-localising or not co-localising with ER marker RFP-p24δ5. Whiskers represent entire range of values, boxes indicate first and third quartiles, central line is median and dots are values for individual cells. n = 3 for AHK3, n = 5 for AHK4.

References

    1. Kieber JJ, Schaller GE. Cytokinin signaling in plant development. Development. 2018;145:1–7. - PubMed
    1. Ha S, Vankova R, Yamaguchi-Shinozaki K, Shinozaki K, Tran L-SP. Cytokinins: metabolism and function in plant adaptation to environmental stresses. Trends Plant Sci. 2012;17:172–179. - PubMed
    1. Lomin SN, et al. Plant membrane assays with cytokinin receptors underpin the unique role of free cytokinin bases as biologically active ligands. J. Exp. Bot. 2015;66:1851–1863. - PMC - PubMed
    1. Sakakibara H. Cytokinins: activity, biosynthesis, and translocation. Annu. Rev. Plant Biol. 2006;57:431–449. - PubMed
    1. Antoniadi I, et al. Cell-type-specific cytokinin distribution within the Arabidopsis primary root apex. Plant Cell. 2015;27:1955–1967. - PMC - PubMed

Publication types

MeSH terms