. 2020 Aug 27;11(1):4281.
doi: 10.1038/s41467-020-17793-2.

The dynamic landscape of transcription initiation in yeast mitochondria

Affiliations

The dynamic landscape of transcription initiation in yeast mitochondria

Byeong-Kwon Sohn et al. Nat Commun. .

Abstract

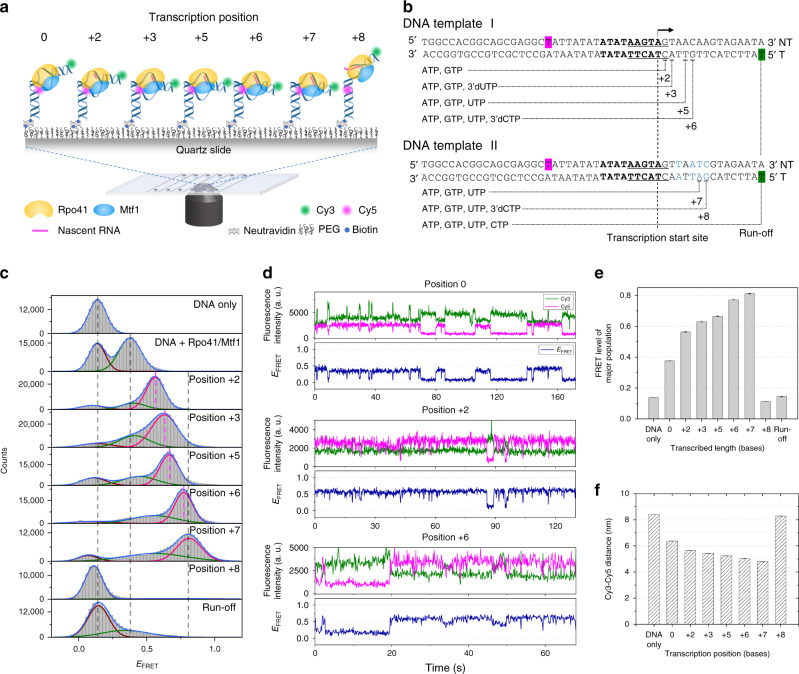
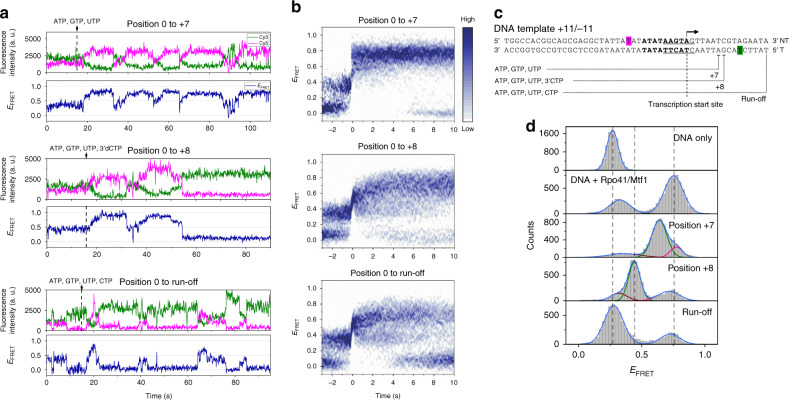
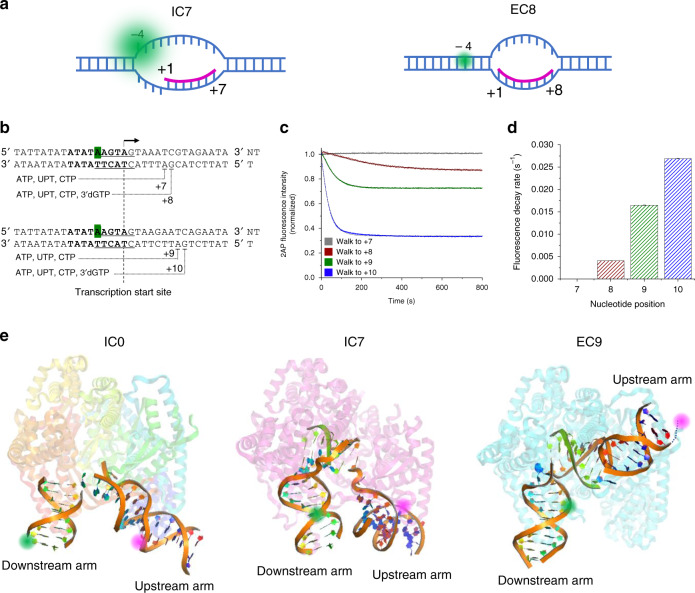
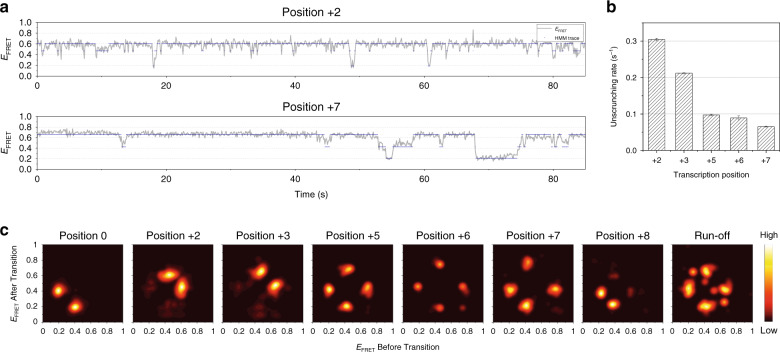
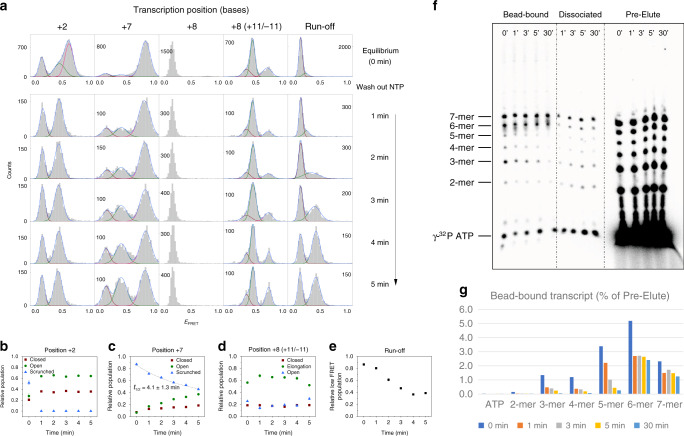
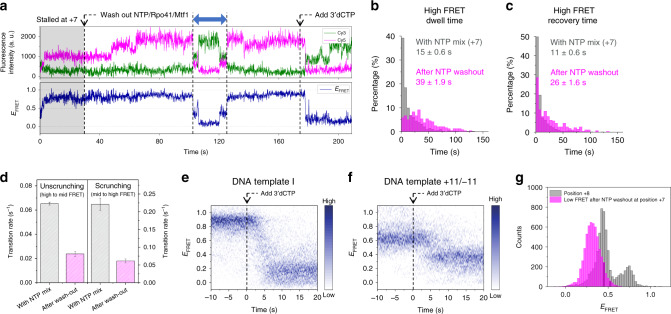
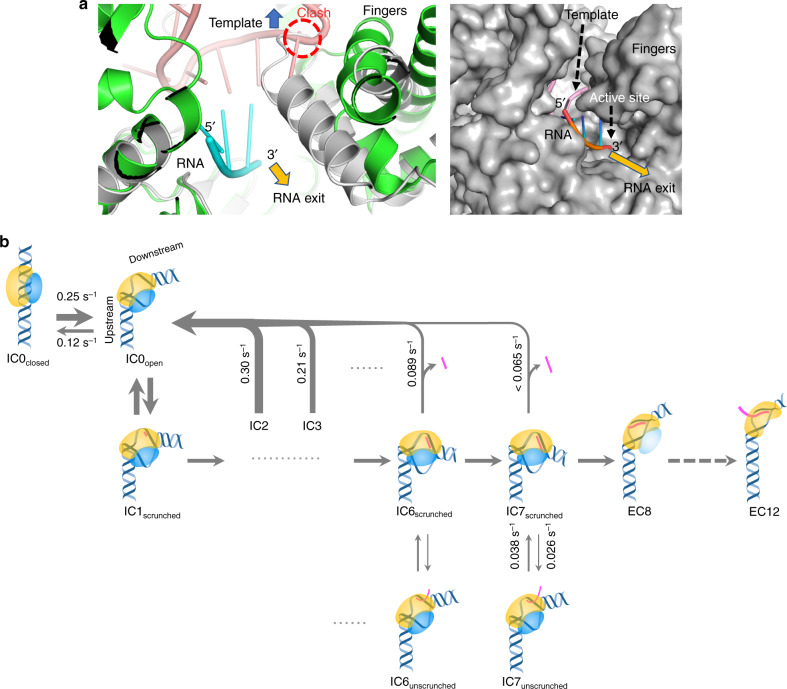
Controlling efficiency and fidelity in the early stage of mitochondrial DNA transcription is crucial for regulating cellular energy metabolism. Conformational transitions of the transcription initiation complex must be central for such control, but how the conformational dynamics progress throughout transcription initiation remains unknown. Here, we use single-molecule fluorescence resonance energy transfer techniques to examine the conformational dynamics of the transcriptional system of yeast mitochondria with single-base resolution. We show that the yeast mitochondrial transcriptional complex dynamically transitions among closed, open, and scrunched states throughout the initiation stage. Then abruptly at position +8, the dynamic states of initiation make a sharp irreversible transition to an unbent conformation with associated promoter release. Remarkably, stalled initiation complexes remain in dynamic scrunching and unscrunching states without dissociating the RNA transcript, implying the existence of backtracking transitions with possible regulatory roles. The dynamic landscape of transcription initiation suggests a kinetically driven regulation of mitochondrial transcription.


Conflict of interest statement

The authors declare no competing interests.

Figures

Fig. 1
Fig. 1. Transcription initiation occurs through dynamic conformational changes.
a Single-molecule measurements of transcription initiation dynamics. The dual-labeled DNA template complexed with Rpo41 and Mtf1 was observed using a total internal reflection fluorescence microscope. b DNA templates used in base-pair-wise measurements of initiation complex dynamics. DNA template I could be stalled at positions +2, +3, +5, and +6, while DNA template II, which differed from DNA template I by four base-pairs (blue), could be stalled at positions +7 and +8. Both templates were labeled with Cy5 at position −16 of the non-template strand (magenta) and Cy3 at position +16 of template strand (green). The transcription promoter (underscored) and start site (arrow) are indicated. c FRET histograms from single-molecule traces with colocalized Cy3 and Cy5 signals at each stalling position. Histograms were fit to single, double, or triple Gaussian peaks (Supplementary Table 1). The brown, green, and magenta curves represent low, mid, and high FRET populations, respectively. Dashed vertical lines mark the major FRET peaks of DNA only, DNA + Rpo41/Mtf1, and the complex at position +7. Dashed lines in magenta mark the major FRET peaks at positions +2, +3, +5, and +6. d Representative smFRET traces at positions 0, +2, and +6 showing the Cy3 (green) and Cy5 (magenta) signals, and the FRET efficiency traces (navy). e The FRET level of the major population in c shown for each stalling position as the center of the major Gaussian peak. The error bars represent the error in finding the peak center position from Gaussian fitting. f The Cy3–Cy5 distance at each stalling position calculated as the average between those obtained from DNA templates I/II (e) and I/II NT (Supplementary Fig. 5). Error bars represent the propagation of the errors in FRET levels.
Fig. 2
Fig. 2. Transition to elongation occurs via a large, abrupt conformational change at position +8.
a Representative smFRET traces from flow-in measurements. The point at which combinations of NTPs were added to stall the initiation complex at position +7 or +8, or to enable run-off is shown as a vertical dotted line. b FRET evolution maps constructed by overlaying multiple traces synchronized at the moment the FRET signal reached 0.5 (0 s). The 176, 181, and 160 traces were used to generate maps for progression to positions +7 and +8 and run-off, respectively. c Schematic design of DNA template +11/−11 used to distinguish between the conformations of the elongation complex and DNA only. d FRET histograms from DNA template +11/−11. Single, double, or triple Gaussian fitting to each histogram is shown (Supplementary Table 1). Dashed vertical lines mark the major FRET peaks of DNA only, DNA + Rpo41/Mtf1, and the complex at position +8.
Fig. 3
Fig. 3. The transcription initiation bubble collapses upon transition to elongation.
a Schematic illustration showing IC7 with the initiation bubble and a 7-nt RNA (magenta) annealed to the template DNA from positions +1 to +7. The template bases from −4 to −1 are single stranded, resulting in a strong fluorescence signal of 2AP at position −4 of the non-template strand (green). At position +8, EC8 is shown where the initiation bubble has collapsed and the −4 to −1 region is reannealed, resulting in the quenching of 2AP fluorescence. b Design of DNA templates used for 2AP fluorescence measurements, to be stalled at positions +7, +8, +9, and +10. c Changes in 2AP fluorescence measured along in vitro transcription reactions to the indicated positions, normalized against the initial intensity. The intensity traces were fit to a single-exponential decay curve to determine the transition rates. d Fluorescence decay rates measured from c at different walking positions. e Models of the IC0, IC7, and EC9 structures generated using PyMOL (Schrödinger, USA). IC0 was modeled using PDB 6erp (human mitochondrial RNA polymerase initiation complex), IC7 was modeled using PDB 3e2e (bacteriophage T7 RNA polymerase initiation complex with 7 bp RNA:DNA), and EC9 was modeled using PDB 4boc (human mitochondrial RNA polymerase elongation complex with 9 bp RNA:DNA). The green and magenta balls represent the Cy3 and Cy5 fluorophores at positions +11 and −11, respectively. The double-stranded DNA and RNA:DNA hybrid (RNA in green) is highlighted as bound to the protein in the background.
Fig. 4
Fig. 4. Hidden Markov analysis throughout the initiation and elongation stages.
a Representative smFRET traces (gray) at positions +2 and +7 shown alongside hidden state traces (navy) from hidden Markov modeling assuming three hidden states. b Unscrunching rates obtained from the hidden Markov analysis at each stalling position during initiation. Error bars represent the error in transition rate estimation in the hidden Markov analysis. c Transition density plots from hidden Markov analyses of traces at each stalling position. The 509, 184, 162, 45, 98, 51, 67, and 27 traces were used for positions 0, +2, +3, +5, +6, +7, +8, and run-off conditions, respectively.
Fig. 5
Fig. 5. The rate of abortive initiation sharply depends on the transcription position.
a FRET histograms obtained at equilibrium and after washing out the NTP mixture for positions +2, +7, and +8, and run-off conditions. For position +8, results from DNA template +11/−11 are included to distinguish between the populations of the elongation complex and DNA only. Each histogram was obtained from 12 short movies taken during each minute after washing out the NTP mixture (Supplementary Table 1). b, c Time traces of the relative populations of closed (low FRET), open (mid FRET), and scrunched (high FRET) complexes obtained from histograms at positions +2 (b) and +7 (c). Each graph was fit to a single-exponential decay curve, and the half-life is shown. In c, the graph of the scrunched population was fit to a single-exponential decay curve, and the half-life is shown. d Time trace of the relative populations of closed (low FRET), open (high FRET), and elongation (mid FRET) complexes obtained from histograms at position +8 on DNA template +11/−11. e Time trace of the relative low FRET population obtained from histograms under run-off conditions. In be, the error bars represent the error in the relative populations originating from the error in estimating the areas under the Gaussian curves. f Gel electrophoresis image of abortive transcripts from bead-based in vitro transcription assay, stalling at position +7. Each nucleotide length is marked. The time delay between NTP washout and the collection of bead-bound transcripts is shown (0–30 min). The experiment was repeated three times showing similar results. g Quantified percentage of bead-bound transcripts over transcripts in pre-elute, which are the products from 15 min transcription reaction before NTP washout.
Fig. 6
Fig. 6. The stalled initiation complex makes conformational transitions without dissociating RNA.
a Representative smFRET trace showing the conformational dynamics of the TIC of DNA template II equilibrated at position +7 (gray region; 0.5 mM each of ATP, GTP, and UTP) after washing out the NTP mix (first arrow). Subsequently, 0.5 mM 3′dCTP was added to promote progression to position +8 (second arrow). The abrupt drop in the FRET efficiency indicates successful progression to position +8. b Dwell time histogram of the high FRET (scrunched) state in the presence of NTP mix (gray; 809 events) and after NTP washout (magenta; 214 events). c The time taken to recover the high FRET state after dropping to lower FRET levels (blue arrow in a) in the presence of NTP mix (gray; 843 events) and after NTP washout (magenta; 284 events). d Comparison of unscrunching and scrunching rates in the presence of NTP mix and after NTP washout, measured as the inverse of average dwell times in b and c. Data represent mean and s.e.m. from three independent measurements. e, f FRET evolution maps generated from the traces supplied with 0.5 mM 3′dCTP after long stalling at position +7 by washing out the NTP mix, synchronized at the moment of flowing in 3′dCTP (0 s). The 53 and 41 traces were used for the maps generated for DNA templates II and +11/−ID + βID 11, respectively. g Using DNA template +11/−11, FRET histogram of low-FRET events after NTP washout at position +7 (magenta) was compared to that of position +8 (gray, from Fig. 2d).
Fig. 7
Fig. 7. Structural analysis and kinetic model of mitochondrial transcription initiation.
a (Left) superposition of T7 RNAP TIC (PDB Id. 1QLN; green RNAP, pink DNA template, and cyan RNA transcript) on POLRMT from the human mitochondrial TIC structure (PDB Id. 6ERQ; gray POLRMT). (Right) a molecular surface representation of POLRMT showing a possible exit channel (gold arrow) for the 3′-end of RNA. b Conformational states and their transition rates identified in this study are integrated into a schematic model. Existence of Mtf1 in EC8 is not known yet and thus expressed semitransparent. DNA/RNA oligos and proteins are drawn as in Fig. 1a.

Similar articles

Cited by

References

    1. Gralla JD, Carpousis AJ, Stefano JE. Productive and abortive initiation of transcription in vitro at the lac UV5 promoter. Biochemistry. 1980;19:5864–5869. - PubMed
    1. Kubori T, Shimamoto N. A branched pathway in the early stage of transcription by Escherichia coli RNA polymerase. J. Mol. Biol. 1996;256:449–457. - PubMed
    1. Lerner E, et al. Backtracked and paused transcription initiation intermediate of Escherichia coli RNA polymerase. Proc. Natl Acad. Sci. USA. 2016;113:E6562–E6571. - PMC - PubMed
    1. Kim H, Tang GQ, Patel SS, Ha T. Opening-closing dynamics of the mitochondrial transcription pre-initiation complex. Nucleic Acids Res. 2012;40:371–380. - PMC - PubMed
    1. Duchi D, et al. RNA polymerase pausing during initial transcription. Mol. Cell. 2016;63:939–950. - PMC - PubMed

Publication types

MeSH terms

LinkOut - more resources