. 2020 Aug 27;11(1):4158.
doi: 10.1038/s41467-020-17968-x.

Single cell transcriptomics identifies a signaling network coordinating endoderm and mesoderm diversification during foregut organogenesis

Affiliations

Single cell transcriptomics identifies a signaling network coordinating endoderm and mesoderm diversification during foregut organogenesis

Lu Han et al. Nat Commun. .

Abstract

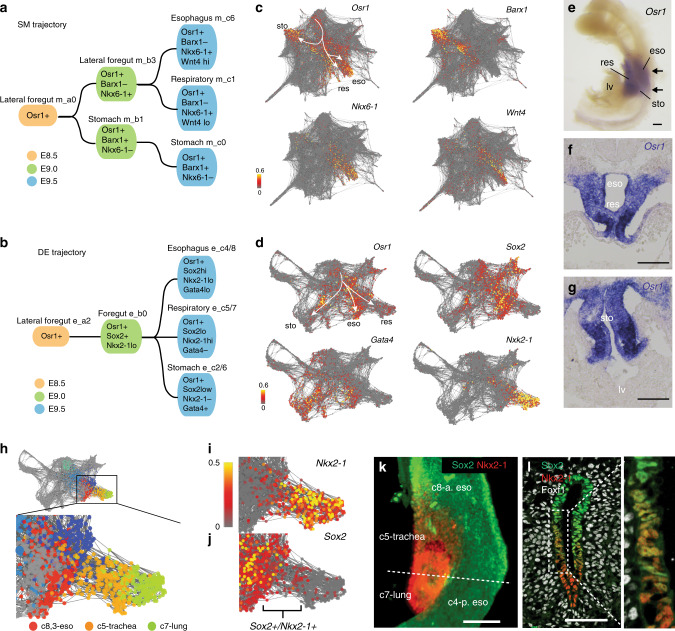
Visceral organs, such as the lungs, stomach and liver, are derived from the fetal foregut through a series of inductive interactions between the definitive endoderm (DE) and the surrounding splanchnic mesoderm (SM). While DE patterning is fairly well studied, the paracrine signaling controlling SM regionalization and how this is coordinated with epithelial identity is obscure. Here, we use single cell transcriptomics to generate a high-resolution cell state map of the embryonic mouse foregut. This identifies a diversity of SM cell types that develop in close register with the organ-specific epithelium. We infer a spatiotemporal signaling network of endoderm-mesoderm interactions that orchestrate foregut organogenesis. We validate key predictions with mouse genetics, showing the importance of endoderm-derived signals in mesoderm patterning. Finally, leveraging these signaling interactions, we generate different SM subtypes from human pluripotent stem cells (hPSCs), which previously have been elusive. The single cell data can be explored at: https://research.cchmc.org/ZornLab-singlecell .


Conflict of interest statement

The authors declare no competing interests.

Figures

Fig. 1
Fig. 1. Single-cell analysis of the mouse foregut endoderm and mesoderm lineages.
a Representative mouse embryo images at three developmental stages showing the foregut region (dashed) that was microdissected (insets) to generate single cells. At E9.5, anterior foregut (a.fg) and posterior foregut (p.fg) were isolated separately. E, embryonic day; s, somite number; n, number of cells. Scale bar 1 mm. b Schematic of the RNA-seq workflow. c UMAP visualization of 31,268 cells isolated from pooled samples of all three stages. Cells are colored based on major cell lineages. d. Whole-mount immunostaining of an E9.5 mouse foregut, showing the Cdh1+ endoderm and the surrounding Foxf1+ splanchnic mesoderm. n = 4/4 embryos. Scale bar: 100 μm. e, f tSNE plot of in silico isolated E9.5 endodermal (e) and splanchnic mesodermal (f) cells. g, h Pseudo-spatial ordering of E9.5 endodermal (g) and mesodermal (h) cells along the anterior–posterior (A-P) axis. i, j Schematic of the predicted locations of E9.5 cell types mapped onto i the embryonic mouse foregut endoderm (yellow) and j mesoderm (orange). def. definitive; meso, mesoderm; lg, lung; eso, esophagus; lv, liver; splanch; splanchnic; stm, septum transversum mesenchyme; sto, stomach; pha, pharynx. Source data for (g) and (h) are provides in the Source data file.
Fig. 2
Fig. 2. Lineage-restricted gene expression in different SM cell types.
a Schematic of the E9.5 foregut indicating the level of sections. b Dotplot showing average scRNA-seq expression (normalized to a scale of 0–2) of marker genes in different E9.5 SM cell clusters. The size of the dot represents the % of cells in a cluster expressing the marker. cg Whole-mount immunostaining (c) or in situ hybridization (dg) of dissected E9.5 foregut tissue. n = 2/2 embryos/probe. Scale bar: 100 μm. hq RNA-scope in situ detection on transvers E9.5 mouse embryos sections (i–iv indicates the A-P level of the section in a). n = 2/2 embryos/probe combination. Scale bar: 50 μm. duo; duodenum, dp; dorsal pancreas, eso; esophagus, ht; heart, lg; lung, liv; liver, oft, outflow tract, pha pharynx, res; respiratory, stm; septum transversum, mesenchyme, sto; stomach, sv; sinus venosus, vp; ventral pancreas.
Fig. 3
Fig. 3. Coordinated endoderm and mesoderm cell trajectories.
a, b Force-directed SPRING visualization of the a splanchnic mesoderm (n = 10,097) and b definitive endoderm (n = 4448) cell trajectories. Cells are colored by developmental stage. White arrows indicate cell lineage progression. c, d Confusion matrix summarizing parent-child single-cell voting for c SM and d DE cells, used to construct the cell-state tree. Each cell at the later time point (y-axis) voted for its most similar cell at the preceding time point (x-axis) based on transcriptome similarity (KNN) (see Methods). All of the votes for a give cluster are tabulated, normalized for cluster size (see Methods for details) and represented as a % of votes in the heatmap. E8.5, E9.0, and E9.5 clusters are designated as (a), (b), and (c), respectively. e, f Cell-state trees of e SM and f DE lineages predicted by single-cell voting. The top choice linking cell states of sequential time points are solid lines, and prominent second choices are dashed lines. Nodes are colored by stages and annotated with the cluster numbers.
Fig. 4
Fig. 4. Coordinated development of endoderm and mesoderm progenitor populations.
a, b Graphical illustration of the esophageal–respiratory–gastric cell-state trajectories for a SM and b DE with key marker genes. This suggests the coordinated development of Osr1+ multi-lineage progenitors. c, d SRPING plots of c SM and d DE projecting the normalized expression of key genes in each cell. e In situ hybridization of Osr1 in dissected foregut, showing Osr1 is expressed in the respiratory, esophageal and gastric regions. Scale bar: 100 μm. n = 3/3 embryos. f, g In situ hybridization of Osr1 in sections across the respiratory and gastric regions within the foregut, showing that Osr1 is expressed in both the endodermal and mesenchymal cells. Scale bar: 200 μm. n = 3/3 embryos. h SPRING plot of the DE esophageal–respiratory lineages. i, j Normalized Nkx2-1 (i) and Sox2 (j) transcript levels in each cell projected onto the SPRING plot, showing co-expression at the esophageal–tracheal boundary. k Sox2 and Nkx2-1 whole-mount immunostaining of a E9.5 mouse foregut. Scale bar: 50 μm. n = 3/3 embryos. l Sox2, Nkx2-1, and Foxf1 immunostaining of a transverse E9.5 foregut section, confirming a rare population of Sox2/Nkx2-1 co-expressing cells. Panel to the right is a magnification of box in (l). Scale bar: 50 μm. n = 3/3 embryos.
Fig. 5
Fig. 5. Computationally inferred receptor–ligand interactions predict a signaling roadmap of foregut organogenesis.
a, b E9.5 foregut immunostaining of Cdh1 (epithelium) and Foxf1 (mesenchyme) in a whole-mount (same image as Fig. 1d) and b section, showing the epithelial–mesenchymal tissue microenvironment (dashed circle). Scale bars: 100 μm. n = 4/4 embryos. c Predicted receptor–ligand interactions between adjacent foregut cell populations. The schematics show paracrine signaling between the DE (yellow cells) and the SM (brown cells) for six major pathways. E9.5 DE and SM cell clusters are ordered along the anterior to posterior axis based to their locations in vivo, with spatially adjacent DE and SM cell types across from one another. Color and size of each node represents the normalized average signaling-response–metagene expression level scaled from 2 to −2 and the % of expressing cell in each cluster, predicting the likelihood that a given cell population is responding to the growth factor signal. Thin vertical lines next to clusters indicate different cell populations in spatial proximity that are all responding to the same signal pathway. Arrows represent the predicted paracrine and autocrine receptor–ligand interactions (see Methods). d BMP-response–metagene expression levels projected on the DE and SM SPRING plot, colored by normalized scaled expression in each cell. e In situ hybridization of Bmp4 in a foregut transverse section, showing the expression of in the respiratory mesenchyme and the stm. n = 8/8 embryos. Scale bar: 100 μm. f, g pSmad1 immunostaining in foregut transverse sections, indicating BMP signal response in the respiratory and liver DE and SM. n = 3/3 embryos. Scale bar: 100 μm. h, i Signaling roadmap summarizing the inferred signaling state of all 6 pathways projected on the h DE and i SM cell-state trees suggests the combinatorial signals predicted to control lineage diversification. The letters indicated the putative signals at each step, with larger font indicating a stronger signaling response. a, anterior; p, posterior; hp, hepatopancreatic; stm, septum transversum mesenchyme.
Fig. 6
Fig. 6. Genetic test of the signaling roadmap revealed that HH promotes gut tube versus liver mesenchyme.
a, b SPRING visualization of a the HH ligand–metagene expression in DE cells and b HH-response–metagene expression in SM cells. The color scale shows the normalized expression in each cell. c The normalized HH response–metagene expression projected onto the SM cell-state tree, showing low HH activity in the liver and pharynx SM but high activity in the gut tube mesenchyme. d Shh is expressed in the gut tube epithelium but not in the hepatic epithelium (outlined). n = 5/5 embryos. Gli1-lacZ, a HH-response transgene, is active in the gut tube mesenchyme but not in the liver stm. n = 3/3 embryos. Scale bars: 100 μm. e. Differentially expressed genes between Gli2−/−, Gli3−/− and Gli2+/−, Gi3+/− mouse E9.5 foreguts through bulk RNA sequencing (log2 FC > 1, FDR < 5%). n = 3 embryos/genotype. f Heatmap showing the min–max row normalized average expression of HH/Gli-regulated genes (from e) in E9.5 DE and SM single-cell clusters. g Gene set enrichment analysis (GSEA) reveals specific cell-type enrichment of HH/Gli-regulated genes. h Schematic of HH activity in the foregut.
Fig. 7
Fig. 7. Generation of splanchnic mesoderm-like progenitors from human PSCs.
a Schematic of the protocol to differentiate hPSCs into SM subtypes. Factors in red indicate signals predicted from the mouse single-cell signaling roadmap. b RT-PCR of markers with enriched expression in specific SM subtypes based on the mouse single-cell data: cardiac (NKX2-5), early SM (FOXF1, HOXA1); liver stm/mesothelium (WT1, UKP1B), liver-fibroblast (MSX1), respiratory SM (NKX6-1+, MSC−), esophageal/gastric (MSC, BARX1). The histogram shows the means ± S.D. Statistical significance was calculated using a two-sided Tukey’s multiple comparisons test. *p < 0.05, **p < 0.005, ***p < 0.0005. Exact p-values were provided in Source data file. n = 3 independent biological samples. Similar results were obtained from five independent experiments. c Representative images of Day 7 cell cultures immunostaining. Similar results were obtained from three independent experiments. Scale bar; 50 μm (upper panels), 10 μm (lower panels). d Quantification of % cells positive for the indicated immunostaining or RNA-scope in situ hybridization. Histograms show the means ± S.D. n = 3 independent fields. Immunostaining quantification results were similar for two separate experiments and RNA-scope validation was performed once. Statistical significance was calculated using two-sided Dunnett’s multiple comparisons test. *p < 0.05, **p < 0.005, ***p < 0.0005. Exact p-values were provided in Source data file. ns; not significant, nt; not tested. Source data are provided as a Source data file.

References

    1. Kraus MR, Grapin-Botton A. Patterning and shaping the endoderm in vivo and in culture. Curr. Opin. Genet. Dev. 2012;22:347–353. doi: 10.1016/j.gde.2012.05.002. - DOI - PubMed
    1. Zorn AM, Wells JM. Vertebrate endoderm development and organ formation. Annu Rev. Cell Dev. Biol. 2009;25:221–251. doi: 10.1146/annurev.cellbio.042308.113344. - DOI - PMC - PubMed
    1. Le Douarin N, Houssaint E. Role of the mesoderm in the induction of the synthesis of glycogen during differentiation of the hepatic endoderm. C. R. Acad. Hebd. Seances Acad. Sci. D. 1967;264:1872–1874. - PubMed
    1. Ferretti E, Hadjantonakis AK. Mesoderm specification and diversification: from single cells to emergent tissues. Curr. Opin. Cell Biol. 2019;61:110–116. doi: 10.1016/j.ceb.2019.07.012. - DOI - PMC - PubMed
    1. Sweetman D, Wagstaff L, Cooper O, Weijer C, Munsterberg A. The migration of paraxial and lateral plate mesoderm cells emerging from the late primitive streak is controlled by different Wnt signals. BMC Dev. Biol. 2008;8:63. doi: 10.1186/1471-213X-8-63. - DOI - PMC - PubMed

Publication types

MeSH terms

Substances