. 2020 Oct;38(10):1174-1183.
doi: 10.1038/s41587-020-0659-0. Epub 2020 Aug 27.

Evaluation of SARS-CoV-2 serology assays reveals a range of test performance

Jeffrey D Whitman #  1 Joseph Hiatt #  2   3   4   5   6   7 Cody T Mowery #  2   3   5   6   7 Brian R Shy #  1 Ruby Yu #  5   7 Tori N Yamamoto  5   7 Ujjwal Rathore  4   5   6   7 Gregory M Goldgof  1 Caroline Whitty  1   5   7 Jonathan M Woo  5   6   7 Antonia E Gallman  2   5   8 Tyler E Miller  9 Andrew G Levine  1 David N Nguyen  5   6   10 Sagar P Bapat  1   5   7 Joanna Balcerek  1 Sophia A Bylsma  11 Ana M Lyons  12 Stacy Li  12 Allison Wai-Yi Wong  2 Eva Mae Gillis-Buck  13 Zachary B Steinhart  5   7 Youjin Lee  5 Ryan Apathy  5   6   7 Mitchell J Lipke  5   7 Jennifer Anne Smith  7 Tina Zheng  2   3   14   15 Ian C Boothby  2   16 Erin Isaza  2   17 Jackie Chan  5 Dante D Acenas 2nd  5 Jinwoo Lee  2   18 Trisha A Macrae  2   18 Than S Kyaw  2   5 David Wu  2   3 Dianna L Ng  15   19 Wei Gu  1 Vanessa A York  20 Haig Alexander Eskandarian  20 Perri C Callaway  20   21 Lakshmi Warrier  20 Mary E Moreno  20 Justine Levan  20 Leonel Torres  20 Lila A Farrington  20 Rita P Loudermilk  22 Kanishka Koshal  22 Kelsey C Zorn  23 Wilfredo F Garcia-Beltran  9 Diane Yang  9 Michael G Astudillo  9 Bradley E Bernstein  9 Jeffrey A Gelfand  24 Edward T Ryan  24 Richelle C Charles  24 A John Iafrate  9 Jochen K Lennerz  9 Steve Miller  1 Charles Y Chiu  1   10   25 Susan L Stramer  26 Michael R Wilson  3   22 Aashish Manglik  27   28 Chun Jimmie Ye  29   30   31   32   33   34 Nevan J Krogan  4   35   36 Mark S Anderson  7 Jason G Cyster  5   8 Joel D Ernst  20 Alan H B Wu  1 Kara L Lynch  1 Caryn Bern  37 Patrick D Hsu  38   39   40 Alexander Marson  41   42   43   44   45   46   47   48   49   50
Affiliations

Evaluation of SARS-CoV-2 serology assays reveals a range of test performance

Jeffrey D Whitman et al. Nat Biotechnol. 2020 Oct.

Abstract

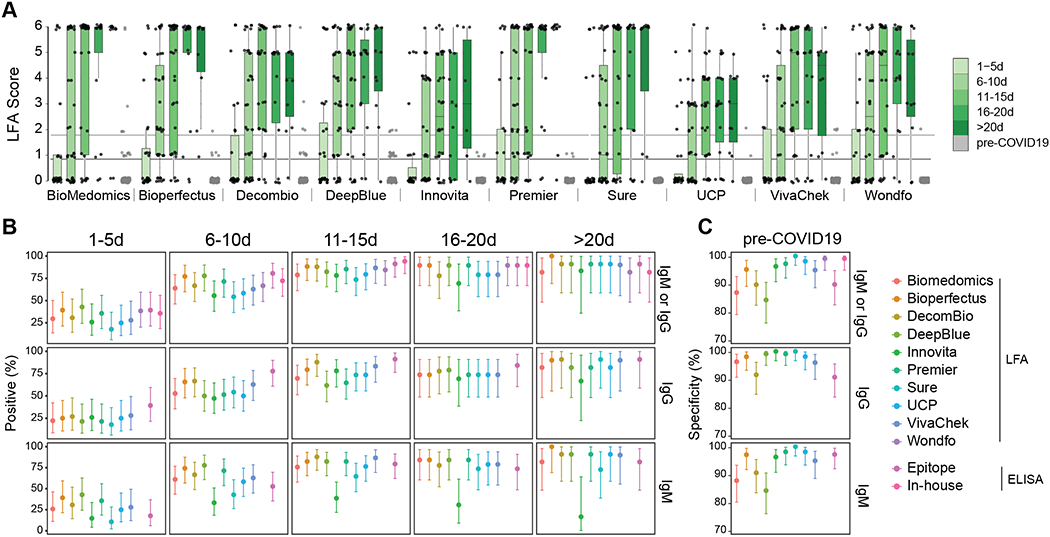
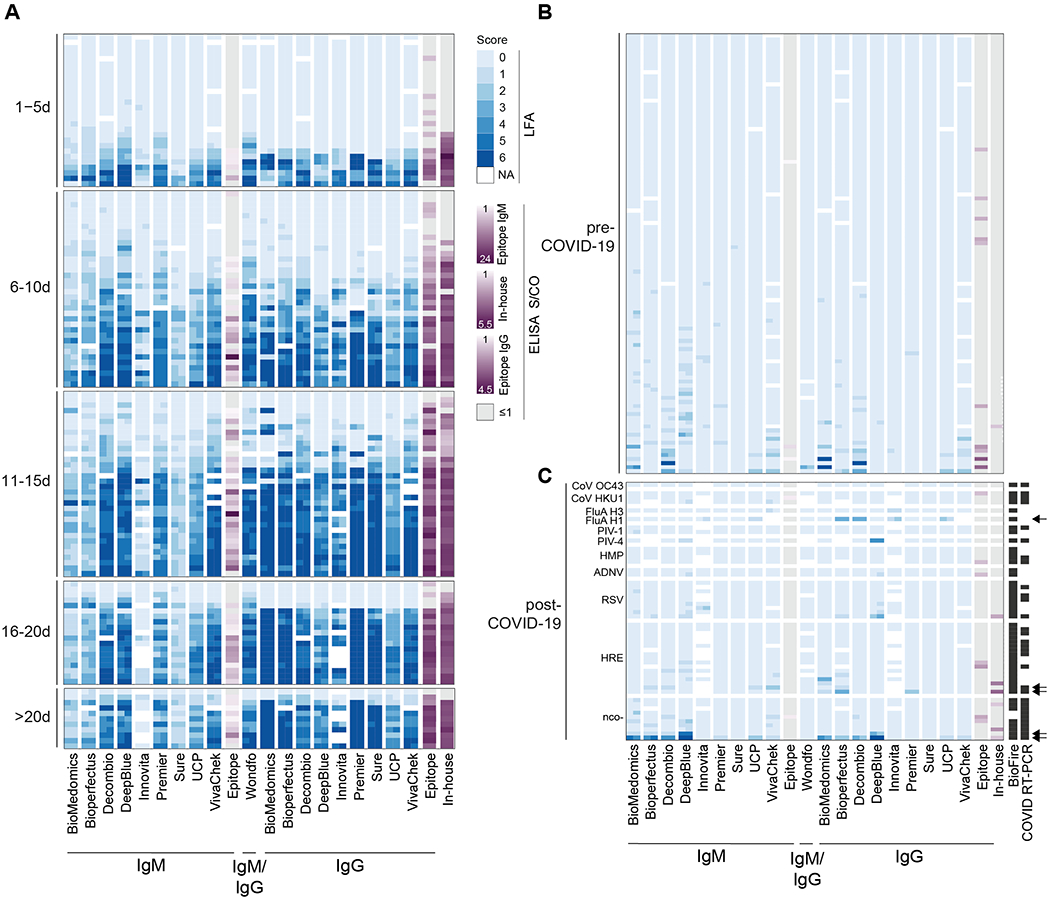
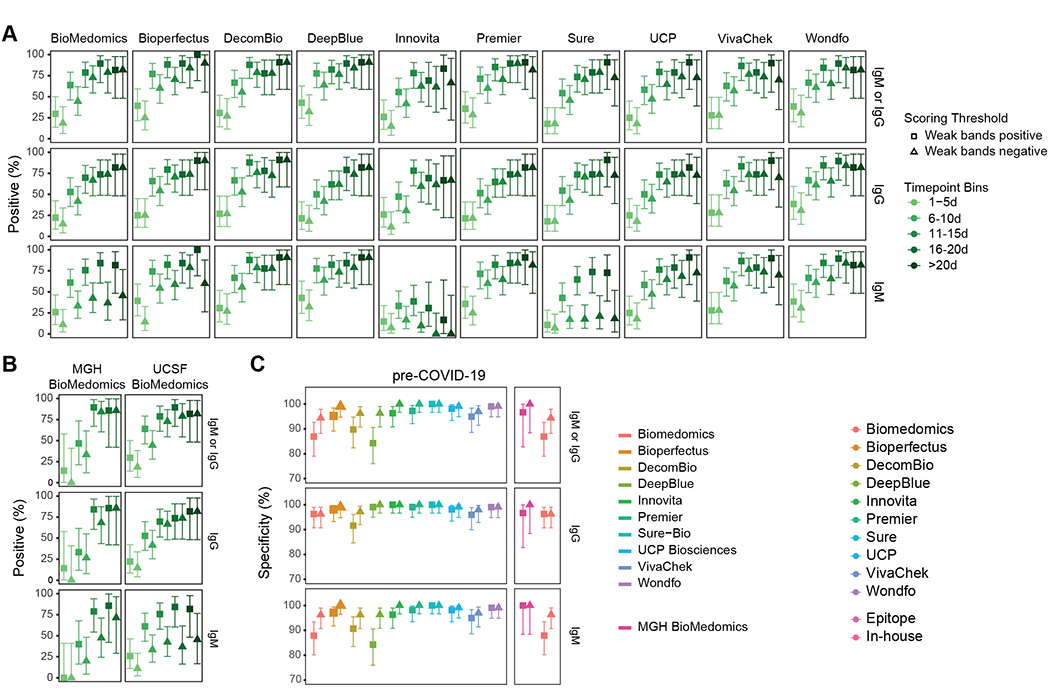
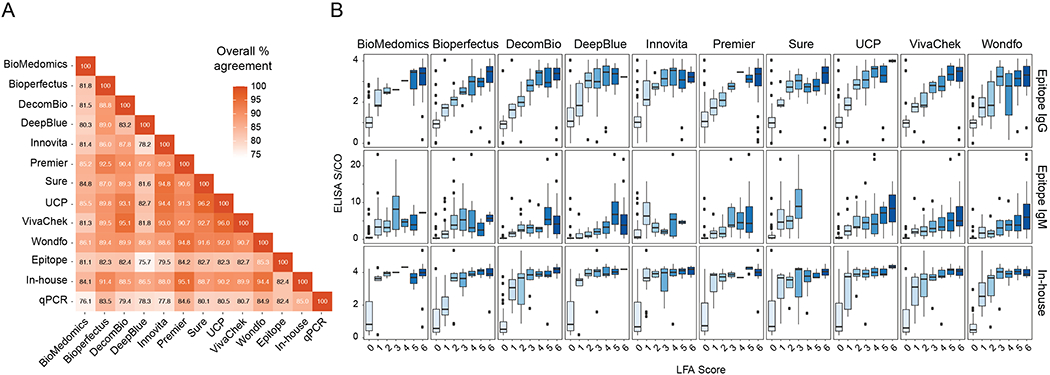
Appropriate use and interpretation of serological tests for assessments of severe acute respiratory syndrome coronavirus 2 (SARS-CoV-2) exposure, infection and potential immunity require accurate data on assay performance. We conducted a head-to-head evaluation of ten point-of-care-style lateral flow assays (LFAs) and two laboratory-based enzyme-linked immunosorbent assays to detect anti-SARS-CoV-2 IgM and IgG antibodies in 5-d time intervals from symptom onset and studied the specificity of each assay in pre-coronavirus disease 2019 specimens. The percent of seropositive individuals increased with time, peaking in the latest time interval tested (>20 d after symptom onset). Test specificity ranged from 84.3% to 100.0% and was predominantly affected by variability in IgM results. LFA specificity could be increased by considering weak bands as negative, but this decreased detection of antibodies (sensitivity) in a subset of SARS-CoV-2 real-time PCR-positive cases. Our results underline the importance of seropositivity threshold determination and reader training for reliable LFA deployment. Although there was no standout serological assay, four tests achieved more than 80% positivity at later time points tested and more than 95% specificity.


Figures

Figure 1:
Figure 1:
Performance data for immunochromatographic lateral flow assays (LFAs). (a) The second reader’s score (0–6 based on band intensity) is reported for each assay, binned by time after patient-reported symptom onset. Biologically independent samples for each test are as follows, n=126, Biomedomics; n=126, Bioperfectus; n=124, Decombio; n=128, DeepBlue; n=114, Innovita; n=127, Premier; n=127, Sure; n=128, UCP; n=119, VivaChek; n=124, Wondfo. Second reader’s score for Pre-COVID-19 samples is also displayed (n=107, Biomedomics; n=104, Bioperfectus; n=107, Decombio; n=108, DeepBlue; n=108, Innovita; n=108, Premier; n=108, Sure; n=107, UCP; n=99, VivaChek; n=106, Wondfo). For tests with separate IgG and IgM bands, the higher score is reported. Joint IgM/IgG signal is represented by a single band in Wondfo. The lower, dark grey line refers to the positivity threshold (Score greater than or equal to 1) used in this study. The upper, light grey line refers to an alternative positivity threshold (Score greater than or equal to 2) discussed in the text and Figure 3. Box spans 25th to 75th percentile with median indicated by black bar; whiskers show maximum and minimum value within 1.5 x the interquartile range from the box. (b) Percent of SARS-CoV-2 RT-PCR-positive samples testing positive by each LFA and ELISA are plotted relative to time after patient-reported symptom onset (n=126, Biomedomics; n=126, Bioperfectus; n=124, Decombio; n=128, DeepBlue; n=114, Innovita; n=127, Premier; n=127, Sure; n=128, UCP; n=119, VivaChek; n=124, Wondfo; n=128, Epitope; n=128, In-house). The ‘IgM or IgG’ category refers to positivity of either isotype. (c) Specificity is plotted for each test using pre-COVID-19 negative control samples (n=107, Biomedomics; n=104, Bioperfectus; n=107, Decombio; n=108, DeepBlue; n=108, Innovita; n=108, Premier; n=108, Sure; n=107, UCP; n=99, VivaChek; n=106, Wondfo; n=108, Epitope; n=108, In-house). For (b,c) all nodes refer to the calculated percent positivity or specificity, respectively. Error bars signify 95% confidence intervals.
Figure 2.
Figure 2.
LFA and ELISA values by serological assay. (a) LFA scores for each of two readers (blue) and mean ELISA S/CO (purple) for each specimen are grouped by binned time after patient-reported symptom onset and plotted by assay. White cells indicate samples not run with the corresponding assay. For ELISAs, grey indicates S/CO less than or equal to 1. The same legend applies to Panels B and C. The F(ab’)2 specific secondary antibody used in our in-house ELISA preferentially binds the IgG light chain but has some reactivity for other isotypes (IgM, IgA). (b) LFA score and ELISA S/CO values are plotted for pre-COVID-19 historical control serum samples to determine assay specificity.(c) LFA score and ELISA S/CO values are plotted for serum samples obtained from 51 individuals after the emergence of COVID-19 (post-COVID-19), some of which received Biofire FilmArray (BioFire Diagnostics, Salt Lake City, UT) and/or SARS-CoV-2 RT-PCR testing (all negative) as indicated (black cells) in the appropriate columns. Arrows highlight specimens from five individuals with moderate to strong band intensity further discussed in the text. Specimens are grouped by positive testing for Coronavirus HKU1 (CoV HKU1), Coronavirus OC43 (CoV OC43), Influenza A Virus A/H3 (FluA H3), Influenza A Virus A/H1 2009 (FluA H1), Parainfluenza Type 1 Virus (PIV-1), Parainfluenza Type 4 Virus (PIV-4), Human Metapneumovirus (HMP), Adenovirus (ADNV), Respiratory Syncytial Virus (RSV), Human Rhinovirus/Enterovirus (HRE), or negative testing for SARS-CoV-2 and other viruses (nco-).
Figure 3.
Figure 3.
Comparison of the effect of different positivity thresholds on percent positivity and specificity. (a) The percent positivity of each assay tested on serum from SARS-CoV-2 RT-PCR-positive patients is plotted by time after patient-reported symptom onset. Biologically independent samples for each test are as follow, n=126, Biomedomics; n=126, Bioperfectus; n=124, Decombio; n=128, DeepBlue; n=114, Innovita; n=127, Premier; n=127, Sure; n=128, UCP; n=119, VivaChek; n=124, Wondfo. Squares indicate percent positivity using Reader Score > 0 (‘Weak bands positive’) as the positivity threshold. Triangles indicate percent positivity using Reader Score > 1 (‘Weak bands negative’) as the positivity threshold. ‘IgM or IgG’ signifies detection of either isotype. Wondfo reports a single band for IgM and IgG together, and the results are plotted here as both ‘IgM’ and ‘IgG’ for horizontal comparison across assays. (b) Comparison of percent positivity at each timepoint for BioMedomics assay at either the MGH (left, n=48) or UCSF (right, n=126) study site using low (square) or high (triangle) positivity thresholds. Note that a weak score at MGH is not directly equivalent to a 1 at UCSF due to difference in reader training. (c) The specificity of all assays on historical pre-COVID-19 serum using low (square) or high (triangle) positivity thresholds. UCSF BioMedomics data is plotted again in the right subpanel column for direct comparison to MGH BioMedomics data. All nodes refer to the calculated percent positivity or specificity (as designated) and all error bars indicate 95% confidence intervals.
Figure 4:
Figure 4:
Agreement of serological assays for SARS-CoV-2. (a) Percent agreement is plotted across all assay combinations, and values signify the binomial regression of the two assays across all tests. Samples were labeled ‘positive’ if any antibody isotype was detected for each assay. (b) IgM or IgG LFA scores for each assay are compared with S/CO from three different ELISAs for all SARS-CoV-2 RT-PCR-positive samples. Biologically independent samples for each test are as follow, n=126, Biomedomics; n=126, Bioperfectus; n=124, Decombio; n=128, DeepBlue; n=114, Innovita; n=127, Premier; n=127, Sure; n=128, UCP; n=119, VivaChek; n=124, Wondfo. Joint IgM/IgG signal is represented by a single band in Wondfo, so data were plotted as IgM or IgG depending on ELISA comparison. The F(ab’)2 specific secondary antibody used in our in-house ELISA preferentially binds the IgG light chain but contains some reactivity for other isotypes (IgM, IgA). For (b), the box spans 25th to 75th percentile with median indicated by black bar; whiskers show maximum and minimum value within 1.5 x the interquartile range from the box.

Update of

  • Test performance evaluation of SARS-CoV-2 serological assays.
    Whitman JD, Hiatt J, Mowery CT, Shy BR, Yu R, Yamamoto TN, Rathore U, Goldgof GM, Whitty C, Woo JM, Gallman AE, Miller TE, Levine AG, Nguyen DN, Bapat SP, Balcerek J, Bylsma SA, Lyons AM, Li S, Wong AW, Gillis-Buck EM, Steinhart ZB, Lee Y, Apathy R, Lipke MJ, Smith JA, Zheng T, Boothby IC, Isaza E, Chan J, Acenas DD 2nd, Lee J, Macrae TA, Kyaw TS, Wu D, Ng DL, Gu W, York VA, Eskandarian HA, Callaway PC, Warrier L, Moreno ME, Levan J, Torres L, Farrington LA, Loudermilk R, Koshal K, Zorn KC, Garcia-Beltran WF, Yang D, Astudillo MG, Bernstein BE, Gelfand JA, Ryan ET, Charles RC, Iafrate AJ, Lennerz JK, Miller S, Chiu CY, Stramer SL, Wilson MR, Manglik A, Ye CJ, Krogan NJ, Anderson MS, Cyster JG, Ernst JD, Wu AHB, Lynch KL, Bern C, Hsu PD, Marson A. Whitman JD, et al. medRxiv [Preprint]. 2020 May 17:2020.04.25.20074856. doi: 10.1101/2020.04.25.20074856. medRxiv. 2020. Update in: Nat Biotechnol. 2020 Oct;38(10):1174-1183. doi: 10.1038/s41587-020-0659-0. PMID: 32511497 Free PMC article. Updated. Preprint.

References

    1. Johns Hopkins University. COVID-19 Dashboard by the Center for Systems Science and Engineering (CSSE) at Johns Hopkins University (JHU), <https://gisanddata.maps.arcgis.com/apps/opsdashboard/index.html#/bda7594...> (2020).
    1. Infectious Diseases Society of America. IDSA Statement on COVID-19 Testing, <https://www.idsociety.org/globalassets/idsa/public-health/covid-19-idsa-...> (2020).
    1. Weitz JS et al. Modeling shield immunity to reduce COVID-19 epidemic spread. Nat Med, doi:10.1038/s41591-020-0895-3 (2020). - DOI - PMC - PubMed
    1. World Health Organization. Laboratory testing for coronavirus disease 2019 (COVID-19) in suspected human cases: interim guidance, 2 March 2020. (World Health Organization, Geneva, 2020).
    1. Zhao J et al. Antibody responses to SARS-CoV-2 in patients of novel coronavirus disease 2019. Clin Infect Dis, doi:10.1093/cid/ciaa344 (2020). - DOI - PMC - PubMed

METHODS-ONLY REFERENCES

    1. Whitman JD et al. Chagas disease serological test performance in United States blood donor specimens. Journal of clinical microbiology, doi:10.1128/JCM.01217-19 (2019). - DOI - PMC - PubMed

Publication types

MeSH terms