

Geospatial Analysis of Neighborhood Deprivation Index (NDI) for the United States by County
- PMID: 32855653
- PMCID: PMC7447192
- DOI: 10.1080/17445647.2020.1750066
Geospatial Analysis of Neighborhood Deprivation Index (NDI) for the United States by County
Abstract
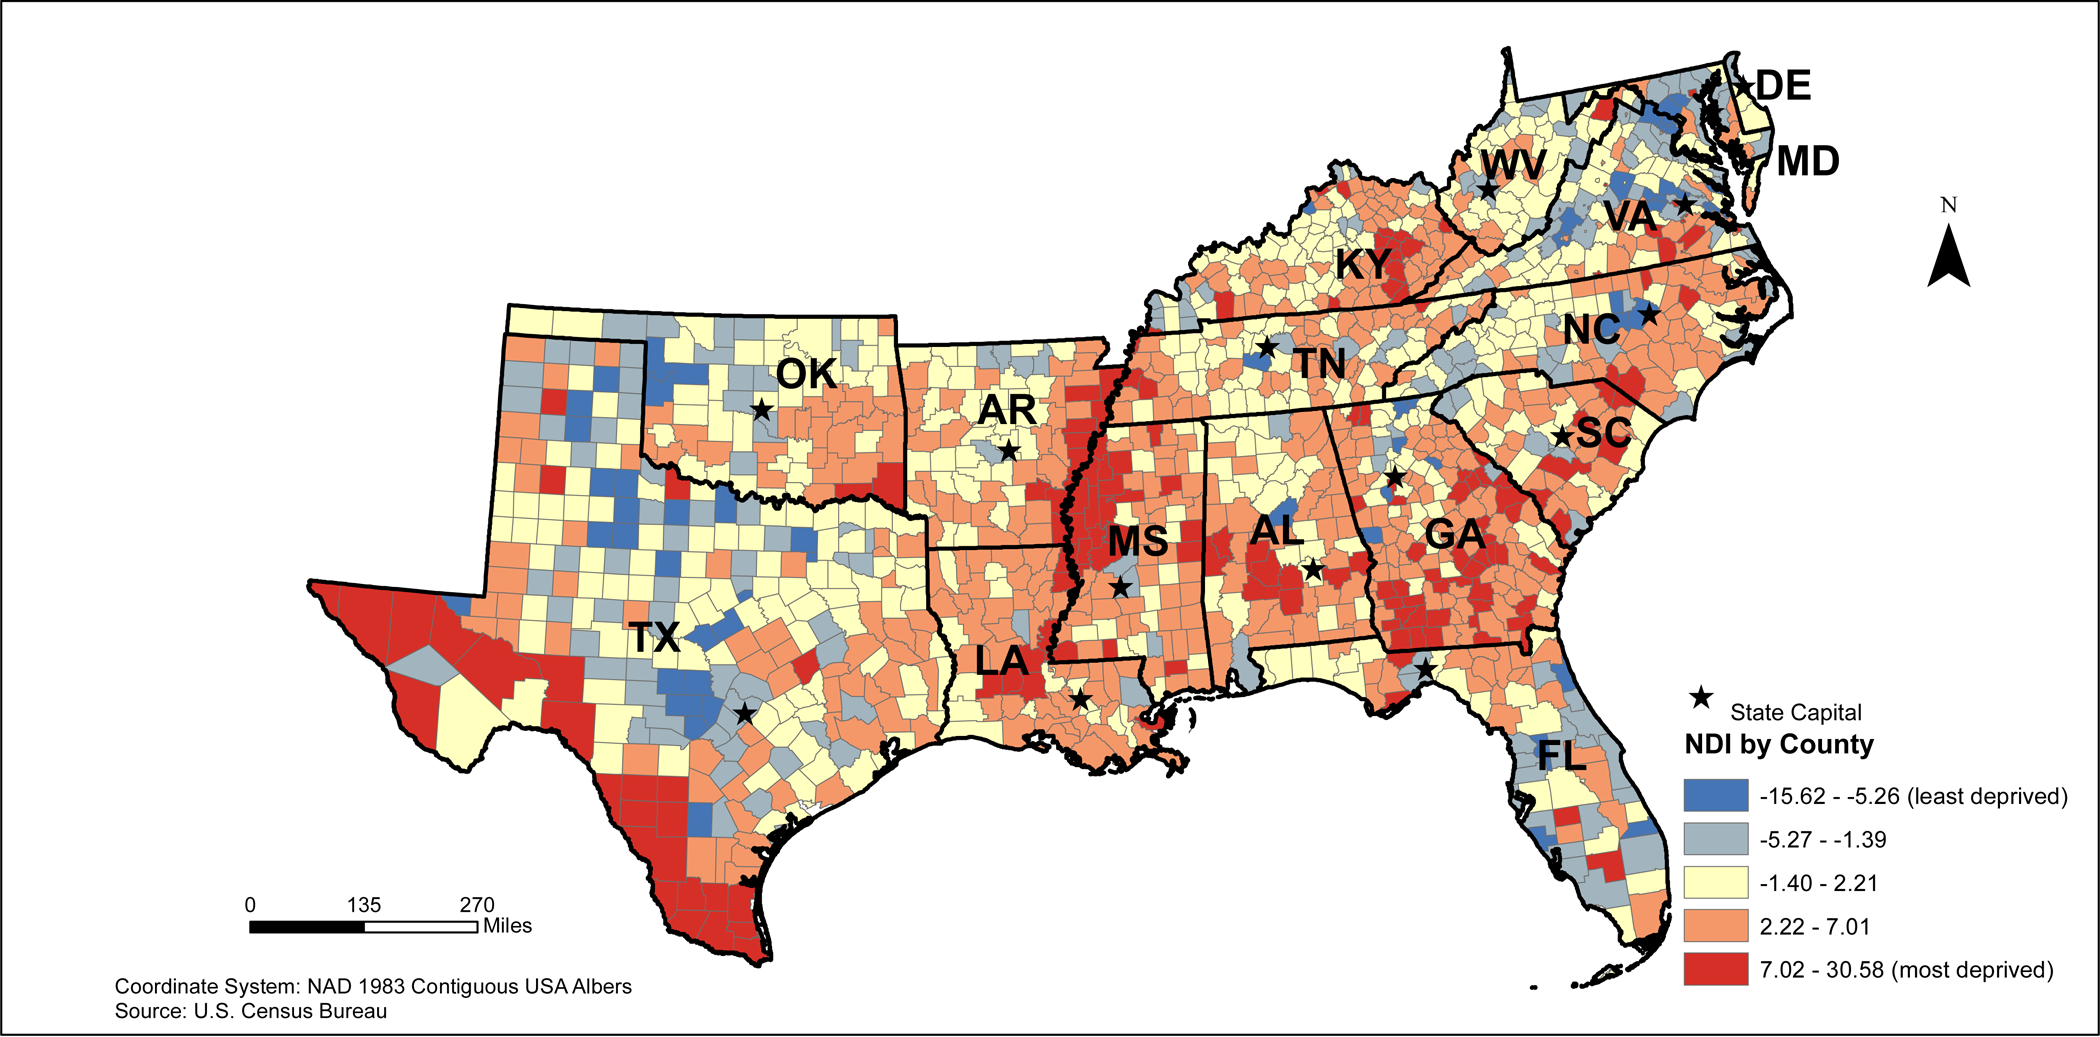
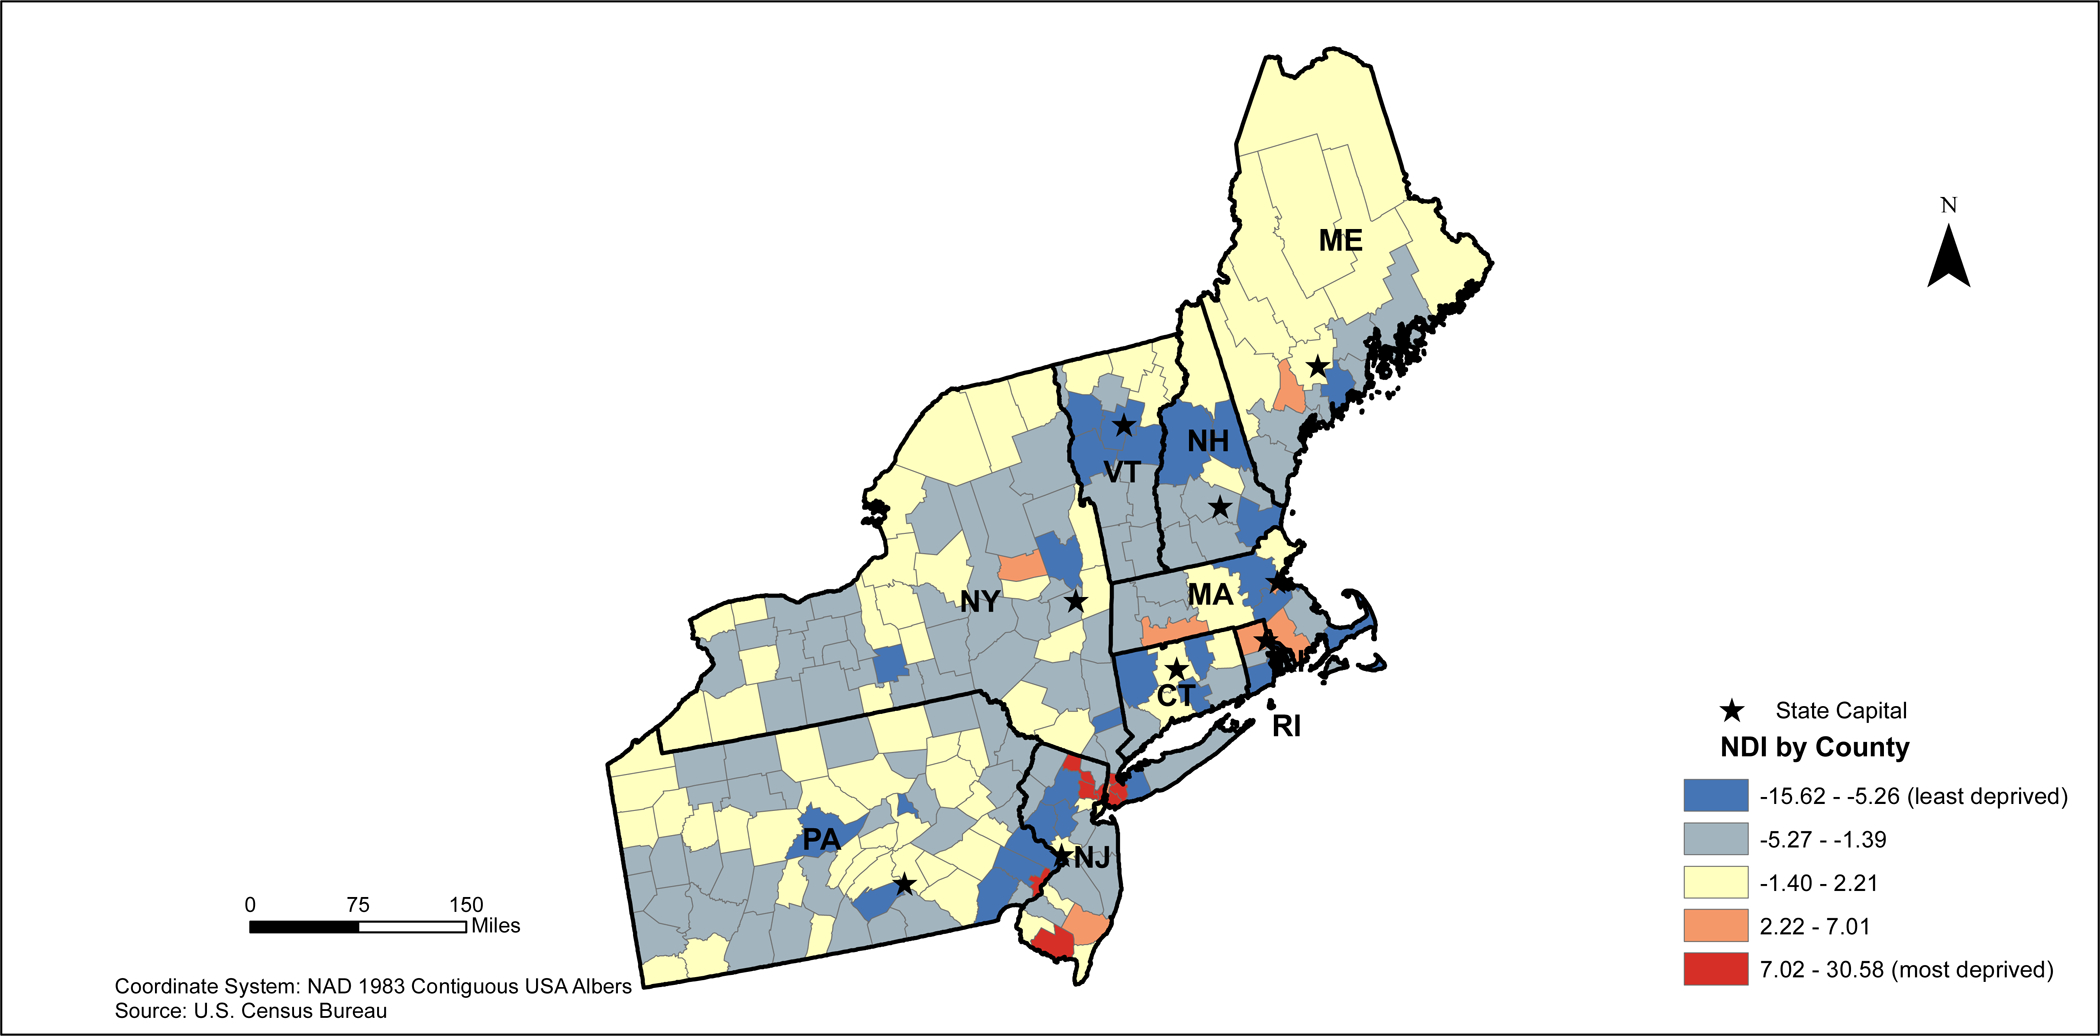
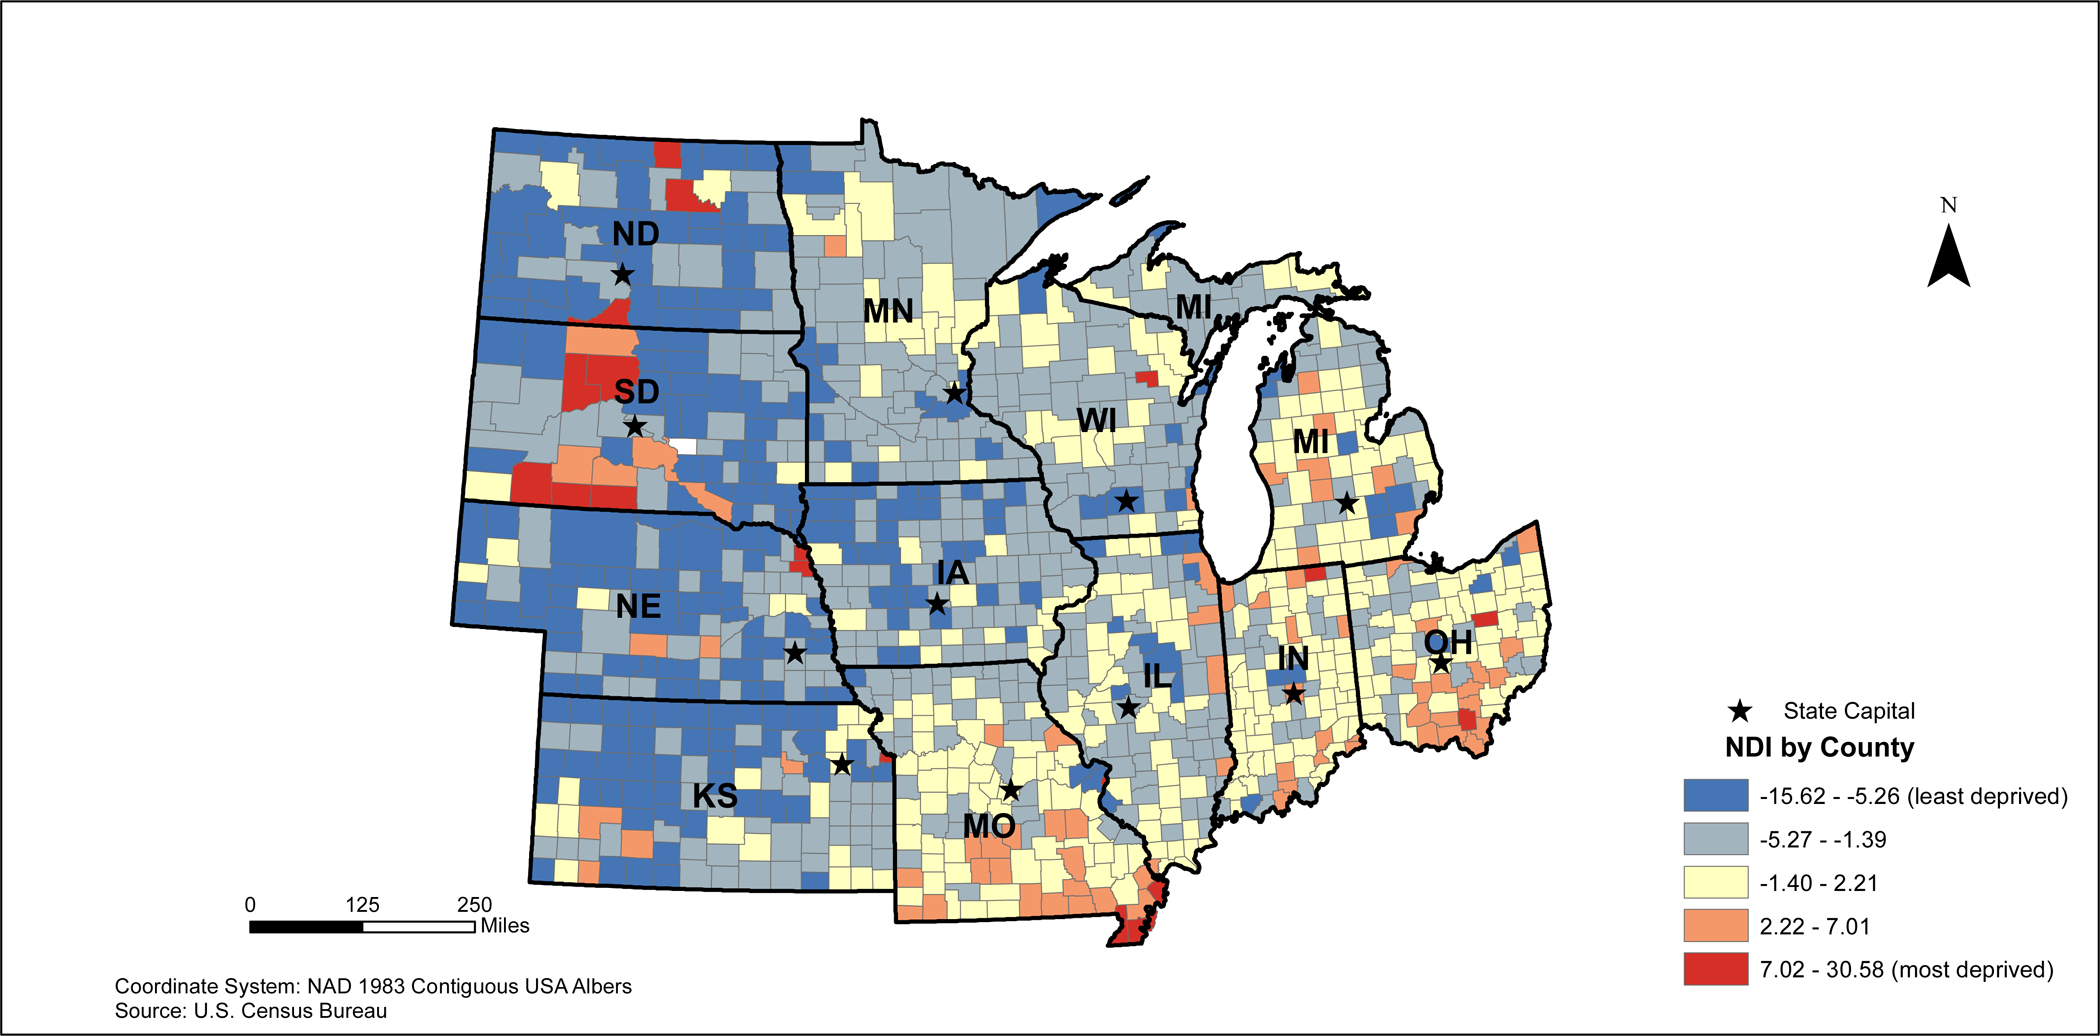
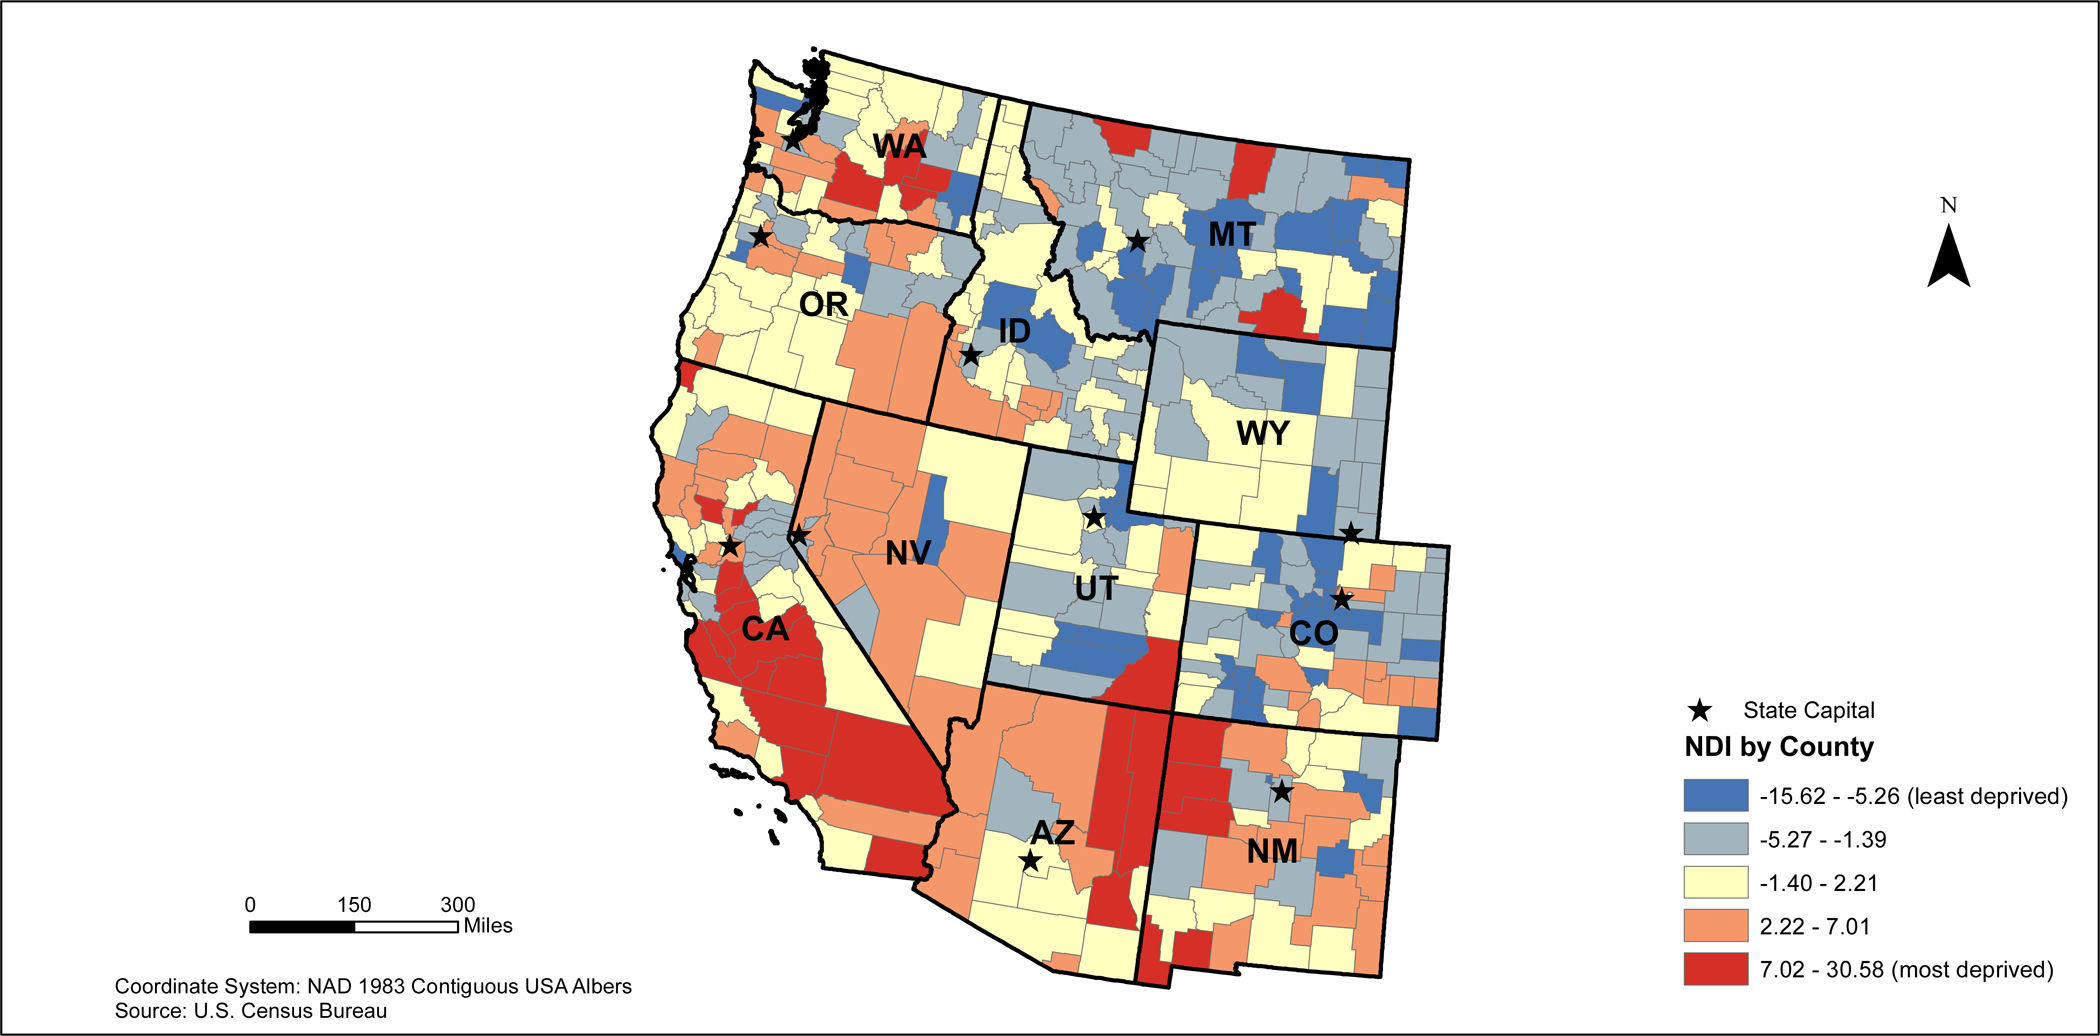
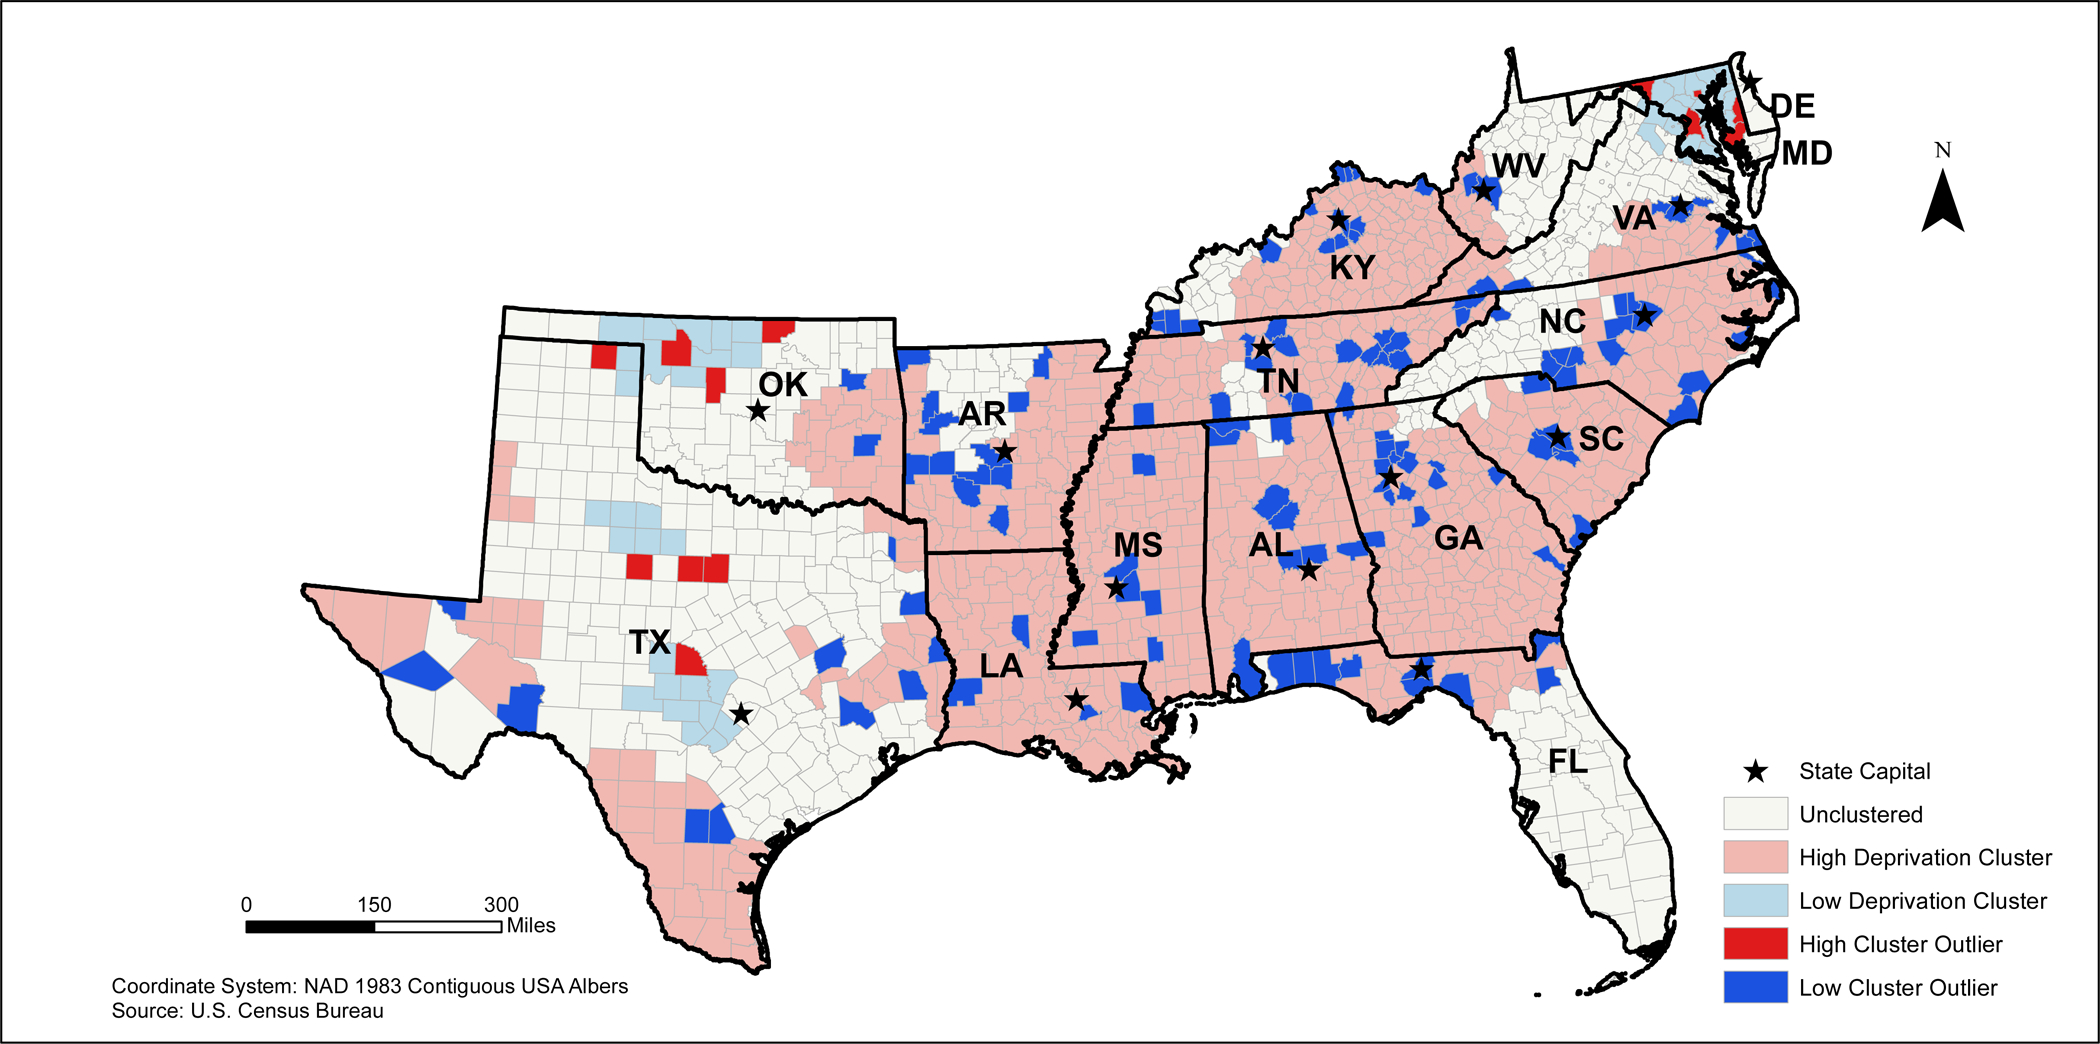
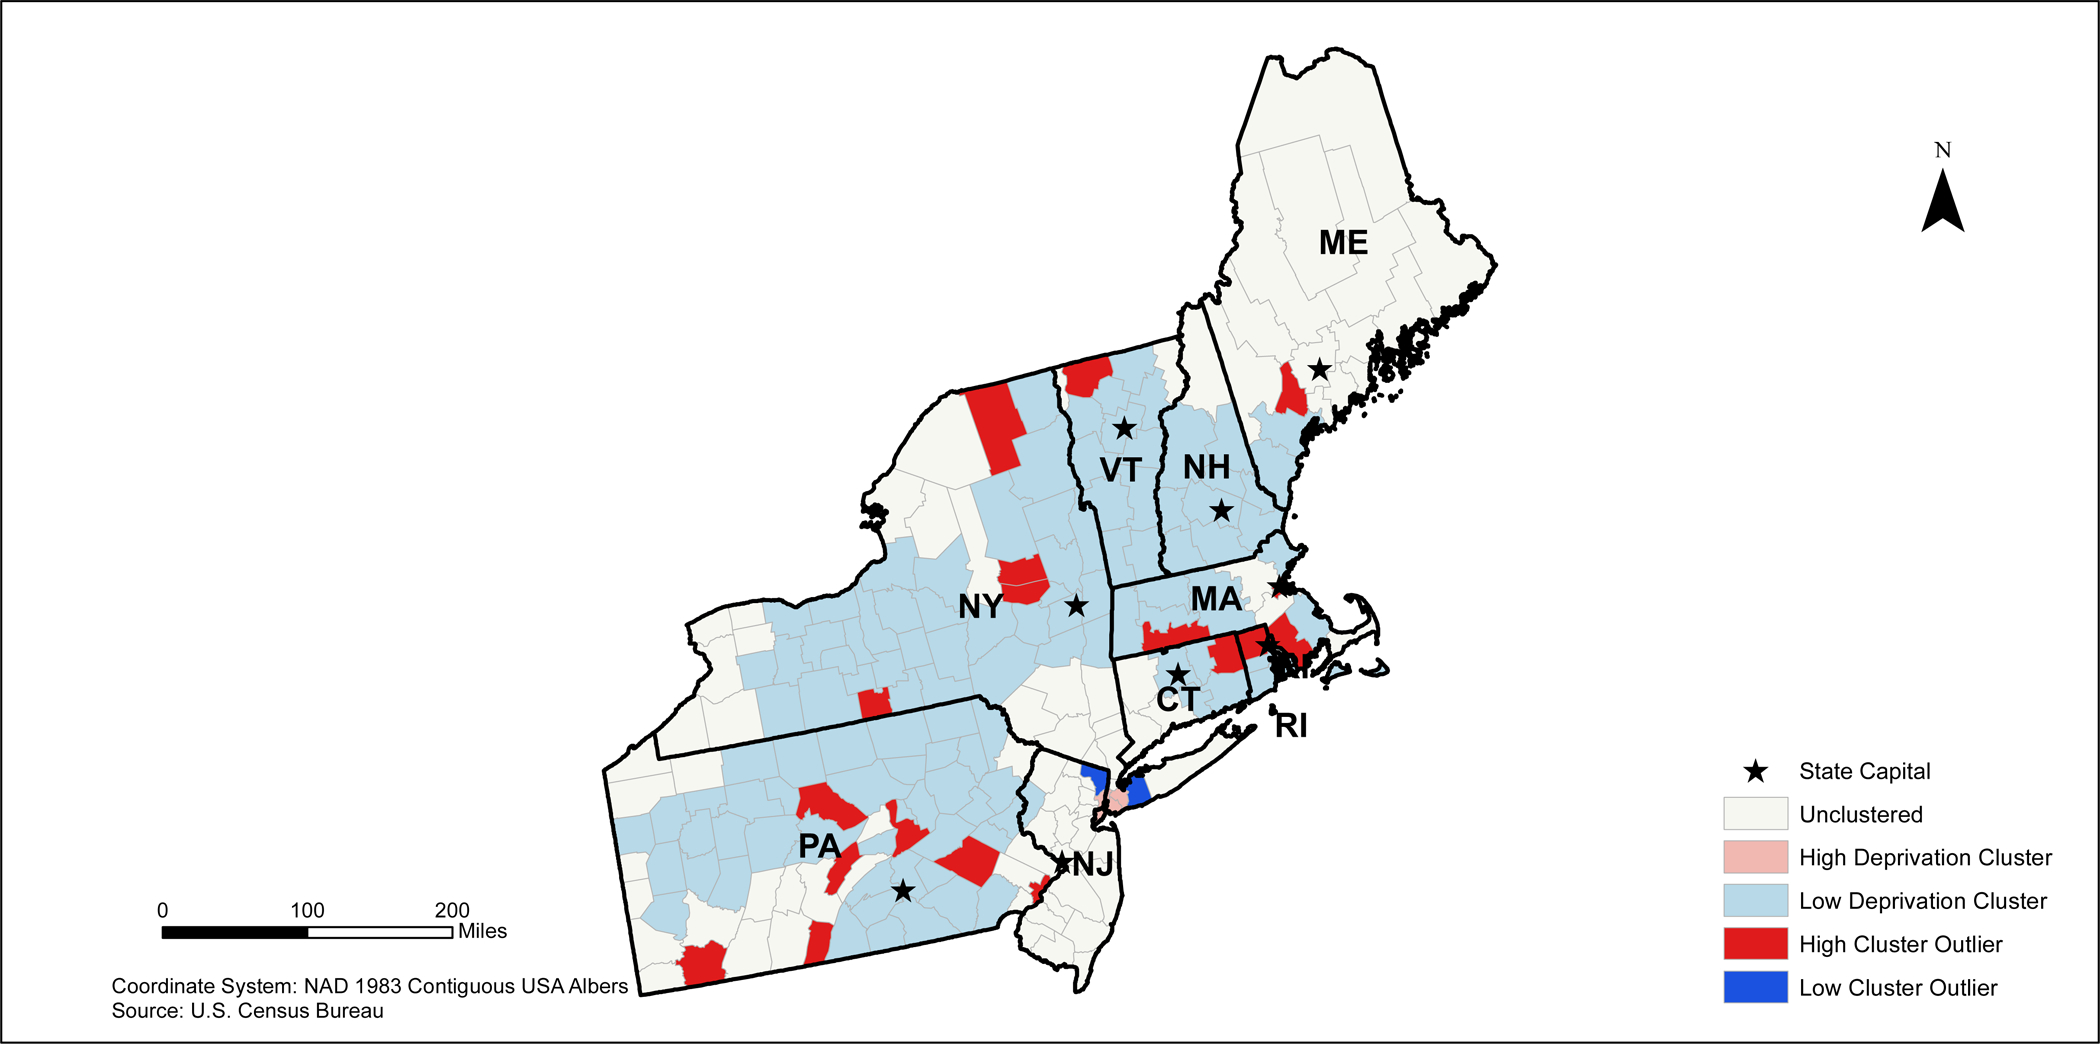
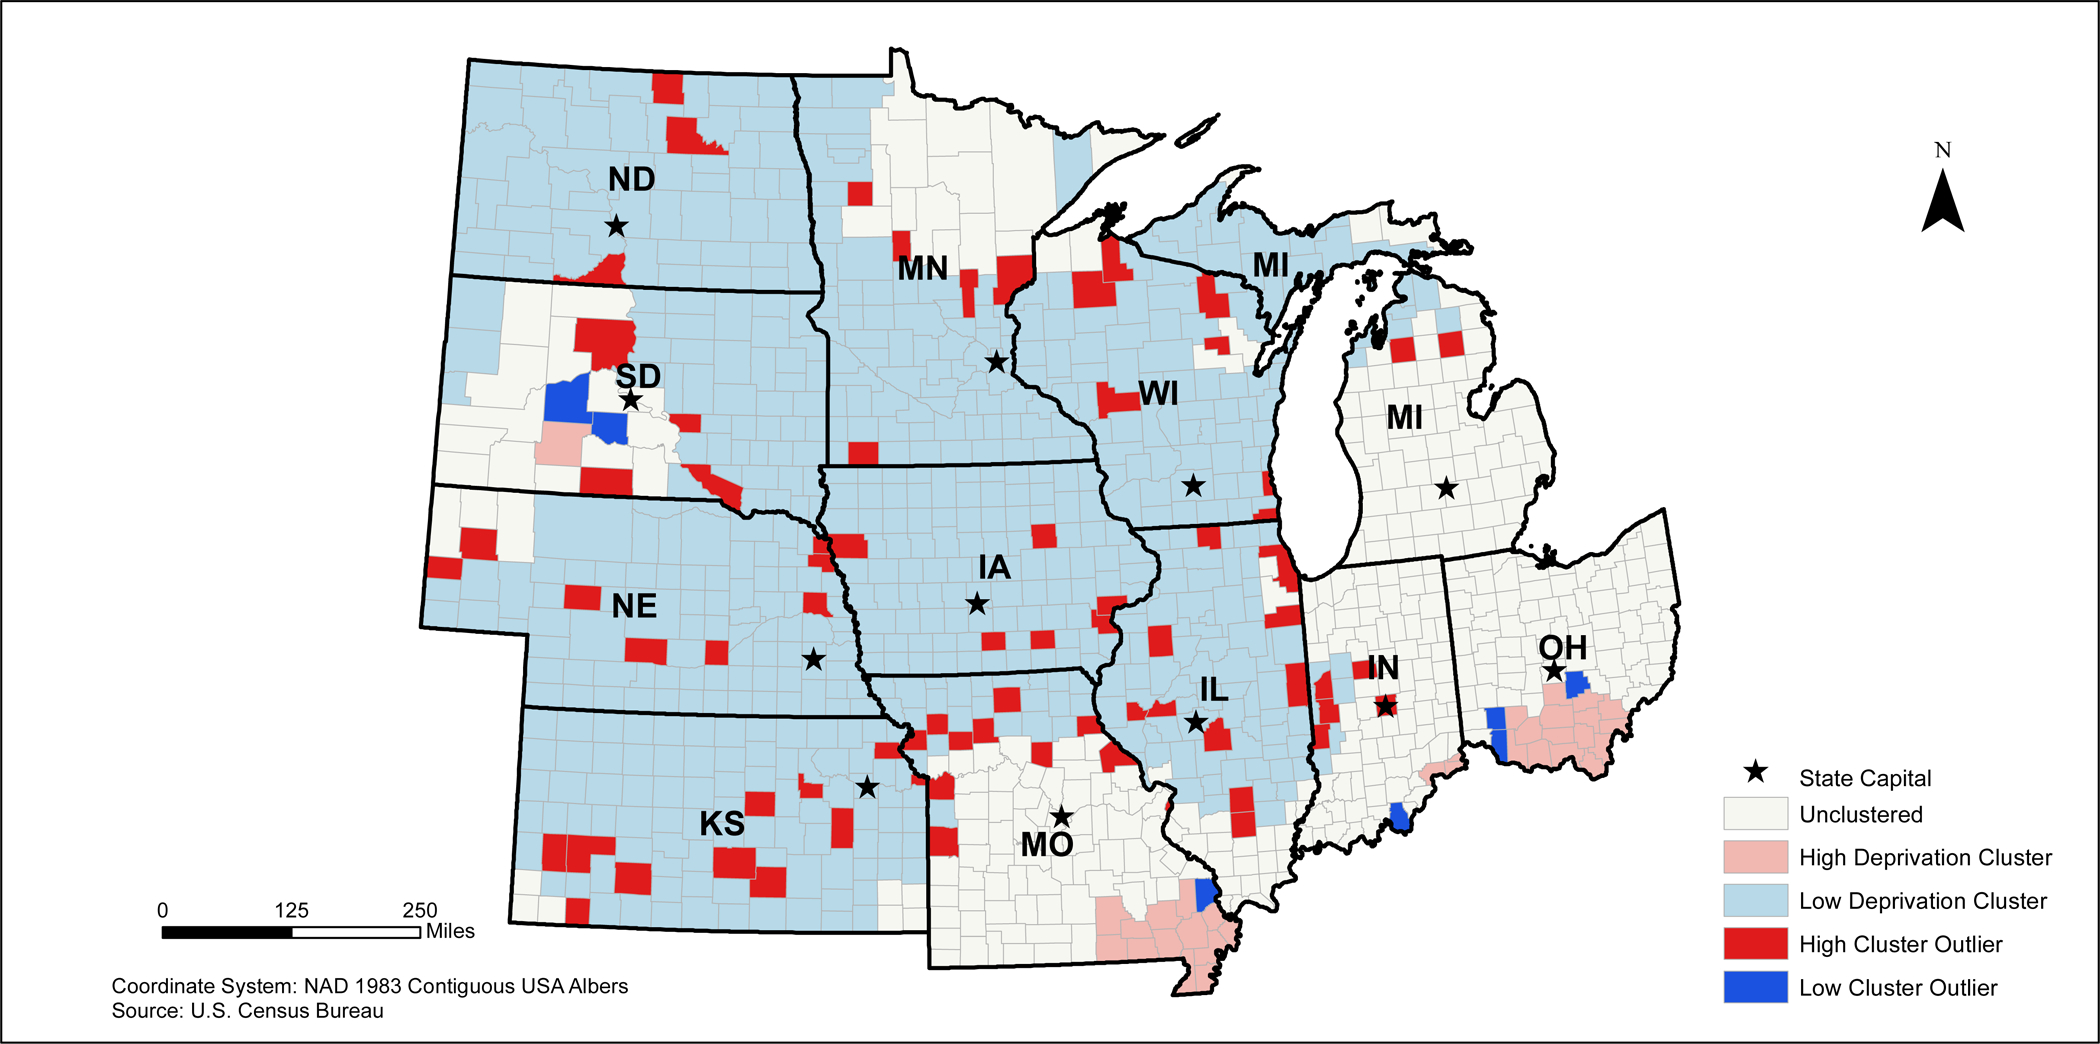
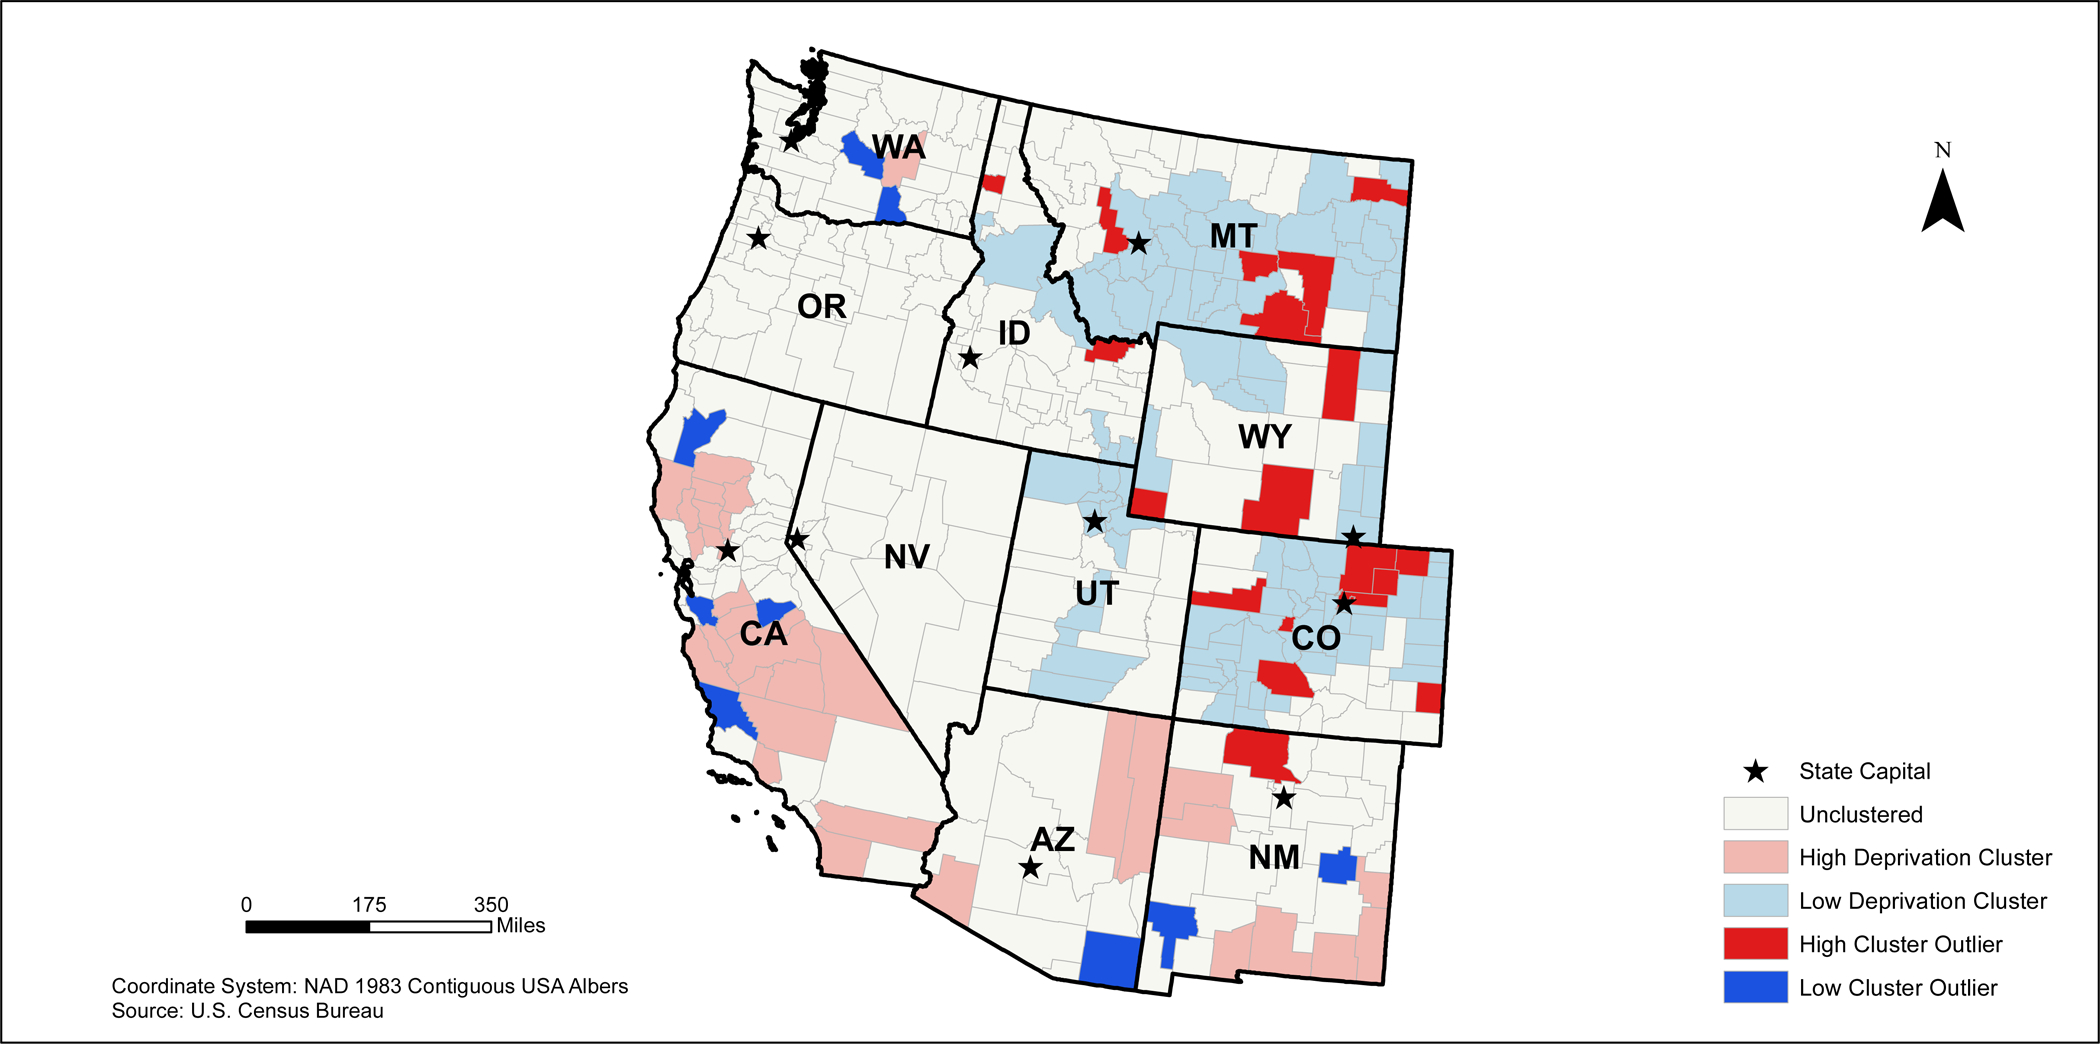
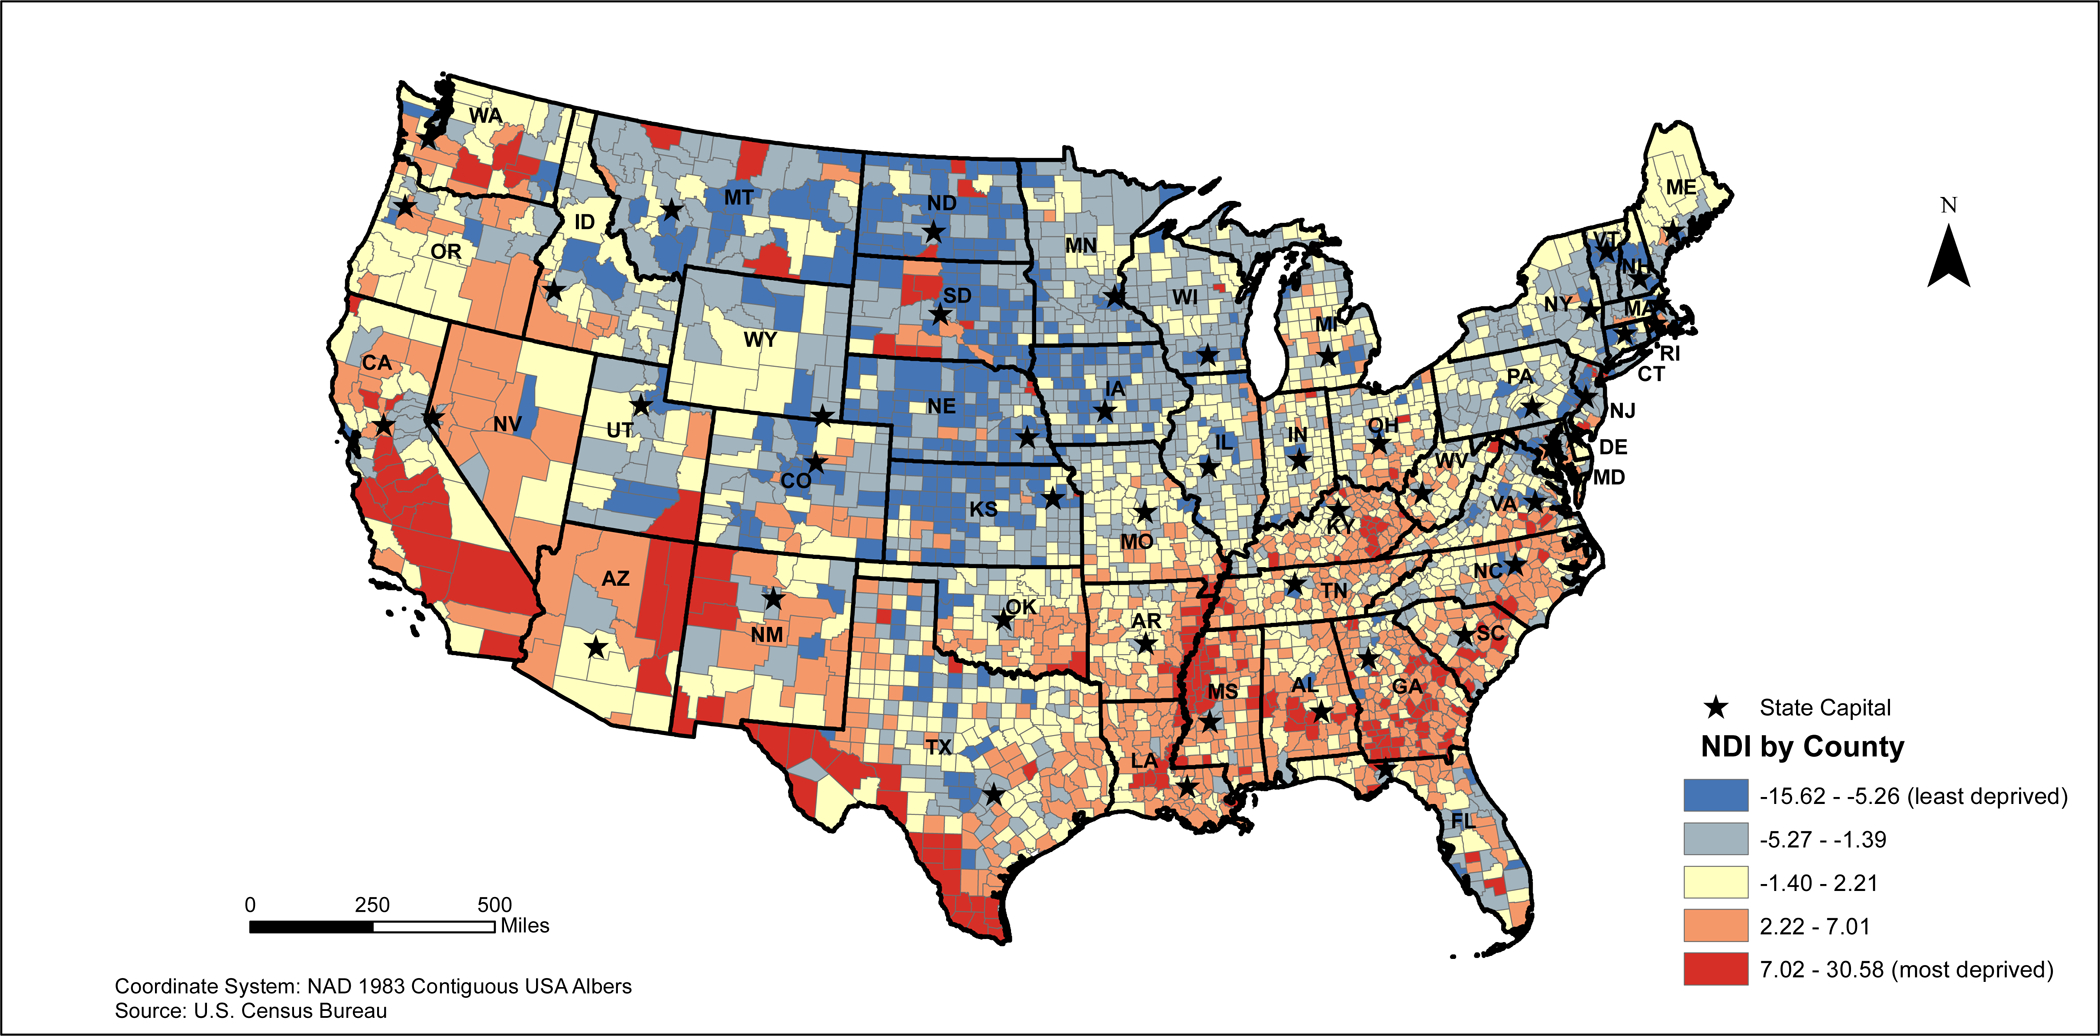
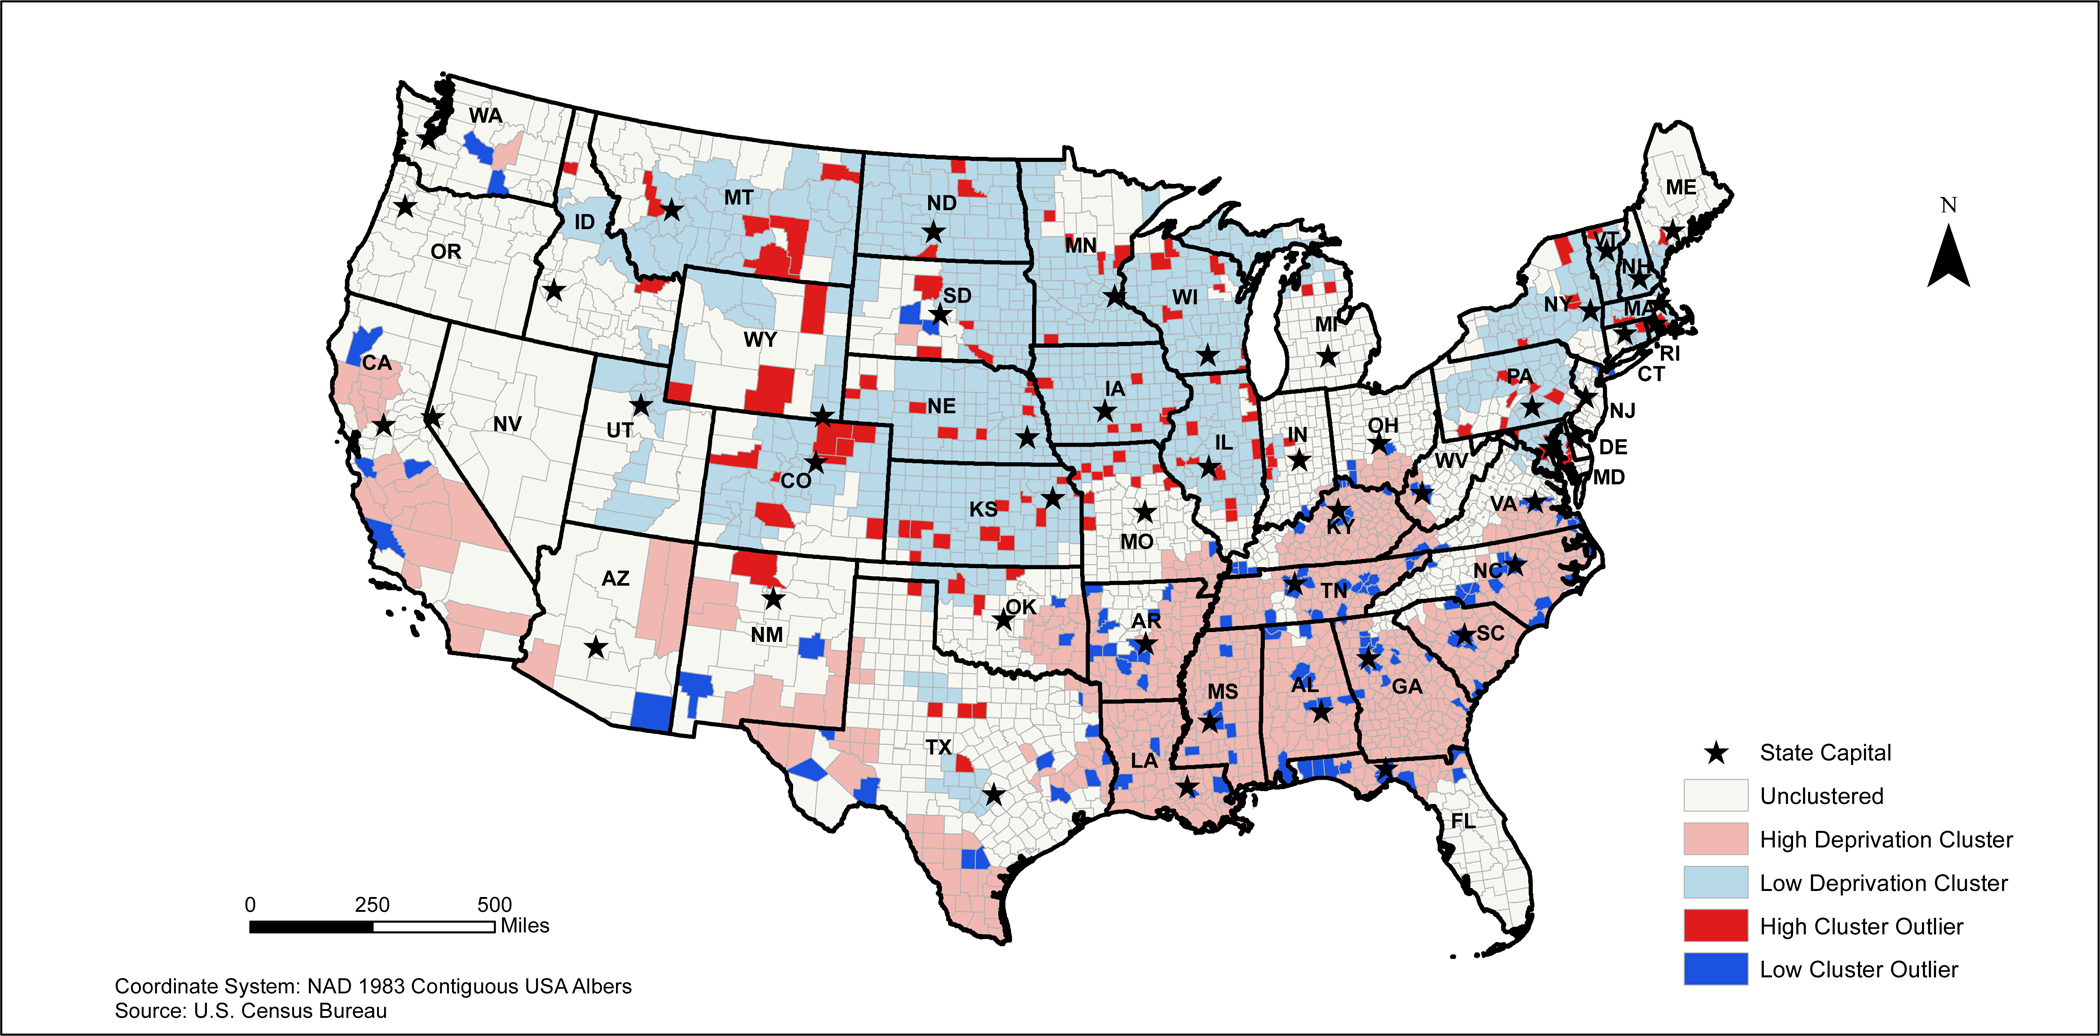
Little is known about the spatial clustering of neighborhood deprivation across the United States (U.S.). Using data from the 2010 U.S. Census Bureau, we created a neighborhood deprivation index (NDI: higher NDI indicates higher deprivation/ lower neighborhood socioeconomic status) for each county within the U.S. County level scores were loaded into ArcGIS 10.5.1 where they were mapped and analyzed using Moran's I and Anselin Local Moran's I. Ultimately, NDI varies spatially across the US. The highest NDI scores were found in the Southeastern and Southwestern U.S. states, and inland regions of Southern California. This information is critical for public health initiative development as planners may need to tailor the scale of their efforts based on the higher NDI neighborhoods of the county or geographic region with potentially greater chronic disease burden.
Keywords: applied spatial statistics; health disparities; health policy; neighborhood deprivation index; socioeconomic status.
Conflict of interest statement
Conflict of Interest: none.
Figures
References
-
- Diez Roux AV, Mair C, Roux AVD, Mair C, Diez Roux AV, Mair C. Neighborhoods and health. Ann N Y Acad Sci [Internet]. 2010;1186:125–145. Available from: http://search.ebscohost.com/login.aspx?direct=true&db=a9h&AN=48116272&si... - PubMed
-
- Commission on the Social Determinants of Health. Closing the gap in a generation: Health equity through action on the social determinants of health. Final Rep Comm Soc … [Internet]. 2008;246 Available from: https://scholar.google.co.in/scholar?q=closing+the+gap+in+a+generation&b...
-
- Diez-Roux AV, Nieto FJ, Caulfield L, Tyroler HA, Watson RL, Szklo M. Neighbourhood differences in diet: the Atherosclerosis Risk in Communities (ARIC) Study. J Epidemiol Community Heal [Internet]. 1999;53:55–63. Available from: http://www.ncbi.nlm.nih.gov/pubmed/10326055 - PMC - PubMed
Grants and funding
LinkOut - more resources
Full Text Sources
Other Literature Sources