

Comparison of Current Optical Coherence Tomography Angiography Methods in Imaging Retinal Hemangioblastomas
- PMID: 32855859
- PMCID: PMC7422766
- DOI: 10.1167/tvst.9.8.12
Comparison of Current Optical Coherence Tomography Angiography Methods in Imaging Retinal Hemangioblastomas
Abstract
Purpose: To compare spectral-domain (SD) and swept-source (SS) optical coherence tomography angiography (OCTA) for imaging retinal capillary hemangioblastomas (RCHs) in von Hippel-Lindau disease (VHLD).
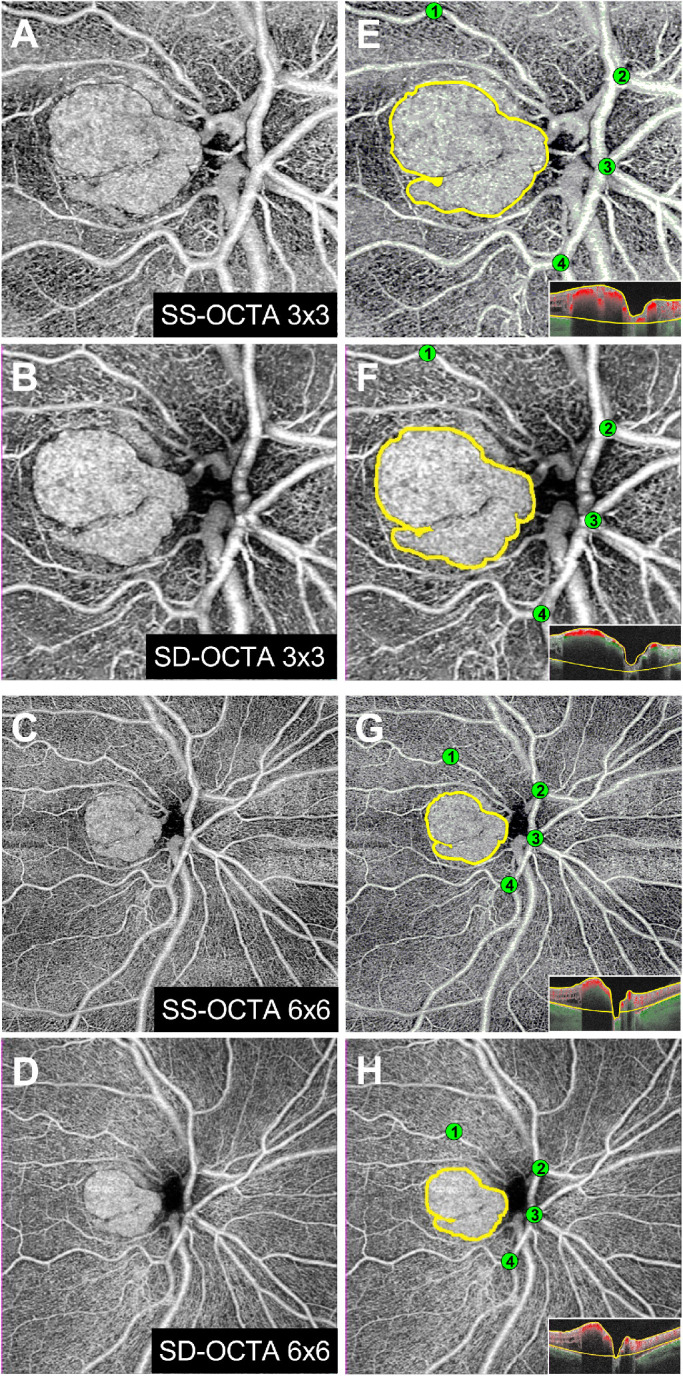
Methods: Prospective single-center cross-sectional study. Tumor size (TS) of perfused RCHs was assessed clinically in relation to the optic disc size. For both technologies, SD-OCTA and SS-OCTA, corresponding images with a scan size of 3 × 3 mm2 and 6 × 6 mm2, respectively, were overlaid according to the set of marker positions to determine the TS.
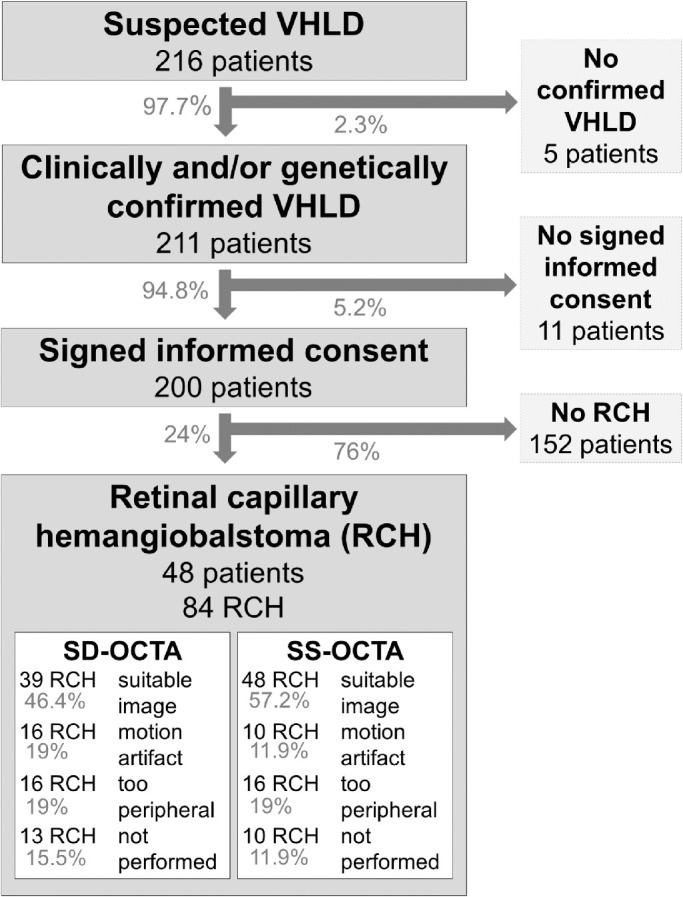
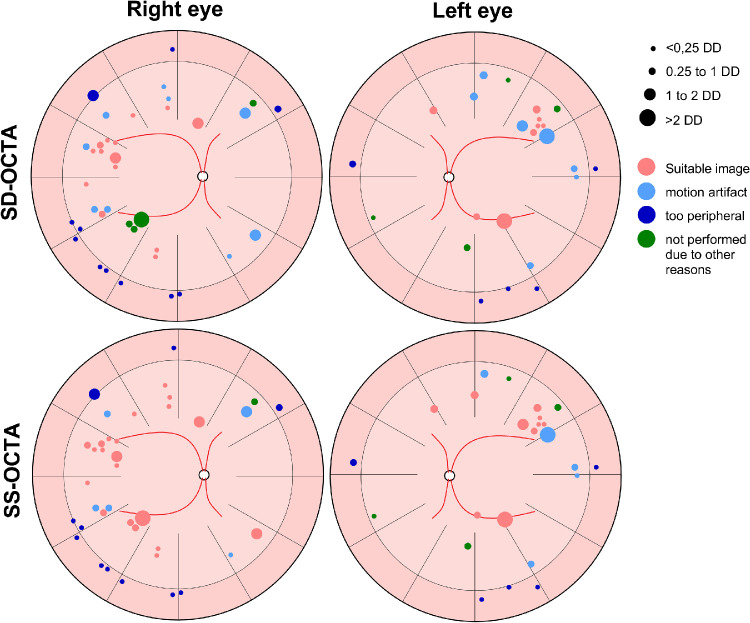
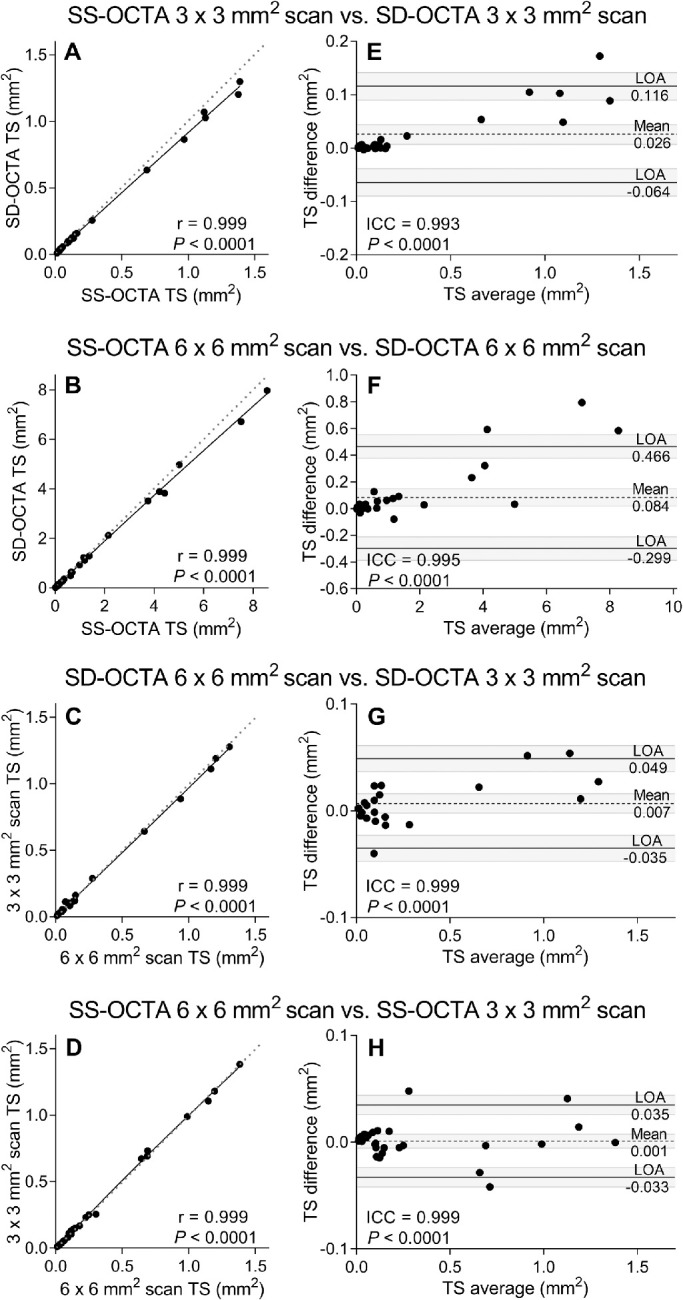
Results: From 200 patients with VHLD, 48 patients showed 84 RCHs. SD-OCTA images of 39 RCHs (46.4%) and SS-OCTA images of 48 RCHs (57.2%) were suitable for analysis. The average in OCTA-measured TS of 1.60 ± 2.58 mm2 (range, 0.01-10.43) was congruent to the clinically assessed TS in 81.3% of cases (r = 0.86, P < 0.0001). TS measured in SD-OCTA compared to SS-OCTA showed similar values and a high correlation (all P < 0.0001). Nevertheless, despite the similarities, a slight trend in SS-OCTA was observed whereby with increasing TS, an elevated TS was detected compared to SD-OCTA (3 × 3-mm2 scans: mean difference of 0.03 ± 0.04 mm2, 6 × 6-mm2 scans: 0.08 ± 0.19 mm2). However, within the same imaging technology method, TS values almost did not differ (SD-OCTA: mean difference of 0.01 ± 0.02 mm2, SS-OCTA: 0.001 ± 0.01 mm2).
Conclusions: OCTA may serve as an additional tool for diagnosis and monitoring of RCHs. Nevertheless, due to the differences between the technologies, the values cannot be used interchangeably.
Translational relevance: SD-OCTA and SS-OCTA are suitable to detect and monitor RCHs and provide a more detailed assessment about the TS than this is clinically possible.
Keywords: OCT angiography; retinal capillary hemangioblastoma; spectral domain optical coherence tomography angiography; swept-source optical coherence tomography angiography; von Hippel-Lindau disease.
Copyright 2020 The Authors.
Conflict of interest statement
Disclosure: M. Reich, None; A. Glatz, None; D. Boehringer, None; C. Evers, None; M. Daniel, None; F. Bucher, None; F. Ludwig, None; S. Nuessle, None; W.A. Lagrèze, None; P.M. Maloca, None; C. Lange, None; T. Reinhard, None; H. Agostini, None; S.J. Lang, None
Figures
References
-
- Koustenis A Jr, Harris A, Gross J, Januleviciene I, Shah A, Siesky B. Optical coherence tomography angiography: an overview of the technology and an assessment of applications for clinical research. Br J Ophthalmol. 2017; 101: 16–20. - PubMed
-
- Ferrara D, Waheed NK, Duker JS. Investigating the choriocapillaris and choroidal vasculature with new optical coherence tomography technologies. Prog Retin Eye Res. 2016; 52: 130–155. - PubMed
Publication types
MeSH terms
LinkOut - more resources
Full Text Sources
