

Bayesian cure-rate survival model with spatially structured censoring
- PMID: 32855903
- PMCID: PMC7449293
- DOI: 10.1016/j.spasta.2018.08.007
Bayesian cure-rate survival model with spatially structured censoring
Abstract
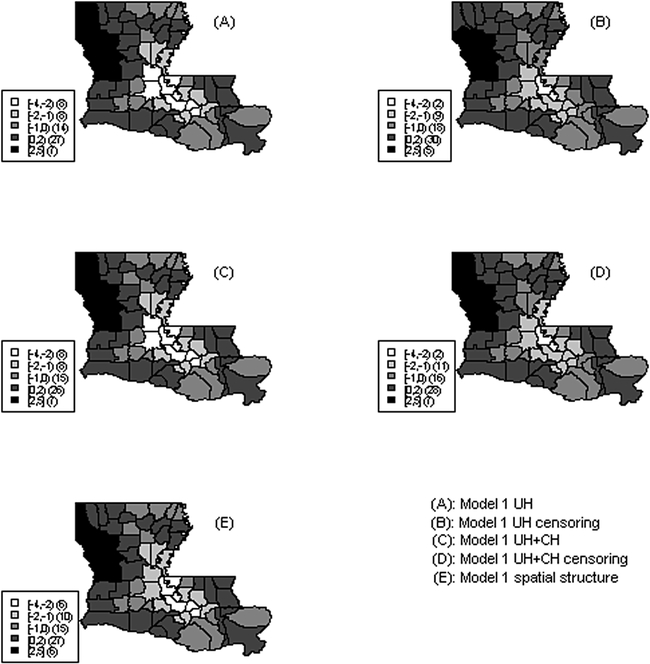
We propose a Bayesian spatial model for time-to-event data in which we allow the censoring mechanism to depend on covariates and have a spatial structure. The survival model incorporates a cure rate fraction and assumes that the time-to-event follows a Weibull distribution, with covariates such as race, stage, grade, marital status and age at diagnosis being linked to its scale parameter. With right censoring being a primary concern, we consider a joint logistic regression model for the death versus censoring indicator, allowing dependence on covariates and including a spatial structure via the use of random effects. We apply the models to examine prostate cancer data from the Surveillance, Epidemiology, and End Results (SEER) registry, which displays marked spatial variation.
Keywords: Bayesian hierarchical models; Markov chain Monte Carlo; cure rate; prostate cancer; spatial analysis.
Figures

Similar articles
-
A hierarchical Bayesian analysis for bivariate Weibull distribution under left-censoring scheme.J Appl Stat. 2023 Jul 16;51(9):1772-1791. doi: 10.1080/02664763.2023.2235093. eCollection 2024. J Appl Stat. 2023. PMID: 38933141 Free PMC article.
-
Spatially explicit survival modeling for small area cancer data.J Appl Stat. 2018;45(3):568-585. doi: 10.1080/02664763.2017.1288200. Epub 2017 Feb 11. J Appl Stat. 2018. PMID: 30906096 Free PMC article.
-
Mixture and non-mixture cure fraction models based on the generalized modified Weibull distribution with an application to gastric cancer data.Comput Methods Programs Biomed. 2013 Dec;112(3):343-55. doi: 10.1016/j.cmpb.2013.07.021. Epub 2013 Aug 6. Comput Methods Programs Biomed. 2013. PMID: 24008248
-
A Bayesian piecewise survival cure rate model for spatially clustered data.Spat Spatiotemporal Epidemiol. 2019 Jun;29:149-159. doi: 10.1016/j.sste.2019.02.001. Epub 2019 Feb 7. Spat Spatiotemporal Epidemiol. 2019. PMID: 31128624
-
Multivariate parametric spatiotemporal models for county level breast cancer survival data.Lifetime Data Anal. 2005 Mar;11(1):5-27. doi: 10.1007/s10985-004-5637-1. Lifetime Data Anal. 2005. PMID: 15747587 Review.
References
-
- Rossouw JE, Anderson GL, Prentice RL, LaCroix AZ, Kooperberg C, Stefanick ML, Jackson RD, Beresford SA, Howard BV, Johnson KC, Kotchen JM, Ockene J, Writing Group for the Women’s Health Initiative Investigators. Risks and benefits of estrogen plus progestin in healthy postmenopausal women: principal results from the women’s health initiative randomized controlled trial. JAMA 2002; 288(3): 321–333. - PubMed
-
- Assael BM, Castellani C, Ocampo MB, Iansa P, Callegaro A, Valsecchi MG. Epidemiology and survival analysis of cystic fibrosis in an area of intense neonatal screening over 30 years. Am J Epidemiol 2002; 156(5): 397–401. - PubMed
-
- Berkson J and Gage RP. Survival curve for cancer patients following treatment. J Am Statist Assoc 1959; 47(259): 501–515.
-
- Farewell VT. The use of mixture models for the analysis of survival data with long term survivors. Biometrics 1982; 38(4): 1041–1046. - PubMed
Grants and funding
LinkOut - more resources
Full Text Sources