

Segmentation of breast masses on dedicated breast computed tomography and three-dimensional breast ultrasound images
- PMID: 32855995
- PMCID: PMC7439764
- DOI: 10.1117/1.JMI.1.1.014501
Segmentation of breast masses on dedicated breast computed tomography and three-dimensional breast ultrasound images
Abstract
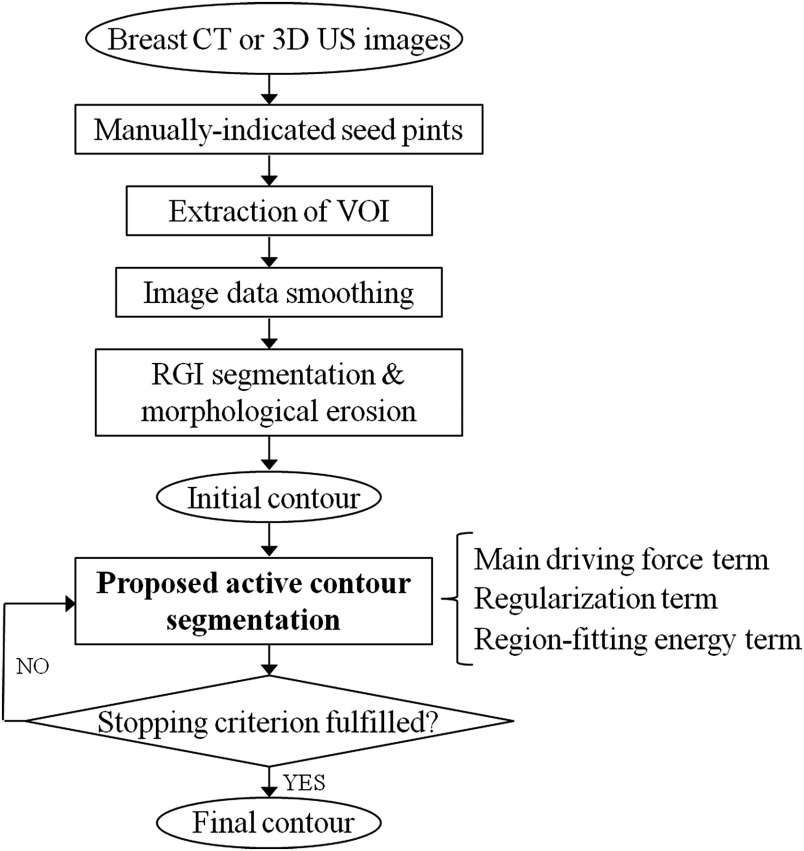
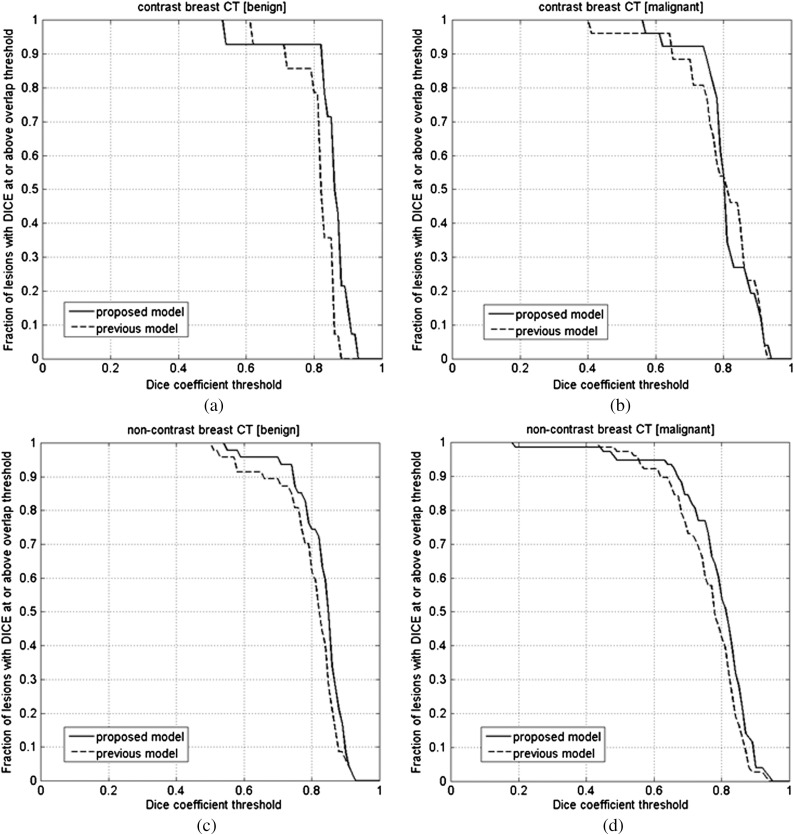
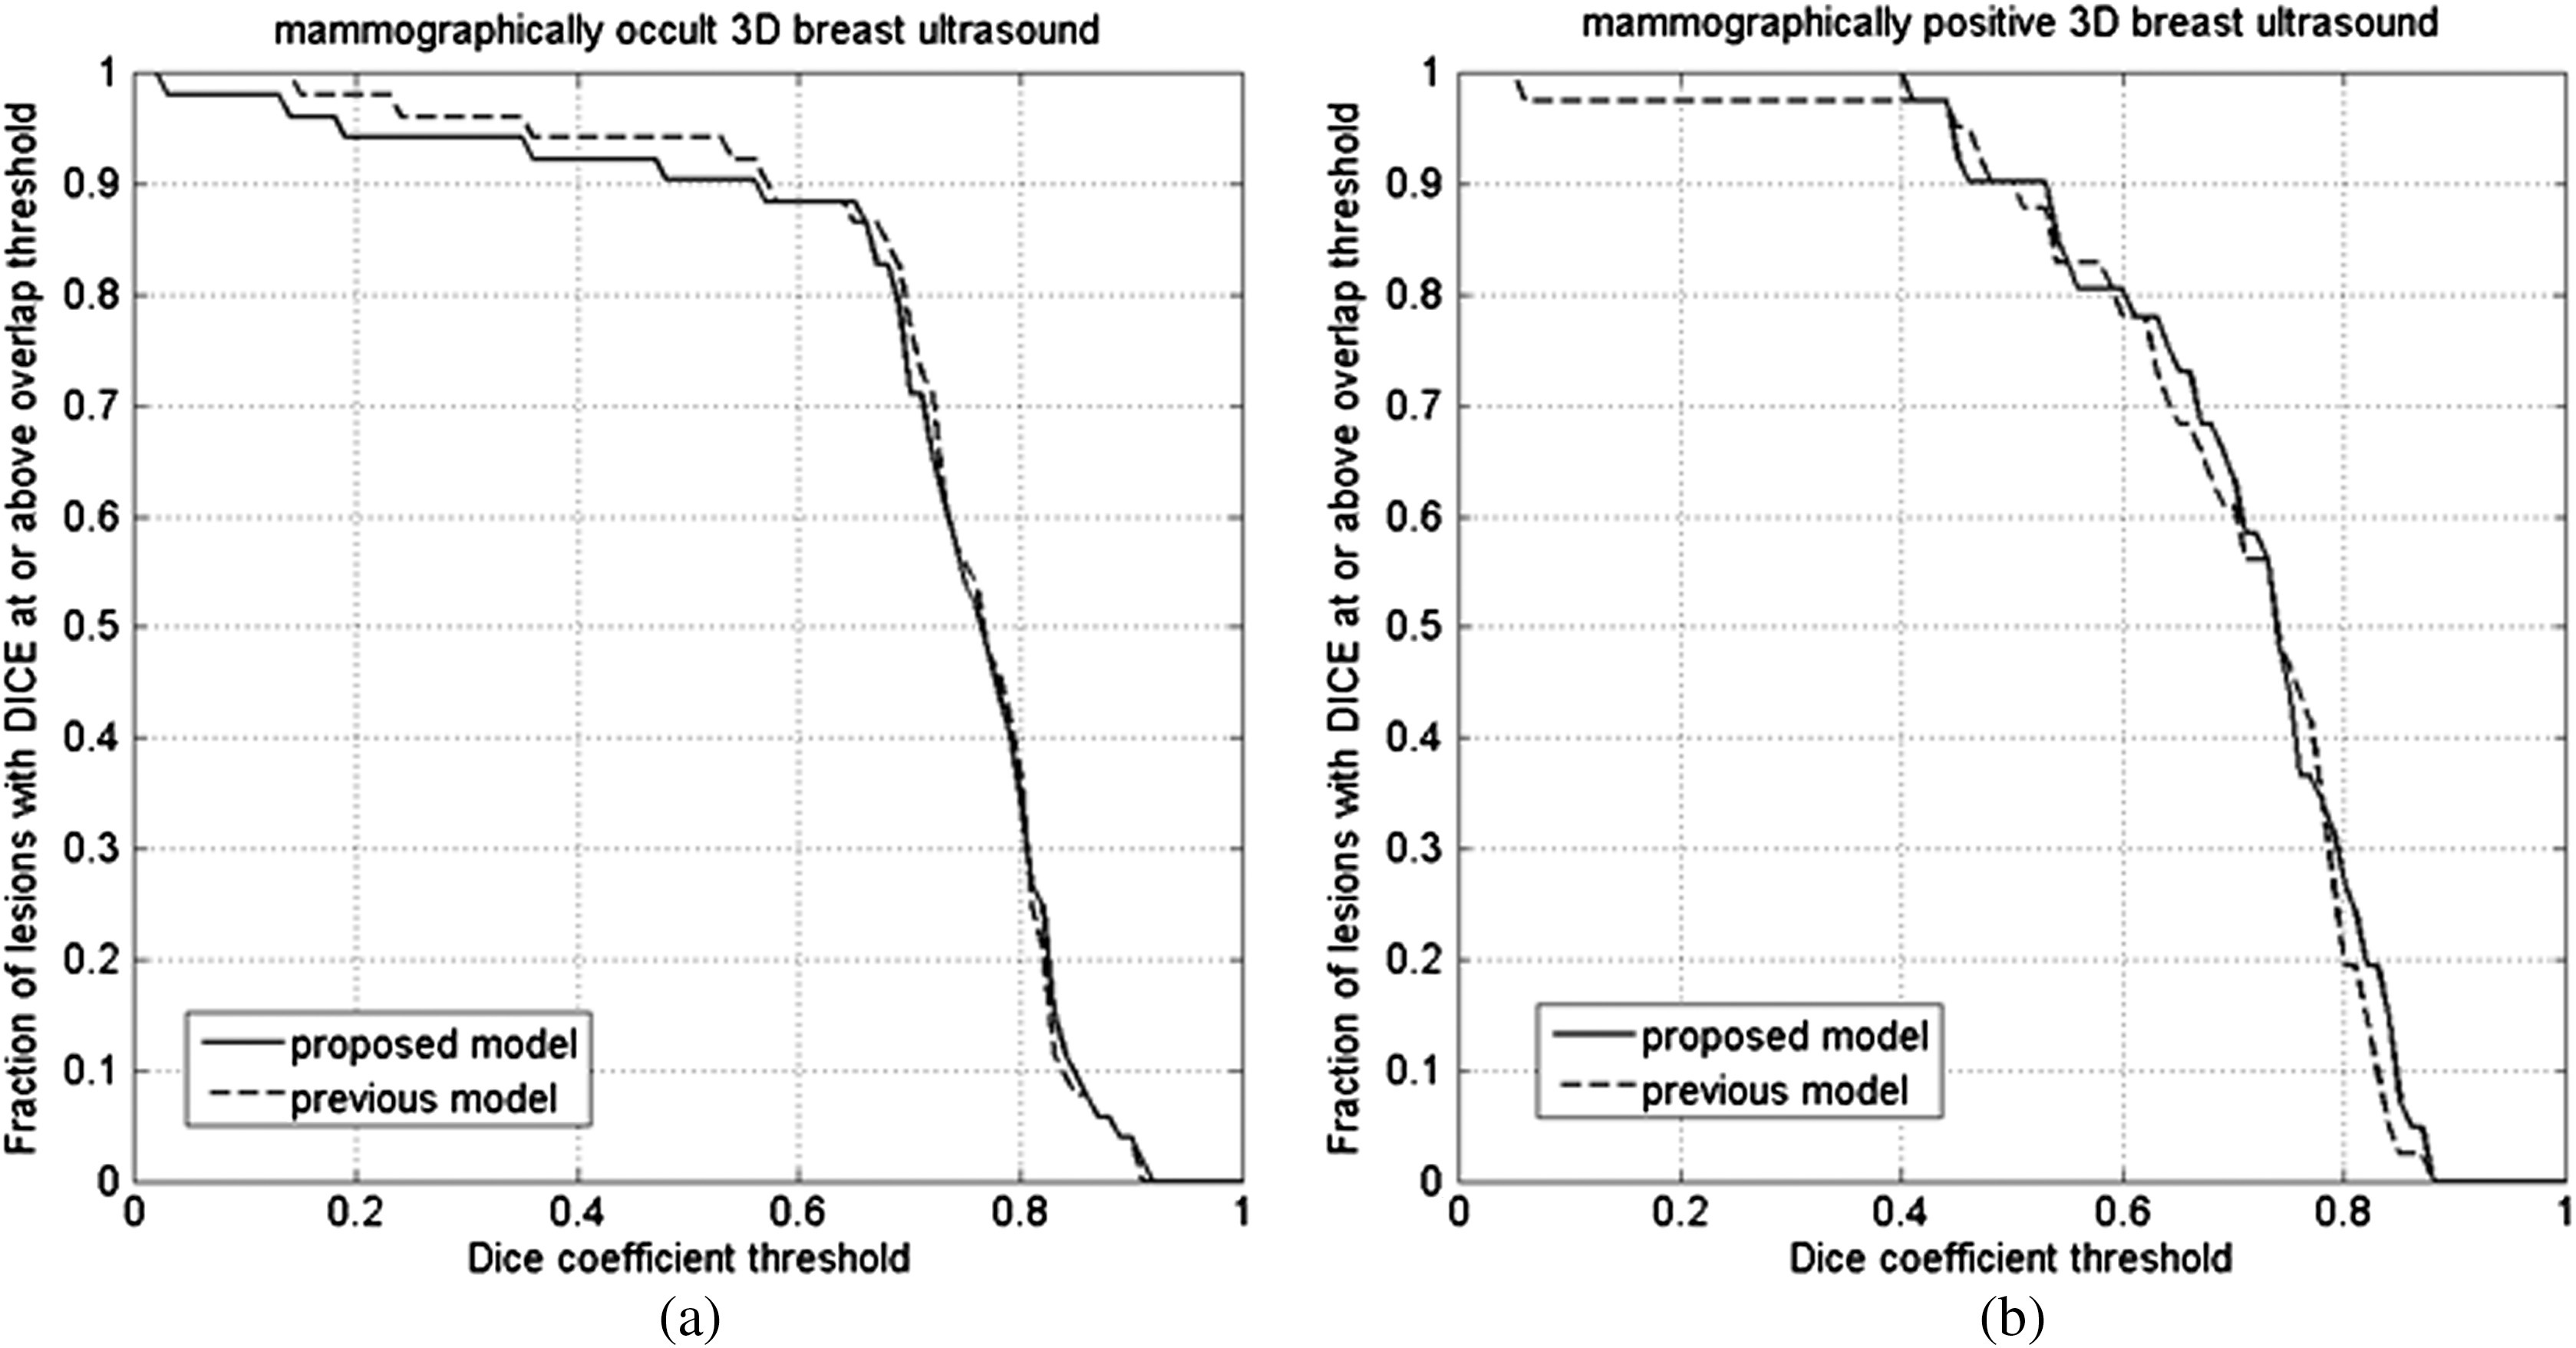
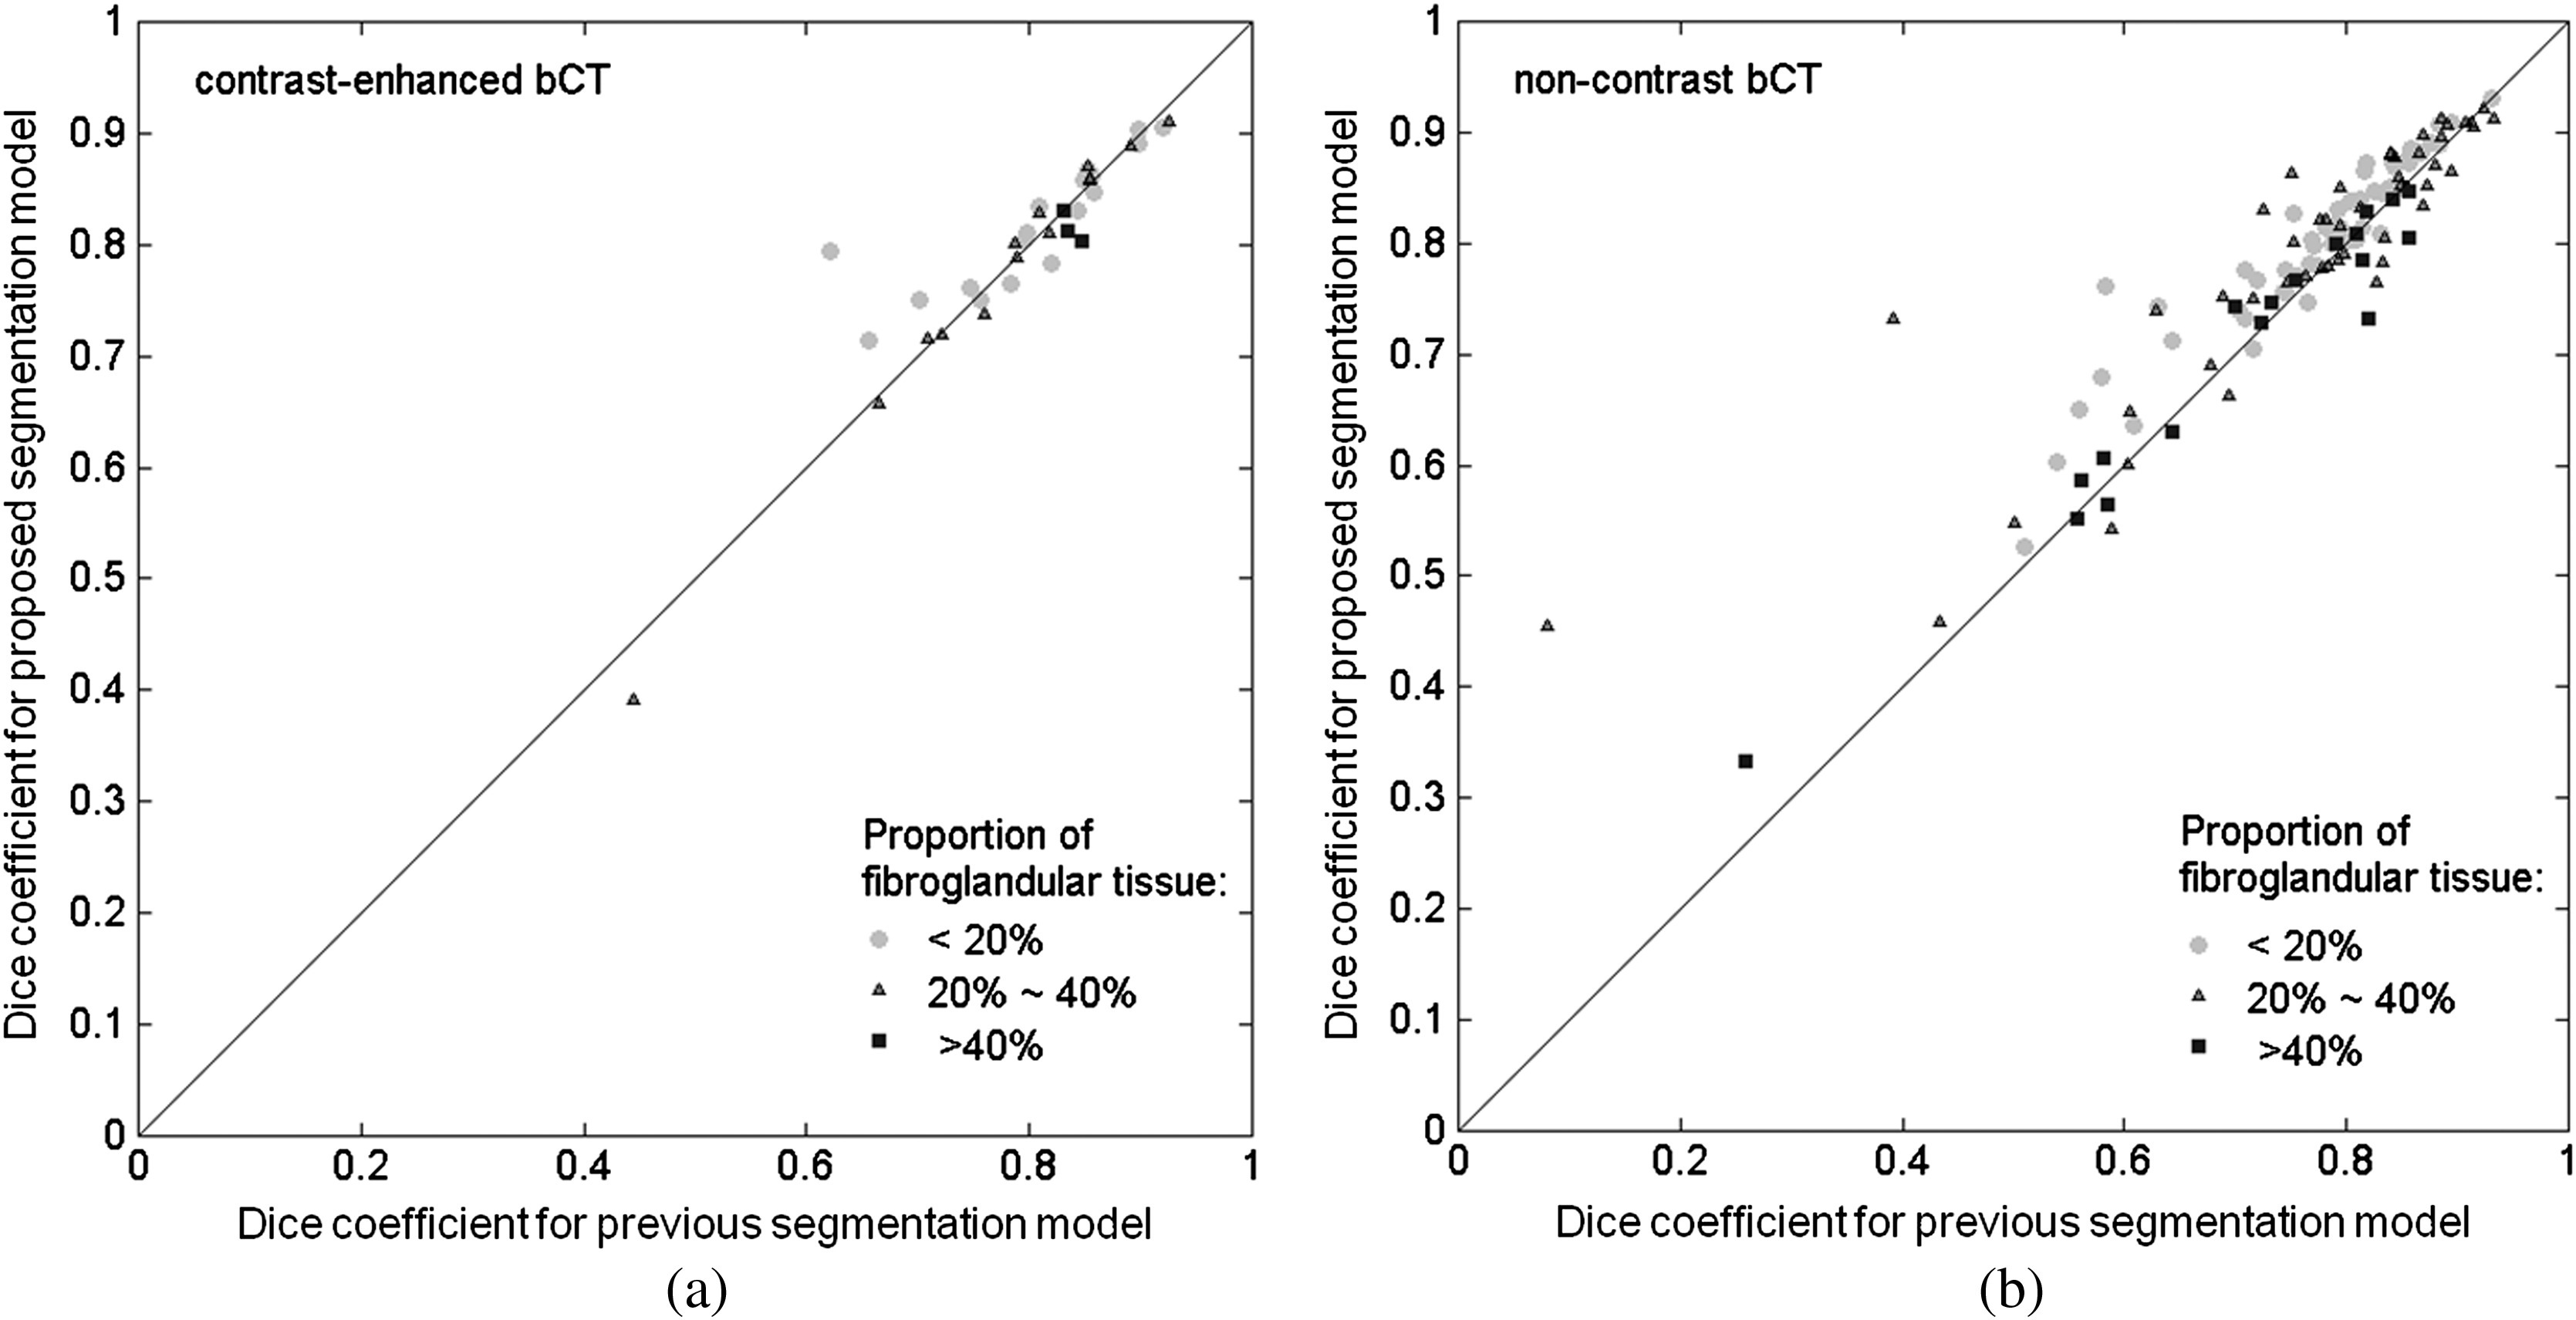
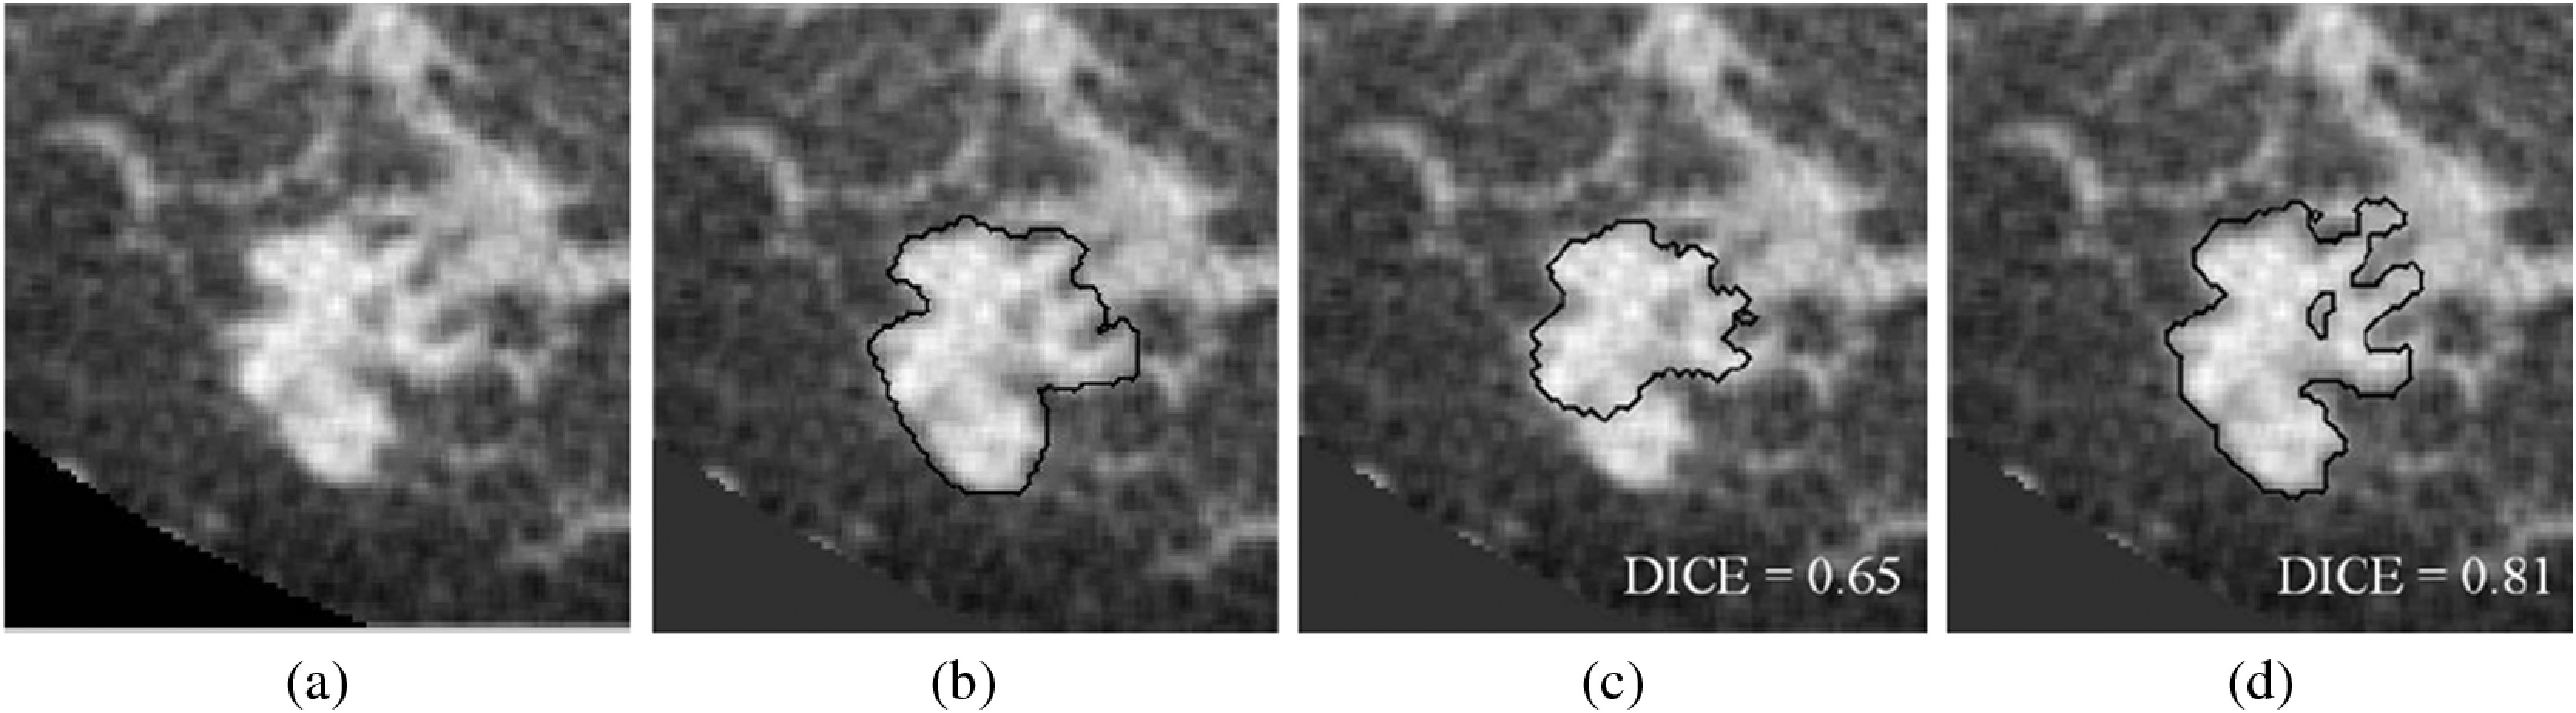
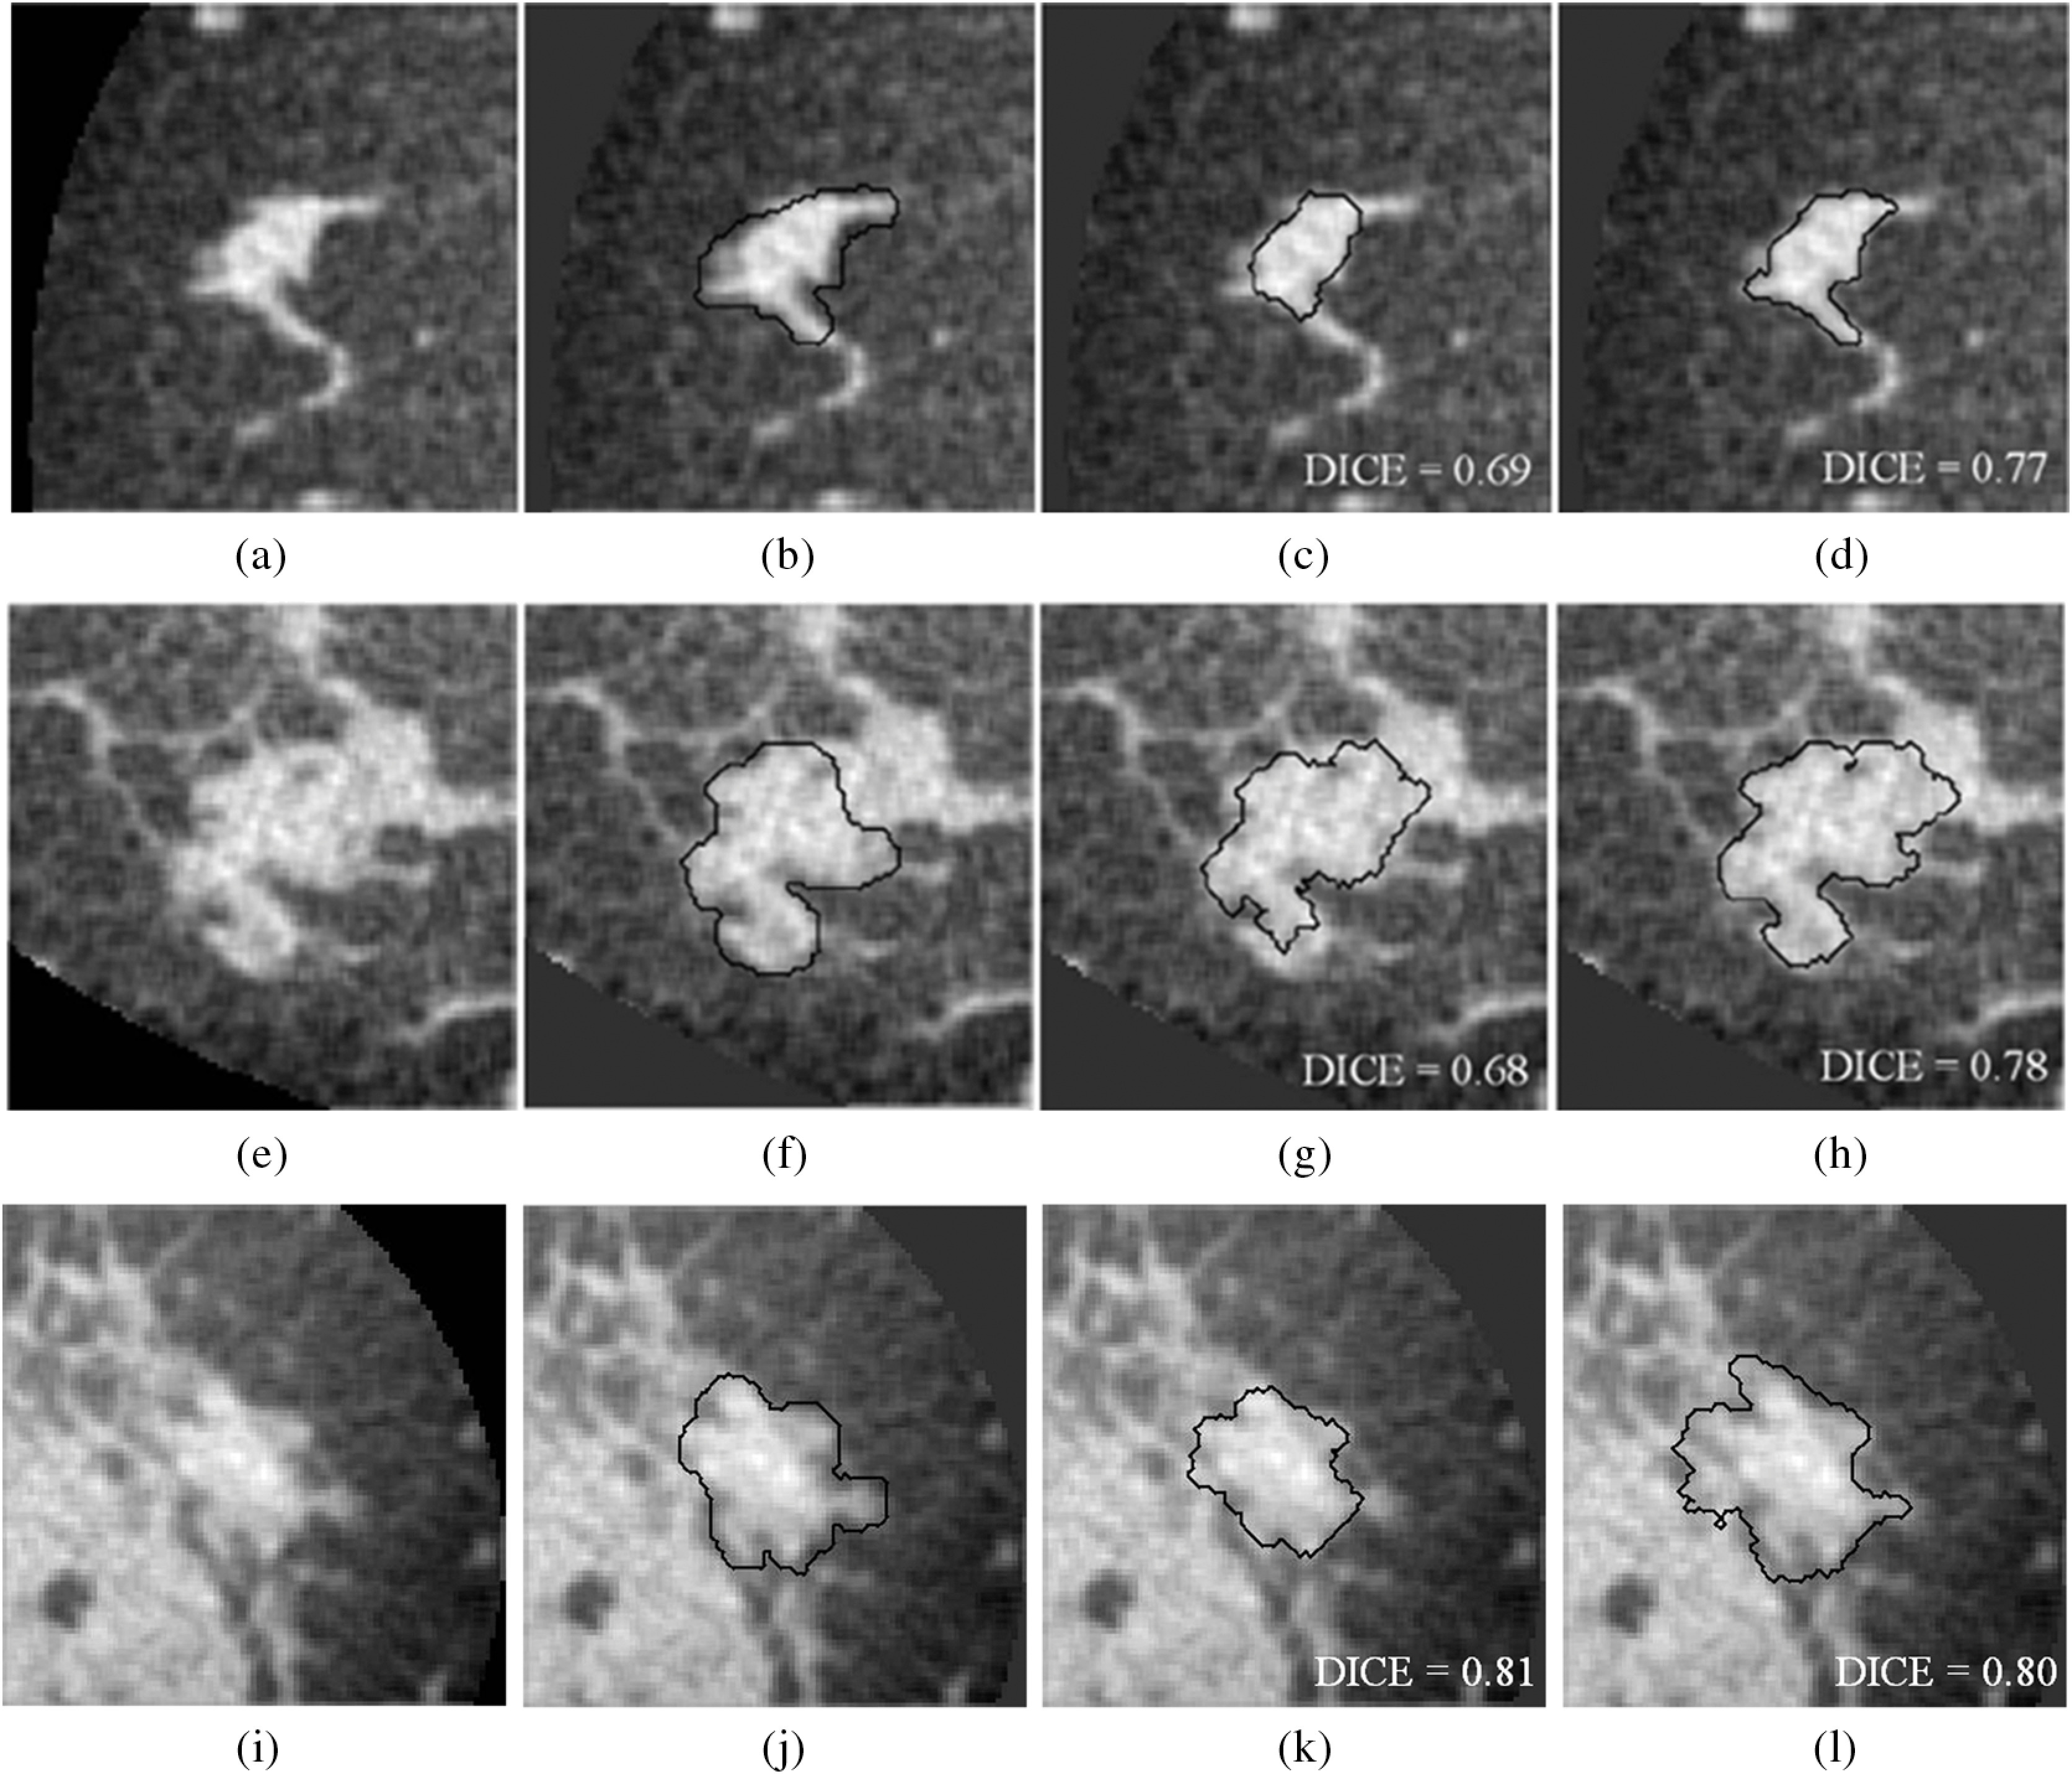
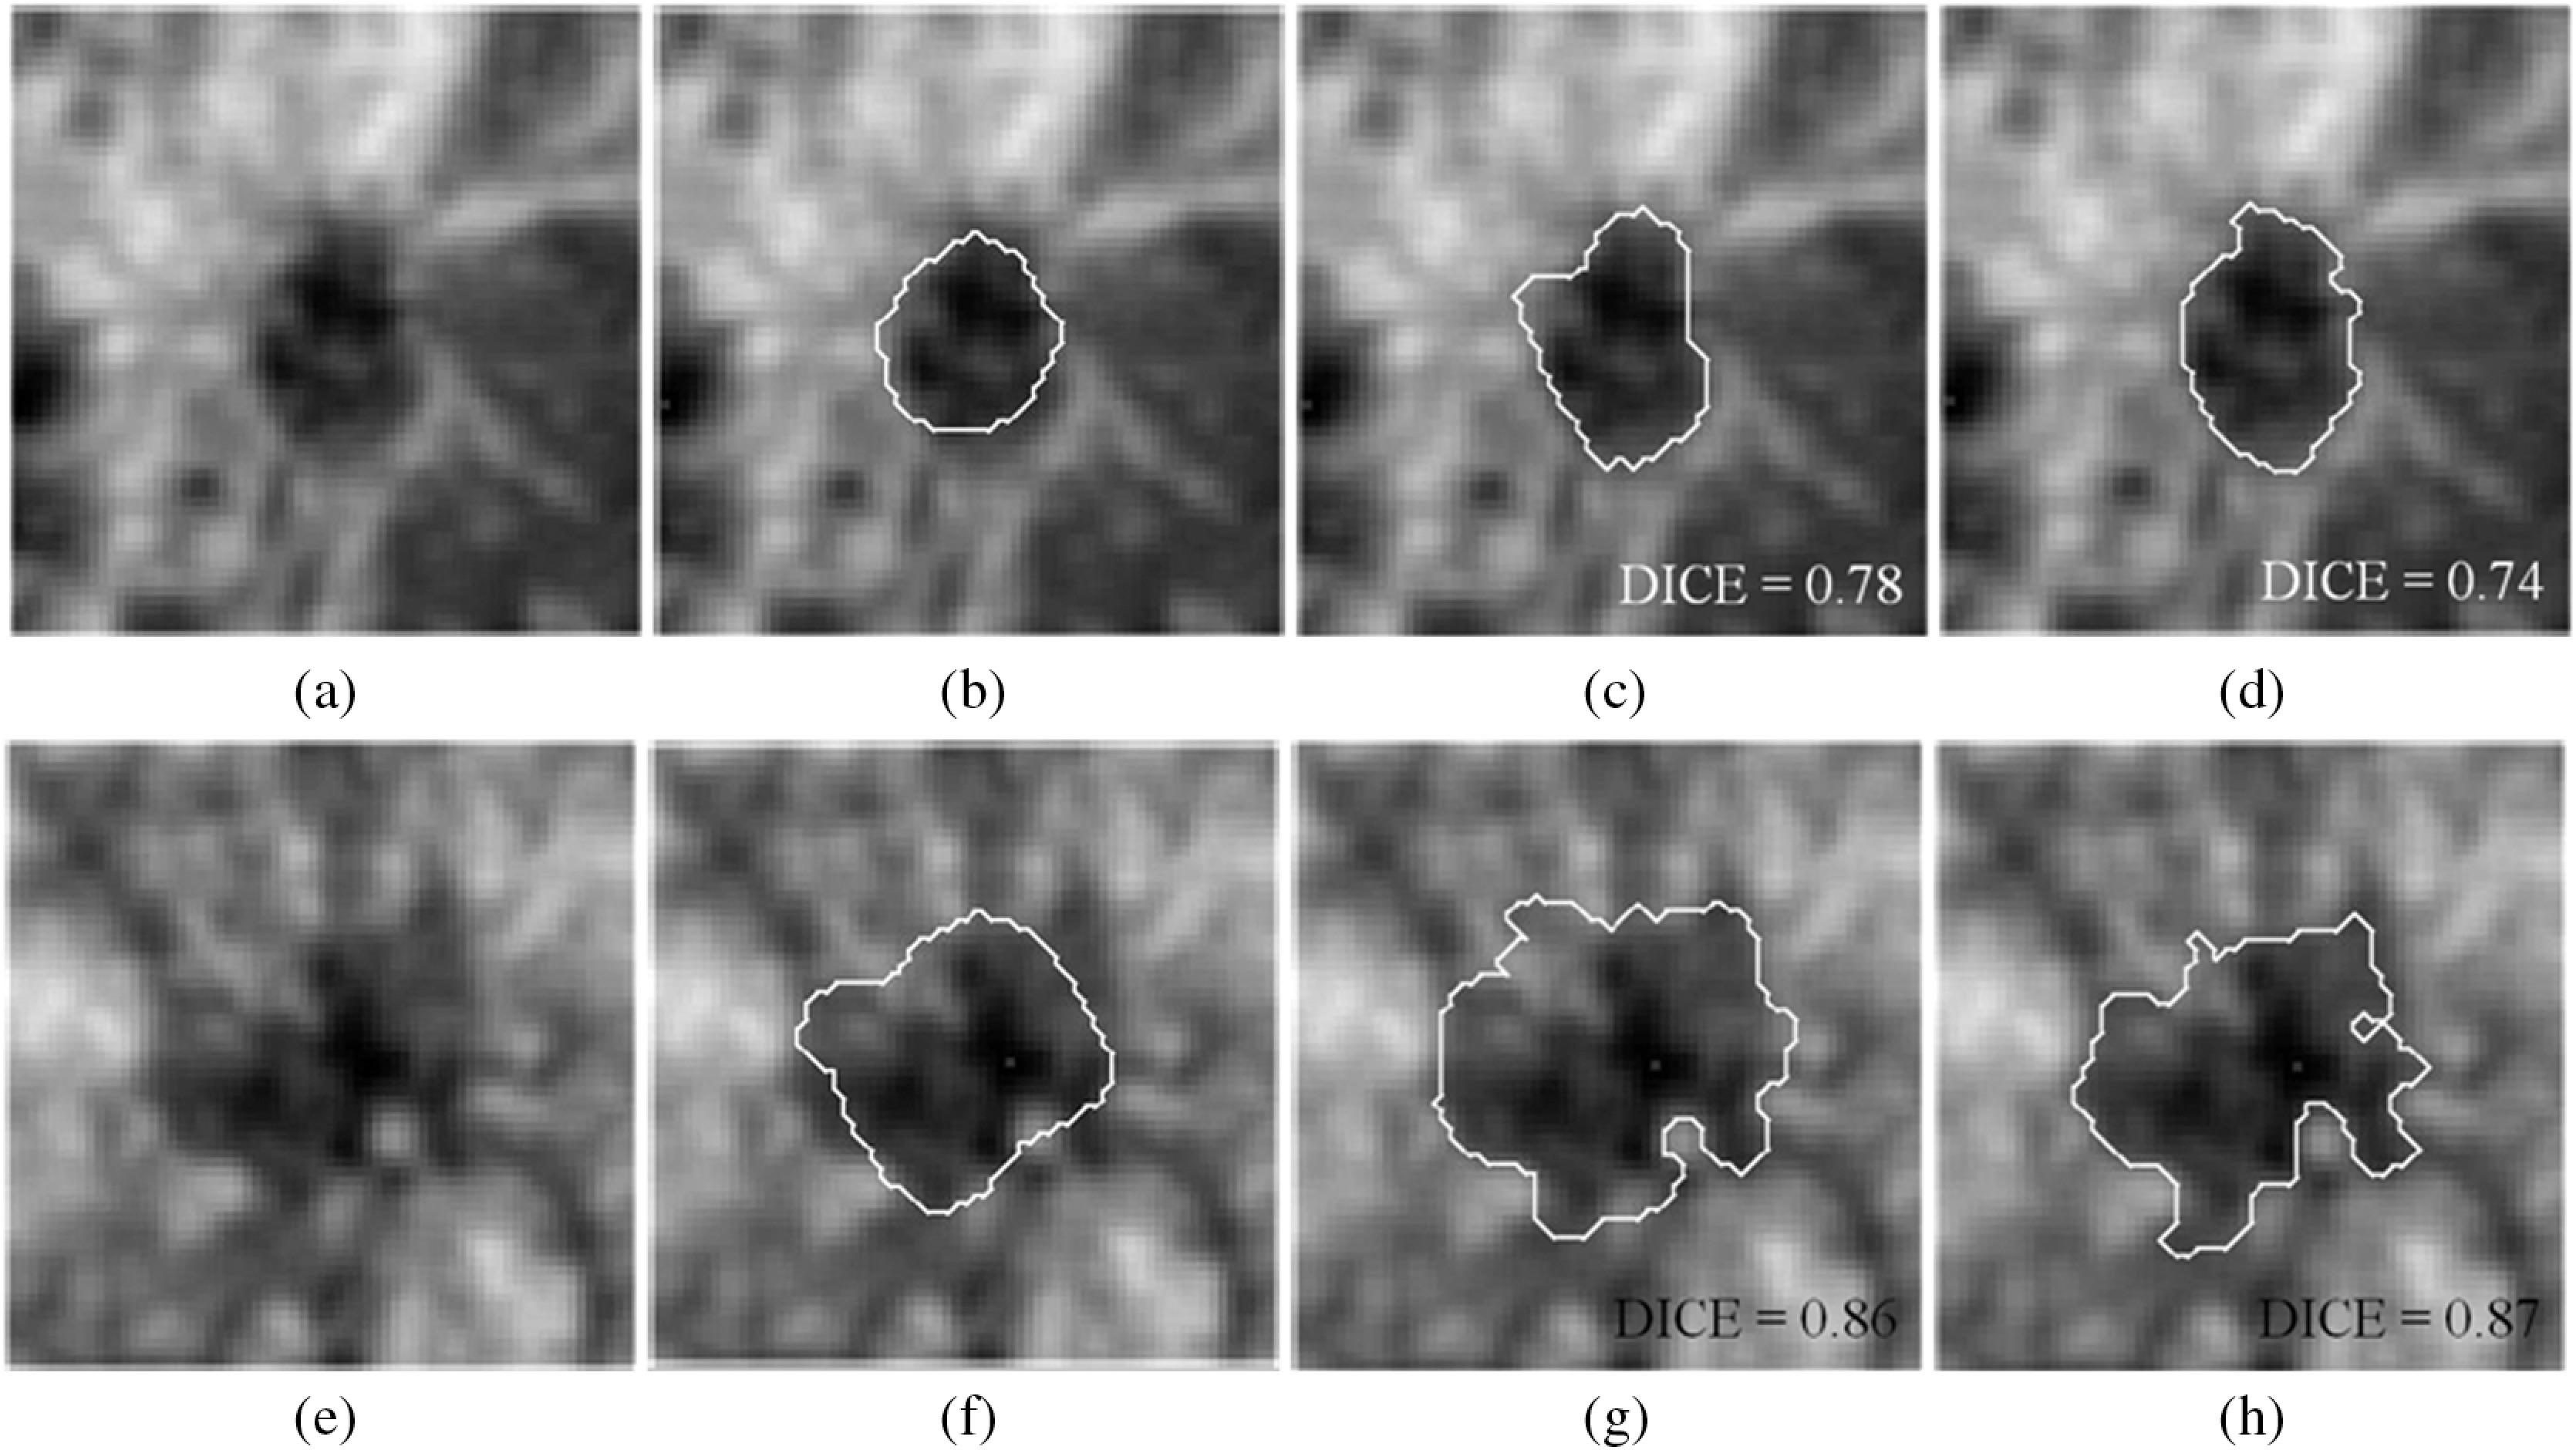
We present and evaluate a method for the three-dimensional (3-D) segmentation of breast masses on dedicated breast computed tomography (bCT) and automated 3-D breast ultrasound images. The segmentation method, refined from our previous segmentation method for masses on contrast-enhanced bCT, includes two steps: (1) initial contour estimation and (2) active contour-based segmentation to further evolve and refine the initial contour by adding a local energy term to the level-set equation. Segmentation performance was assessed in terms of Dice coefficients (DICE) for 129 lesions on noncontrast bCT, 38 lesions on contrast-enhanced bCT, and 98 lesions on 3-D breast ultrasound (US) images. For bCT, DICE values of 0.82 and 0.80 were obtained on contrast-enhanced and noncontrast images, respectively. The improvement in segmentation performance with respect to that of our previous method was statistically significant ( ). Moreover, segmentation appeared robust with respect to the presence of glandular tissue. For 3-D breast US, the DICE value was 0.71. Hence, our method obtained promising results for both 3-D imaging modalities, laying a solid foundation for further quantitative image analysis and potential future expansion to other 3-D imaging modalities.
Keywords: active contour model; breast computed tomography; computer-aided diagnosis; image analysis; segmentation; three-dimensional automated breast ultrasound.
© 2014 Society of Photo-Optical Instrumentation Engineers (SPIE).
Figures
Similar articles
-
Neutrosophic segmentation of breast lesions for dedicated breast computed tomography.J Med Imaging (Bellingham). 2018 Jan;5(1):014505. doi: 10.1117/1.JMI.5.1.014505. Epub 2018 Mar 6. J Med Imaging (Bellingham). 2018. PMID: 29541650 Free PMC article.
-
Level set segmentation of breast masses in contrast-enhanced dedicated breast CT and evaluation of stopping criteria.J Digit Imaging. 2014 Apr;27(2):237-47. doi: 10.1007/s10278-013-9652-1. J Digit Imaging. 2014. PMID: 24162667 Free PMC article.
-
Mass Segmentation in Automated 3-D Breast Ultrasound Using Adaptive Region Growing and Supervised Edge-Based Deformable Model.IEEE Trans Med Imaging. 2018 Apr;37(4):918-928. doi: 10.1109/TMI.2017.2787685. IEEE Trans Med Imaging. 2018. PMID: 29610071
-
Automated breast tumor detection and segmentation with a novel computational framework of whole ultrasound images.Med Biol Eng Comput. 2018 Feb;56(2):183-199. doi: 10.1007/s11517-017-1770-3. Epub 2018 Jan 2. Med Biol Eng Comput. 2018. PMID: 29292471 Free PMC article. Review.
-
Breast ultrasound image segmentation: a survey.Int J Comput Assist Radiol Surg. 2017 Mar;12(3):493-507. doi: 10.1007/s11548-016-1513-1. Epub 2017 Jan 9. Int J Comput Assist Radiol Surg. 2017. PMID: 28070777 Review.
Cited by
-
Impact of lesion segmentation metrics on computer-aided diagnosis/detection in breast computed tomography.J Med Imaging (Bellingham). 2014 Oct;1(3):031012. doi: 10.1117/1.JMI.1.3.031012. Epub 2014 Dec 24. J Med Imaging (Bellingham). 2014. PMID: 26158052 Free PMC article.
-
Neutrosophic segmentation of breast lesions for dedicated breast computed tomography.J Med Imaging (Bellingham). 2018 Jan;5(1):014505. doi: 10.1117/1.JMI.5.1.014505. Epub 2018 Mar 6. J Med Imaging (Bellingham). 2018. PMID: 29541650 Free PMC article.
-
Signal dropout correction-based ultrasound segmentation for diastolic mitral valve modeling.J Med Imaging (Bellingham). 2018 Apr;5(2):021214. doi: 10.1117/1.JMI.5.2.021214. Epub 2018 Feb 9. J Med Imaging (Bellingham). 2018. PMID: 29487886 Free PMC article.
-
Study on automatic detection and classification of breast nodule using deep convolutional neural network system.J Thorac Dis. 2020 Sep;12(9):4690-4701. doi: 10.21037/jtd-19-3013. J Thorac Dis. 2020. PMID: 33145042 Free PMC article.
-
Combinatorial active contour bilateral filter for ultrasound image segmentation.J Med Imaging (Bellingham). 2020 Sep;7(5):057003. doi: 10.1117/1.JMI.7.5.057003. Epub 2020 Oct 27. J Med Imaging (Bellingham). 2020. PMID: 33344671 Free PMC article.
References
-
- Dershaw D. D., “Breast disease missed by mammography,” Appl. Radiol. 26(9), 24–28 (1997).10.1016/S0160-9963(00)80025-4 - DOI
