. 2019 May 20;9(10):e3244.
doi: 10.21769/bioprotoc.3244.

A Flow Cytometric Method to Determine Transfection Efficiency

Affiliations

A Flow Cytometric Method to Determine Transfection Efficiency

Wenli Mu et al. Bio Protoc. .

Abstract

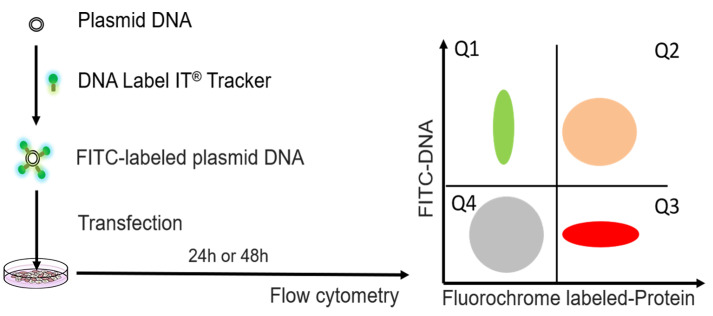
Mammalian cell transfection is a powerful technique commonly used in molecular biology to express exogenous DNA or RNA in cells and study gene and protein function. Although several transfection strategies have been developed, there is a wide variation with regards to transfection efficiency, cell toxicity and reproducibility. Thus, a sensitive and robust method that can optimize transfection efficiency based not only on expression of the target protein of interest but also on the uptake of the nucleic acids, can be an important tool in molecular biology. Herein, we present a simple, rapid and robust flow cytometric method that can be used as a tool to optimize transfection efficiency while overcoming limitations of prior established methods that quantify transfection efficiency.

Keywords: DNA labeling; Flow cytometry; Nucleic acids; Protein expression; Transfection.


Conflict of interest statement

Competing Interests The authors have declared that no competing interests exist.

Figures

Figure 1.
Figure 1.. Experimental design for determination of transfection efficiency by flow cytometric method.
The plasmid DNA was labeled with FITC by DNA label IT@ tracker. After transfection, cells were detected by flow cytometry. The FITC fluorochrome is used to detect intracellular levels of the transfected plasmid that has been labeled with FITC (Label IT tracker, green). The second fluorochrome is used to quantify expression of the target protein (by directly measuring fluorescence of the expressed protein if the target protein is fluorescent or by using a fluorescent-labeled antibody against the target protein, red). Either Q1+Q2 (DNA signal) or Q2+Q3 (protein signal) should be used as readouts of transfection efficiency.
Figure 2.
Figure 2.. Flow cytometric determination of transfection efficiency based on two independent readouts (DNA plasmid uptake and protein expression).
Representative transfections are shown. 293T cells underwent chemical transfection using the TransITX2 transfection reagent as described in Procedure. The same amount (1 μg) of DNA was used for two independent plasmids: a small (B. pUltraHot expressing mCherry, 8.3 kb) and a large (C. pNL4-3 expressing p24, 14.0 kb) DNA plasmid. Gating strategy is shown: A) forward and side scatters B) discrimination of doublets C, D) two independent readouts of transfection efficiency. FITC fluorescence corresponds to the uptake of FITC-labeled plasmid DNA (y-axis). A fluorochrome that has no spectral overlap with FITC is used to quantify protein expression. Either a fluorescent protein can be used (e.g., mCherry; shown in C) or a protein labeled with a fluorescent-labeled antibody (e.g., intracellular expression of HIV-1 p24 protein was detected by a CF647-labeled anti-p24 antibody; shown in D). Co-expression of DNA taken up by cells and target protein were analyzed 24 h after transfection. The numbers in the quadrants indicate the percentages of viable cells that took up the FITC labeled DNA plasmid versus the expressed protein that was detected. The following dot plots are shown for each chemical transfection in 293T cells: i) untransfected cells (negative control), ii) cells transfected with FITC-labeled DNA plasmid harvested before protein expression occurred (3 h post transfection), iii) cells transfected with unlabeled plasmid harvested 24 h after transfection (when protein expression can be quantified) iv) cells transfected with FITC-labeled DNA plasmid and harvested 24 h after transfection (when protein expression can be quantified). In this plot Q3 quadrant demonstrates many cells that express protein but do not show any fluorescence associated with uptake of the plasmid DNA. Either Q1+Q2 (DNA signal) or Q2+Q3 (protein signal) should be used as readouts of transfection efficiency. E. Transfection efficiency was quantified in human lymphocytes (Jurkat E6 cells) harvested 24 h after electroporation with FITC-labeled DNA mCherry plasmid without the need to use co-transfection of 2 different plasmids and GFP reporter.

References

    1. Stoll S. M. and Calos M. P.(2002). Extrachromosomal plasmid vectors for gene therapy. Curr Opin Mol Ther 4(4): 299-305. - PubMed
    1. Kim T. K. and Eberwine J. H.(2010). Mammalian cell transfection: the present and the future. Anal Bioanal Chem 397(8): 3173-3178. - PMC - PubMed
    1. Zhou Z. L., Sun X. X., Ma J., Man C. H., Wong A. S., Leung A. Y. and Ngan A. H.(2016). Mechanical oscillations enhance gene delivery into suspended cells. Sci Rep 6: 22824. - PMC - PubMed
    1. Homann S., Hofmann C., Gorin A. M., Nguyen H. C. X., Huynh D., Hamid P., Maithel N., Yacoubian V., Mu W., Kossyvakis A., Sen Roy S., Yang O. O. and Kelesidis T.(2017). A novel rapid and reproducible flow cytometric method for optimization of transfection efficiency in cells. PLoS One 12(9): e0182941. - PMC - PubMed
    1. Kapoor V., Hakim F. T., Rehman N., Gress R. E. and Telford W. G.(2009). Quantum dots thermal stability improves simultaneous phenotype-specific telomere length measurement by FISH-flow cytometry. J Immunol Methods 344(1): 6-14. - PMC - PubMed