. 2020 Oct 12;150(10):2716-2728.
doi: 10.1093/jn/nxaa239.

Host Genetic Background and Gut Microbiota Contribute to Differential Metabolic Responses to Fructose Consumption in Mice

Affiliations

Host Genetic Background and Gut Microbiota Contribute to Differential Metabolic Responses to Fructose Consumption in Mice

In Sook Ahn et al. J Nutr. .

Abstract

Background: It is unclear how high fructose consumption induces disparate metabolic responses in genetically diverse mouse strains.

Objective: We aimed to investigate whether the gut microbiota contributes to differential metabolic responses to fructose.

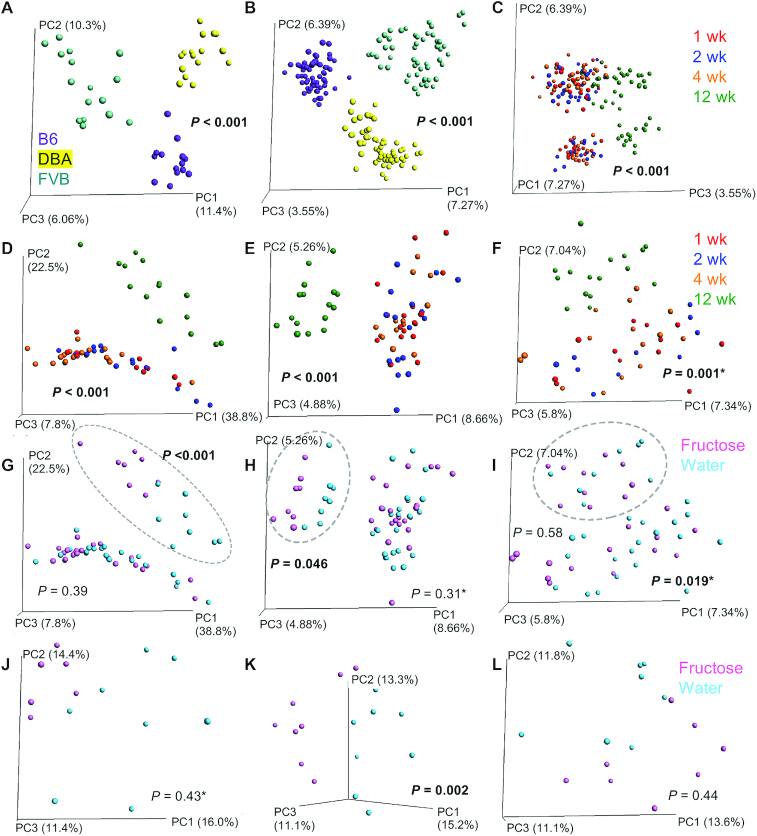
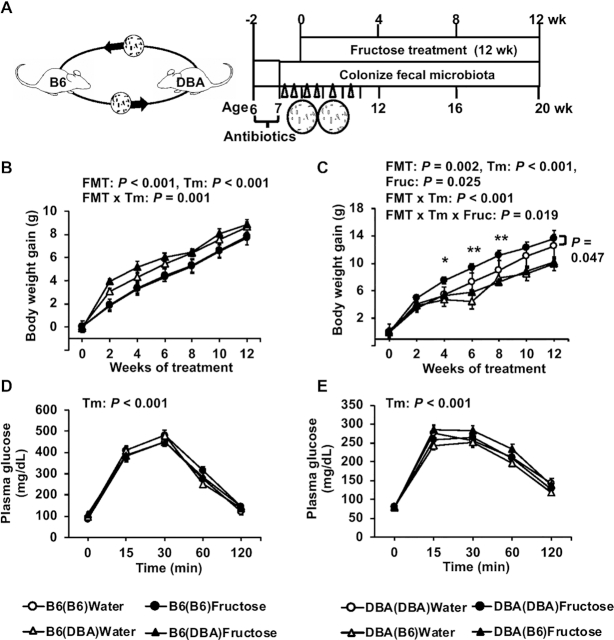
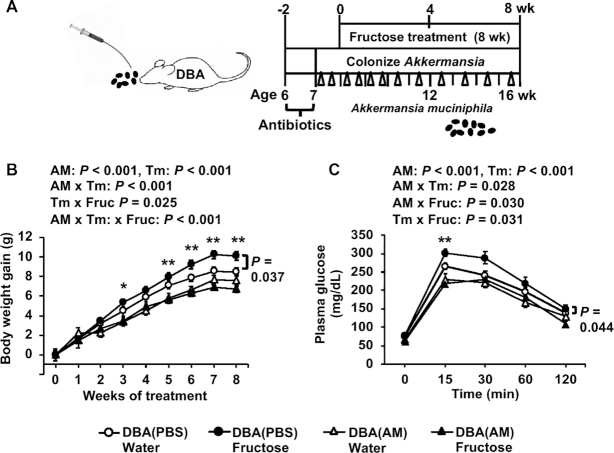
Methods: Eight-week-old male C57BL/6J (B6), DBA/2J (DBA), and FVB/NJ (FVB) mice were given 8% fructose solution or regular water (control) for 12 wk. The gut microbiota composition in cecum and feces was analyzed using 16S ribosomal DNA sequencing, and permutational multivariate ANOVA (PERMANOVA) was used to compare community across mouse strains, treatments, and time points. Microbiota abundance was correlated with metabolic phenotypes and host gene expression in hypothalamus, liver, and adipose tissues using Biweight midcorrelation. To test the causal role of the gut microbiota in determining fructose response, we conducted fecal transplants from B6 to DBA mice and vice versa for 4 wk, as well as gavaged antibiotic-treated DBA mice with Akkermansia for 9 wk, accompanied with or without fructose treatment.

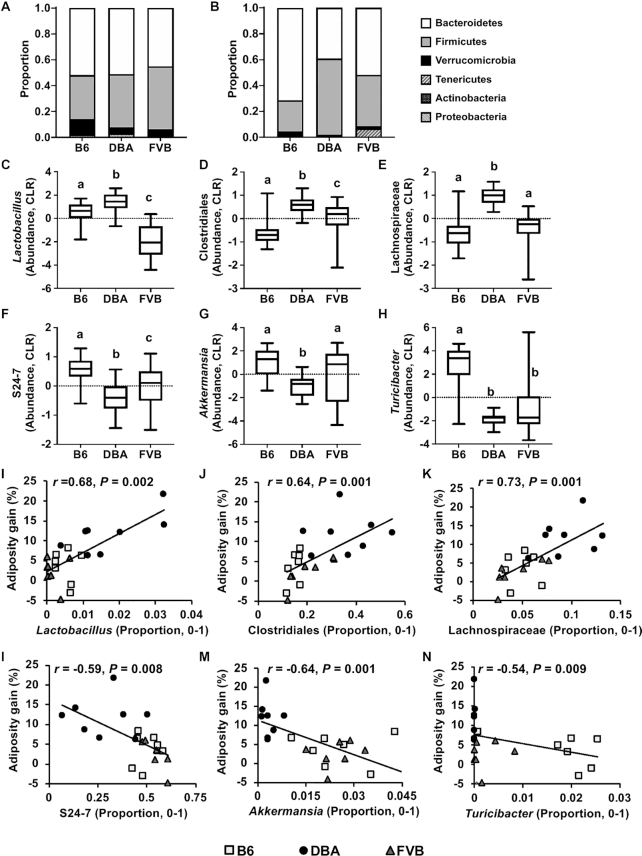
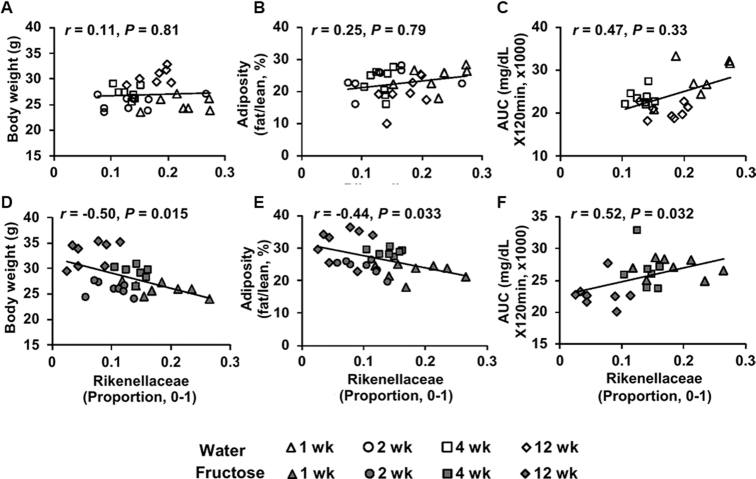
Results: Compared with B6 and FVB, DBA mice had significantly higher Firmicutes to Bacteroidetes ratio and lower baseline abundance of Akkermansia and S24-7 (P < 0.05), accompanied by metabolic dysregulation after fructose consumption. Fructose altered specific microbial taxa in individual mouse strains, such as a 7.27-fold increase in Akkermansia in B6 and 0.374-fold change in Rikenellaceae in DBA (false discovery rate <5%), which demonstrated strain-specific correlations with host metabolic and transcriptomic phenotypes. Fecal transplant experiments indicated that B6 microbes conferred resistance to fructose-induced weight gain in DBA mice (F = 43.1, P < 0.001), and Akkermansia colonization abrogated the fructose-induced weight gain (F = 17.8, P < 0.001) and glycemic dysfunctions (F = 11.8, P = 0.004) in DBA mice.

Conclusions: Our findings support that differential microbiota composition between mouse strains is partially responsible for host metabolic sensitivity to fructose, and that Akkermansia is a key bacterium that confers resistance to fructose-induced metabolic dysregulation.

Keywords: Akkermansia; fecal transplant; fructose; gene by diet interaction; gut microbiota; metabolic syndrome; microbiota-host interaction.


Figures

FIGURE 1
FIGURE 1
PCoA of cecal and fecal microbiota of B6, DBA, and FVB mice consuming fructose or regular water. (A) Cecal microbiota samples across 3 mouse strains were shown to separate by strain (A; n = 16/strain; week 12). (B, C) Fecal microbiota samples across 3 mouse strains were separated by both strain (B; n = 64/strain across 4 time points) and time (C; n = 16/time point for each strain). Panel C used the same ordination as panel B, except that PC3 was presented as the x-axis to show the relation with time. (D–F) For each mouse strain, fecal samples were colored by time points for B6 (D), DBA (E), and FVB (F) to show the time effect. (G–I) Fecal samples were colored with fructose or water treatment for B6 (G), DBA (H), and FVB (I) to show treatment effect. Samples for the 12-wk time point are shown in dotted circles, with the corresponding P values for fructose treatment effect reported. (J–L) Cecal samples were colored by the fructose or water treatment for B6 (J), DBA (K), and FVB (L). P values were generated by PERMANOVA, and significant results are presented in bold. P values with an asterisk designate that significantly different dispersions were observed, which may influence the P values reported as PERMANOVA assumes similar dispersion. B6, C57BL/6J; DBA, DBA/2J; FVB, FVB/NJ; PC, principal coordinate; PCoA, principal coordinates analysis; PERMANOVA, permutational multivariate ANOVA.
FIGURE 2
FIGURE 2
Cecal and fecal baseline microbial composition in B6, DBA, and FVB mice and correlation with adiposity gain. (A, B) Taxa bar plots of baseline cecal (A) and fecal (B) microbiota of 3 mouse strains at the phylum level. (C–H) Baseline abundance profiles for specific fecal microbiota of 3 mouse strains at the genus level. CLR values were used for plotting the abundance of each microbiota. Box-and-whiskers plots from minimum to maximum showing abundance distribution of Lactobacillus (C), unknown genus of Clostridiales (D), unknown genus of Lachnospiraceae (E), unknown genus of S24–7 (F), Akkermansia (G), and Turicibacter (H). The center line in the box denotes the median value. One-factor ANOVA followed by Sidak's post hoc test was conducted to calculate significant differences between the 3 mouse strains. Labeled means without a common letter differ, P < 0.05. n = 7–8/group. (I–N) Correlation analysis plots between microbiota baseline proportion and adiposity gain at week 12 of fructose treatment. r = Biweight midcorrelation (bicor) coefficient, P = Benjamini-Hochberg–adjusted P values. n = 7–8/group. B6, C57BL/6J; CLR, centered log-ratio; DBA, DBA/2J; FVB, FVB/NJ.
FIGURE 3
FIGURE 3
Correlation analysis of fructose-responsive microbiota with metabolic phenotypes in DBA mice. (A–C) Correlation plots between Rikenellaceae proportion and body weight (A), adiposity (B), and glucose tolerance AUC (C) across time points in the water group. (D–F) Correlation plots between Rikenellaceae proportion and body weight (D), adiposity (E), and glucose tolerance AUC (F) across time points in the fructose group. r = Biweight midcorrelation (bicor) coefficient, P = Benjamini-Hochberg–adjusted P-values. n = 7–8/group/time point. DBA, DBA/2J.
FIGURE 4
FIGURE 4
Metabolic phenotypes post–fecal transplant in B6 and DBA mice with or without fructose consumption. (A) Schematic design of FMT. (B–E) Body-weight gain (B, C) and glucose tolerance (D, E) of recipient B6 and DBA mice, respectively, with or without 8% fructose water. Data are presented as means ± SEMs, n = 7–14/group. The P values of the main factors (FMT, fructose, time) and interactions by 3-factor repeated-measures ANOVA are shown on the top of the graph. Asterisks in panel C indicate time points at which significant differences were found between DBA(DBA) and DBA(B6) under fructose treatment based on 2-factor repeated-measures ANOVA with Sidak's post hoc test; *P < 0.05, **P < 0.01. Fructose effects within each FMT group across time points were assessed by 2-factor repeated-measures ANOVA, and significant difference between fructose and water treatments for the DBA(DBA) FMT group is indicated by a P value with a side bar (C). B6, C57BL/6J; B6(B6), B6 mice receiving B6 feces; B6(DBA), B6 mice receiving DBA feces; DBA, DBA/2J; DBA(B6), DBA mice receiving B6 feces; DBA(DBA), DBA mice receiving DBA feces; FMT, fecal microbiota transplant; Fruc, fructose; Tm, time.
FIGURE 5
FIGURE 5
Metabolic phenotypes post–Akkermansia colonization in DBA mice with or without fructose consumption. (A) Schematic design of AM colonization. PBS serves as the control for AM. (B, C) Body-weight gain (B) and glucose tolerance (C) of recipient DBA mice with or without 8% fructose water. Data are presented as means ± SEMs, n = 8–14/group. The P values of main factors (AM, fructose, time) and interactions by 3-factor repeated-measures ANOVA are shown on the top of the graph. Asterisks indicate time points at which significant differences were found between the AM colonization and PBS control groups under fructose treatment based on 2-factor repeated-measures ANOVA with Sidak's post hoc test; *P < 0.05, **P < 0.01. Fructose effects within PBS or AM groups across time points were assessed by 2-factor repeated-measures ANOVA. A significant fructose effect on weight gain and glucose tolerance in mice receiving PBS is indicated by P values with a side bar (B and C). AM, Akkermansia muciniphila; DBA, DBA/2J; Fruc, fructose; Tm, time.

Similar articles

Cited by

References

    1. Basciano H, Federico L, Adeli K. Fructose, insulin resistance, and metabolic dyslipidemia. Nutr Metab. 2005;2:1–14. - PMC - PubMed
    1. Meng Q, Ying Z, Noble E, Zhao Y, Agrawal R, Mikhail A, Zhuang Y, Tyagi E, Zhang Q, Lee JH et al. . Systems nutrigenomics reveals brain gene networks linking metabolic and brain disorders. EBioMedicine. 2016;7:157–66. - PMC - PubMed
    1. Koo HY, Wallig MA, Chung BH, Nara TY, Cho BHS, Nakamura MT. Dietary fructose induces a wide range of genes with distinct shift in carbohydrate and lipid metabolism in fed and fasted rat liver. Biochim Biophys Acta Mol Basis Dis. 2008;1782:341–8. - PubMed
    1. Li Z, Xiong C, Mo S, Tian H, Yu M, Mao T, Chen Q, Luo H, Li Q, Lu J et al. . Comprehensive transcriptome analyses of the fructose-fed syrian golden hamster liver provides novel insights into lipid metabolism. PLoS One. 2016;11:1–19. - PMC - PubMed
    1. Zhang G, Byun HR, Ying Z, Blencowe M, Zhao Y, Hong J, Shu L, Chella Krishnan K, Gomez-Pinilla F, Yang X. Differential metabolic and multi-tissue transcriptomic responses to fructose consumption among genetically diverse mice. Biochim Biophys Acta Mol Basis Dis. 2020;1866:165569. - PMC - PubMed

Publication types