. 2020 Sep;34(5):1853-1866.
doi: 10.1111/jvim.15871. Epub 2020 Aug 28.

Effects of metronidazole on the fecal microbiome and metabolome in healthy dogs

Affiliations

Effects of metronidazole on the fecal microbiome and metabolome in healthy dogs

Rachel Pilla et al. J Vet Intern Med. 2020 Sep.

Abstract

Background: Metronidazole has a substantial impact on the gut microbiome. However, the recovery of the microbiome after discontinuation of administration, and the metabolic consequences of such alterations have not been investigated to date.

Objectives: To describe the impact of 14-day metronidazole administration, alone or in combination with a hydrolyzed protein diet, on fecal microbiome, metabolome, bile acids (BAs), and lactate production, and on serum metabolome in healthy dogs.

Animals: Twenty-four healthy pet dogs.

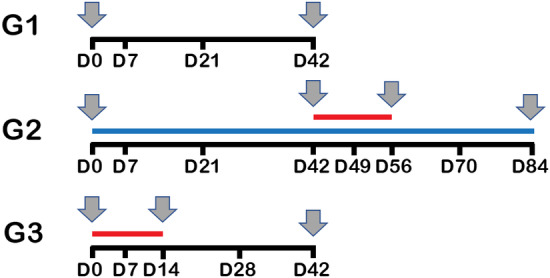
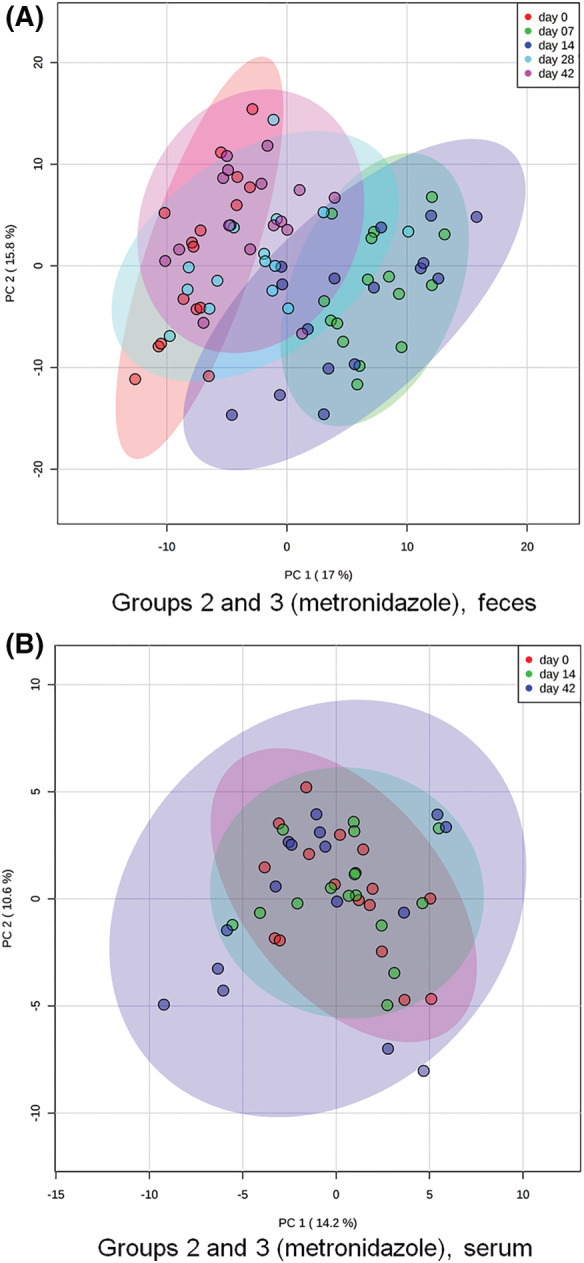
Methods: Prospective, nonrandomized controlled study. Dogs fed various commercial diets were divided in 3 groups: control group (no intervention, G1); group receiving hydrolyzed protein diet, followed by metronidazole administration (G2); and group receiving metronidazole only (G3). Microbiome composition was evaluated with sequencing of 16S rRNA genes and quantitative polymerase chain reaction (qPCR)-based dysbiosis index. Untargeted metabolomics analysis of fecal and serum samples was performed, followed by targeted assays for fecal BAs and lactate.

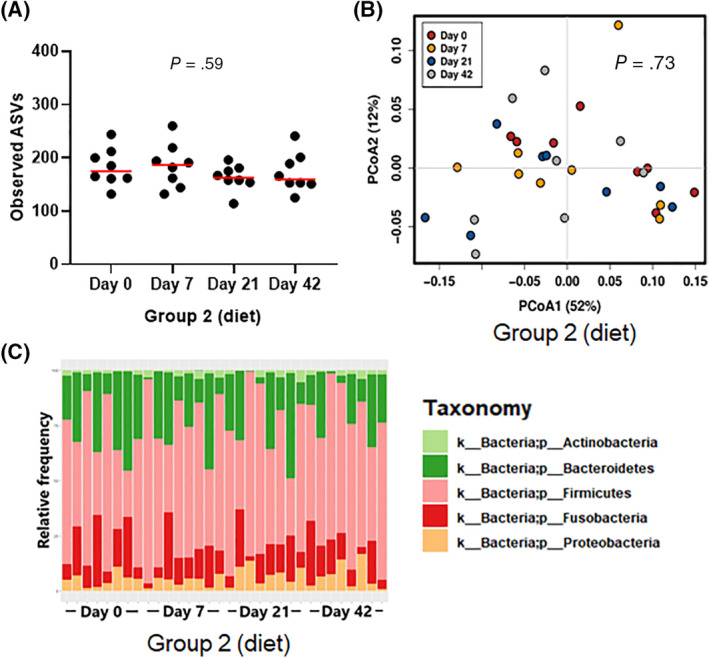
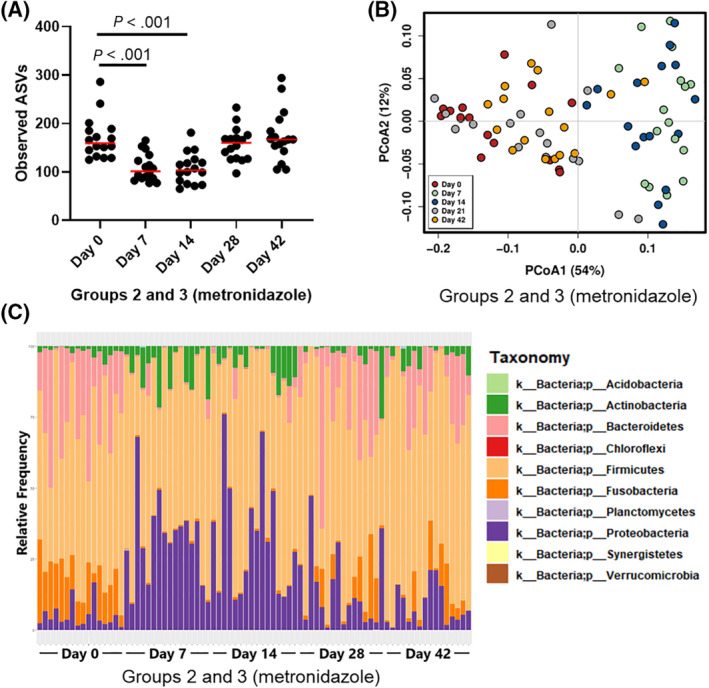
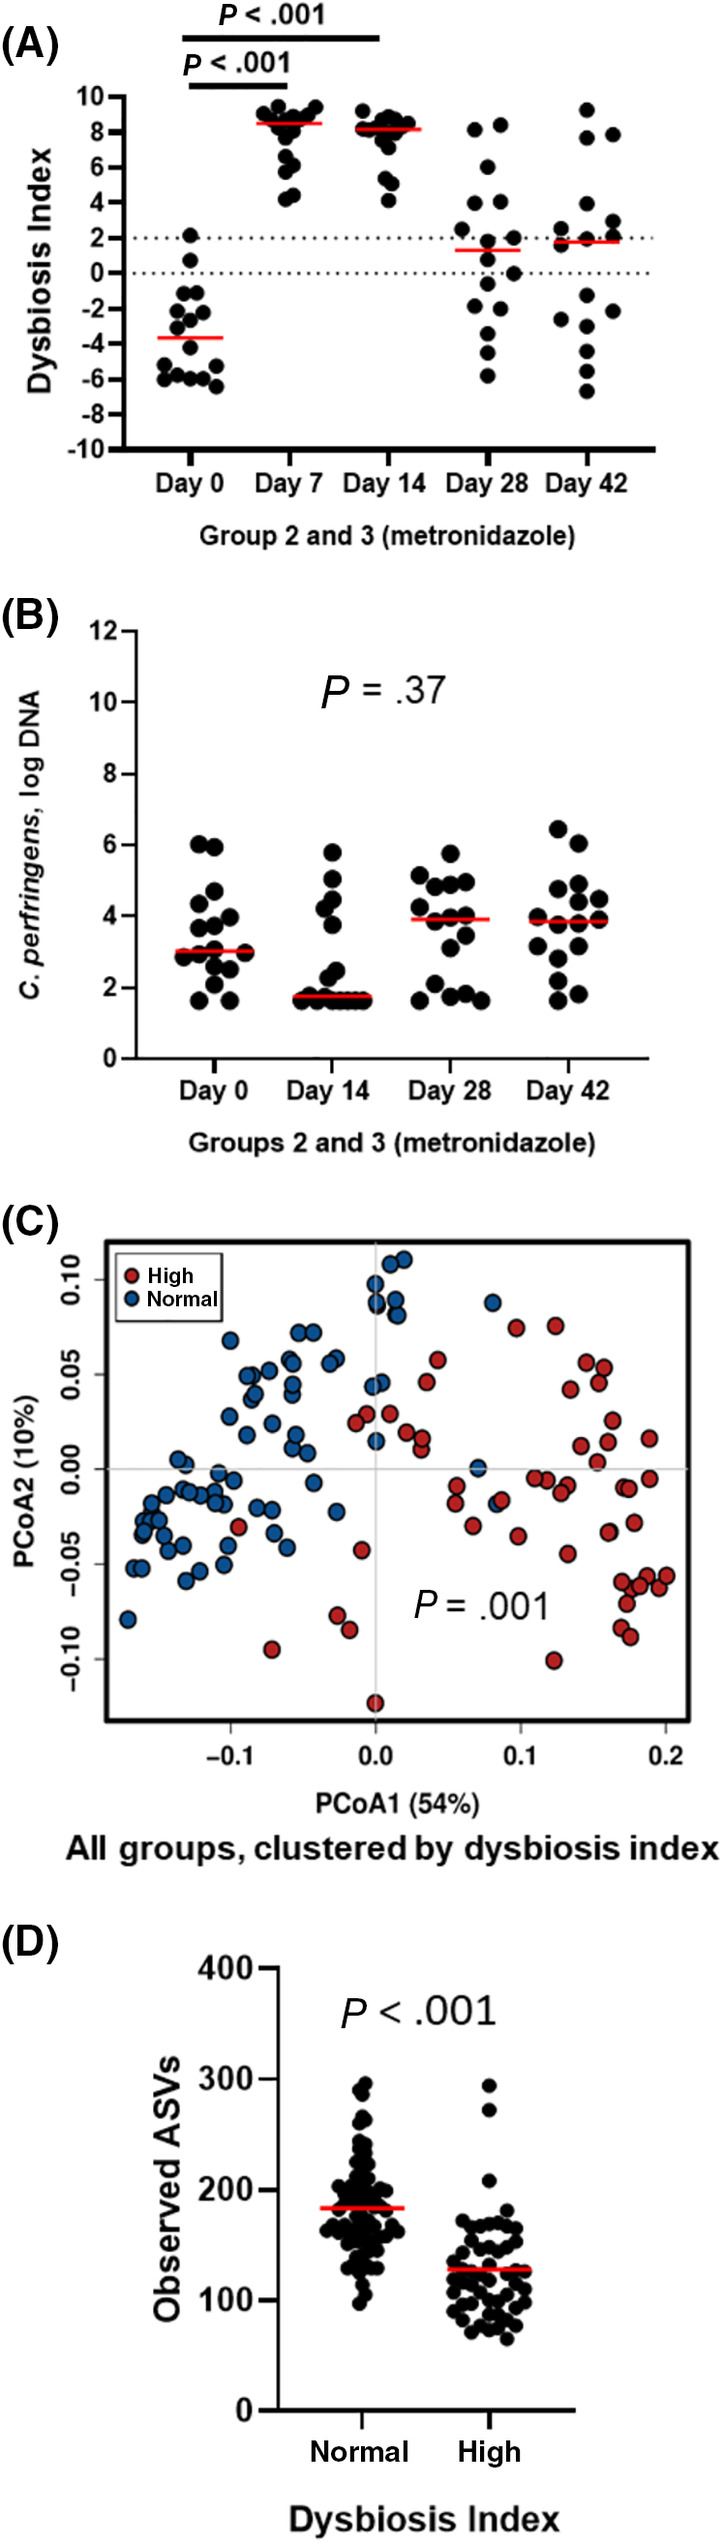
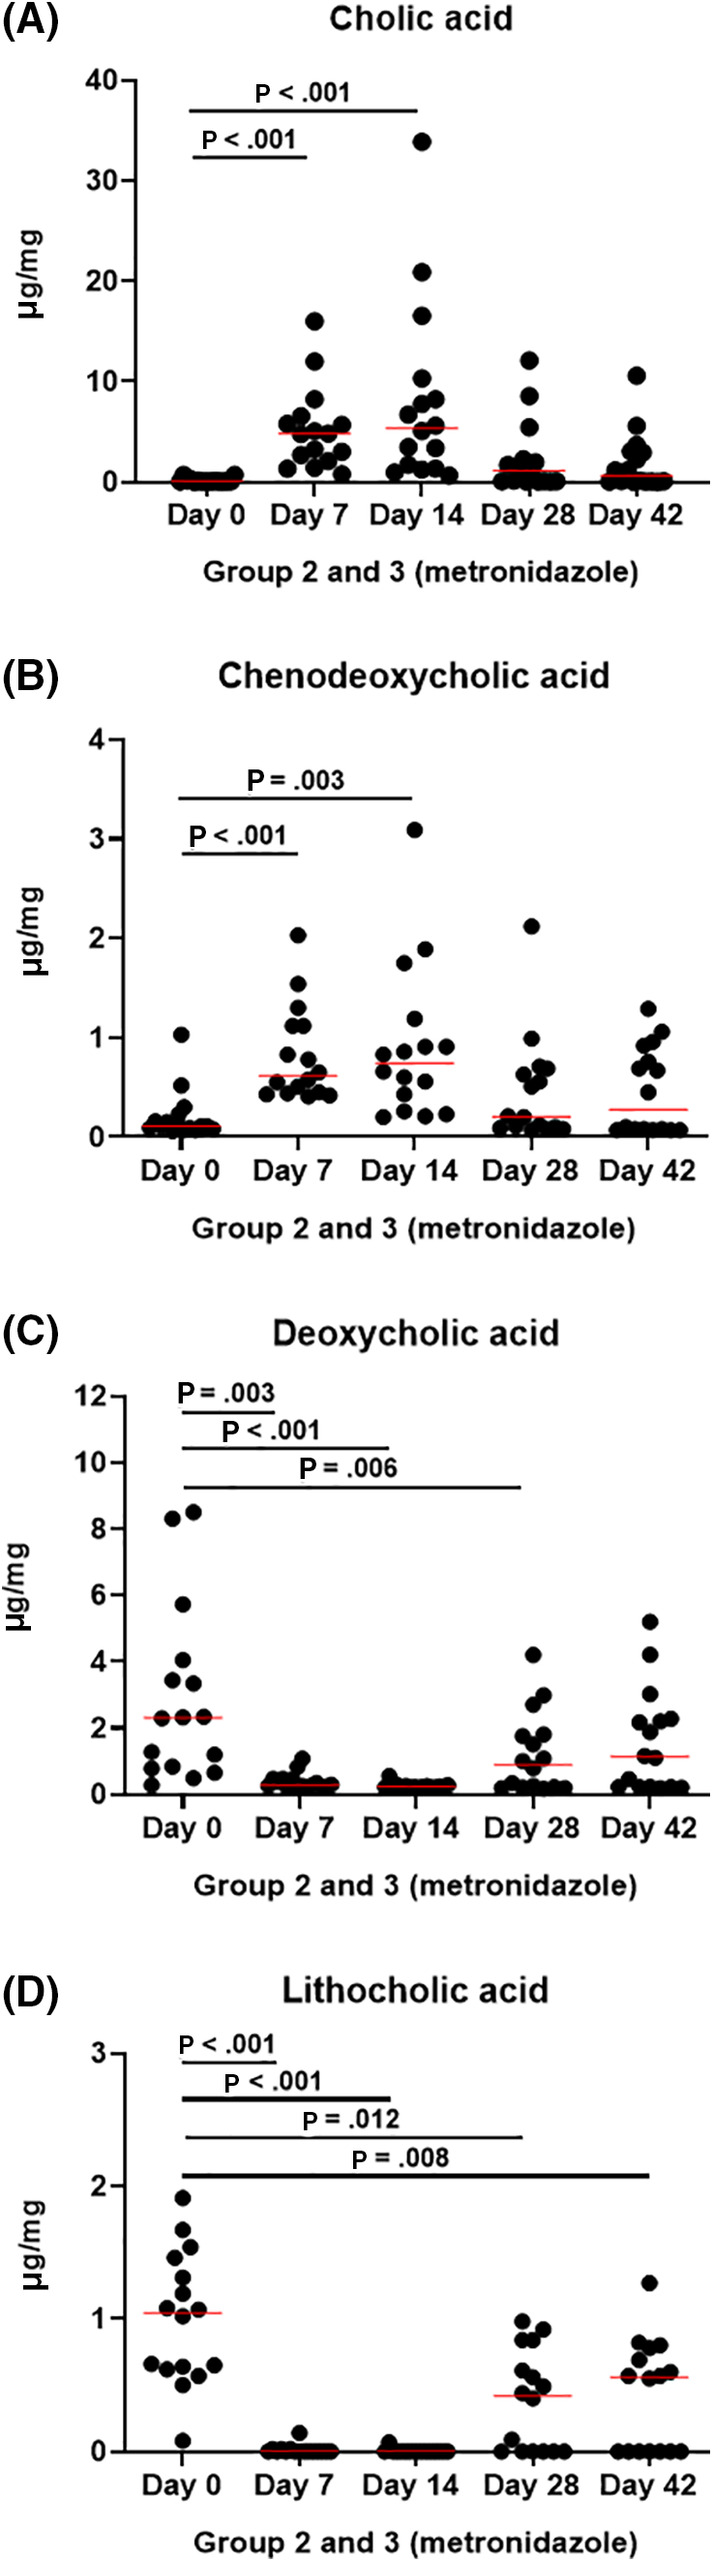
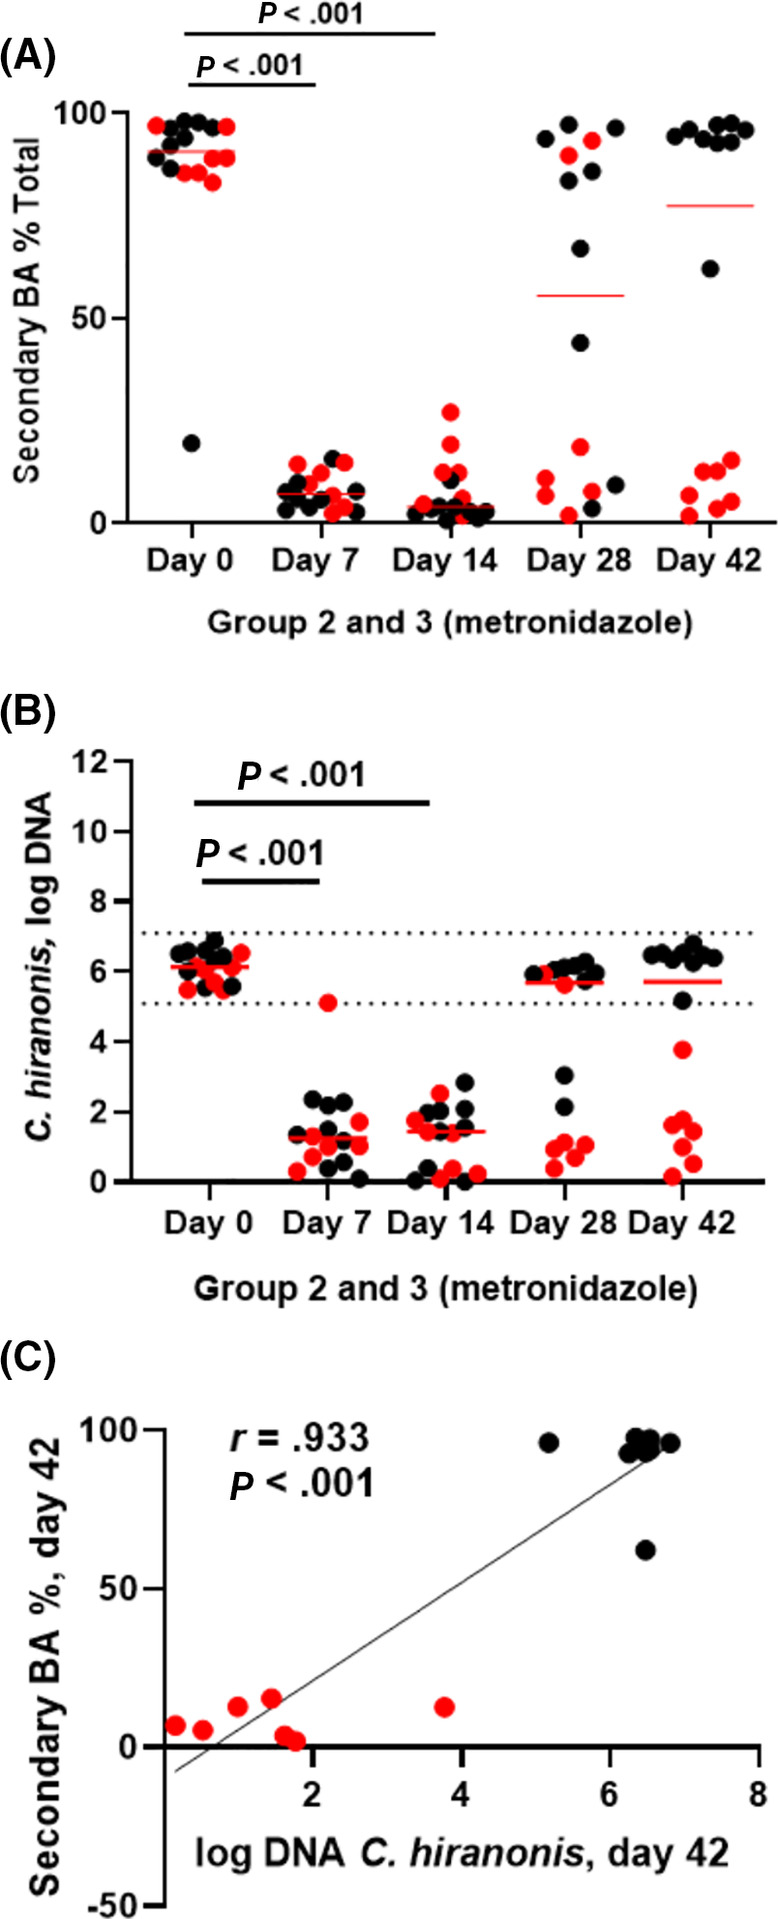
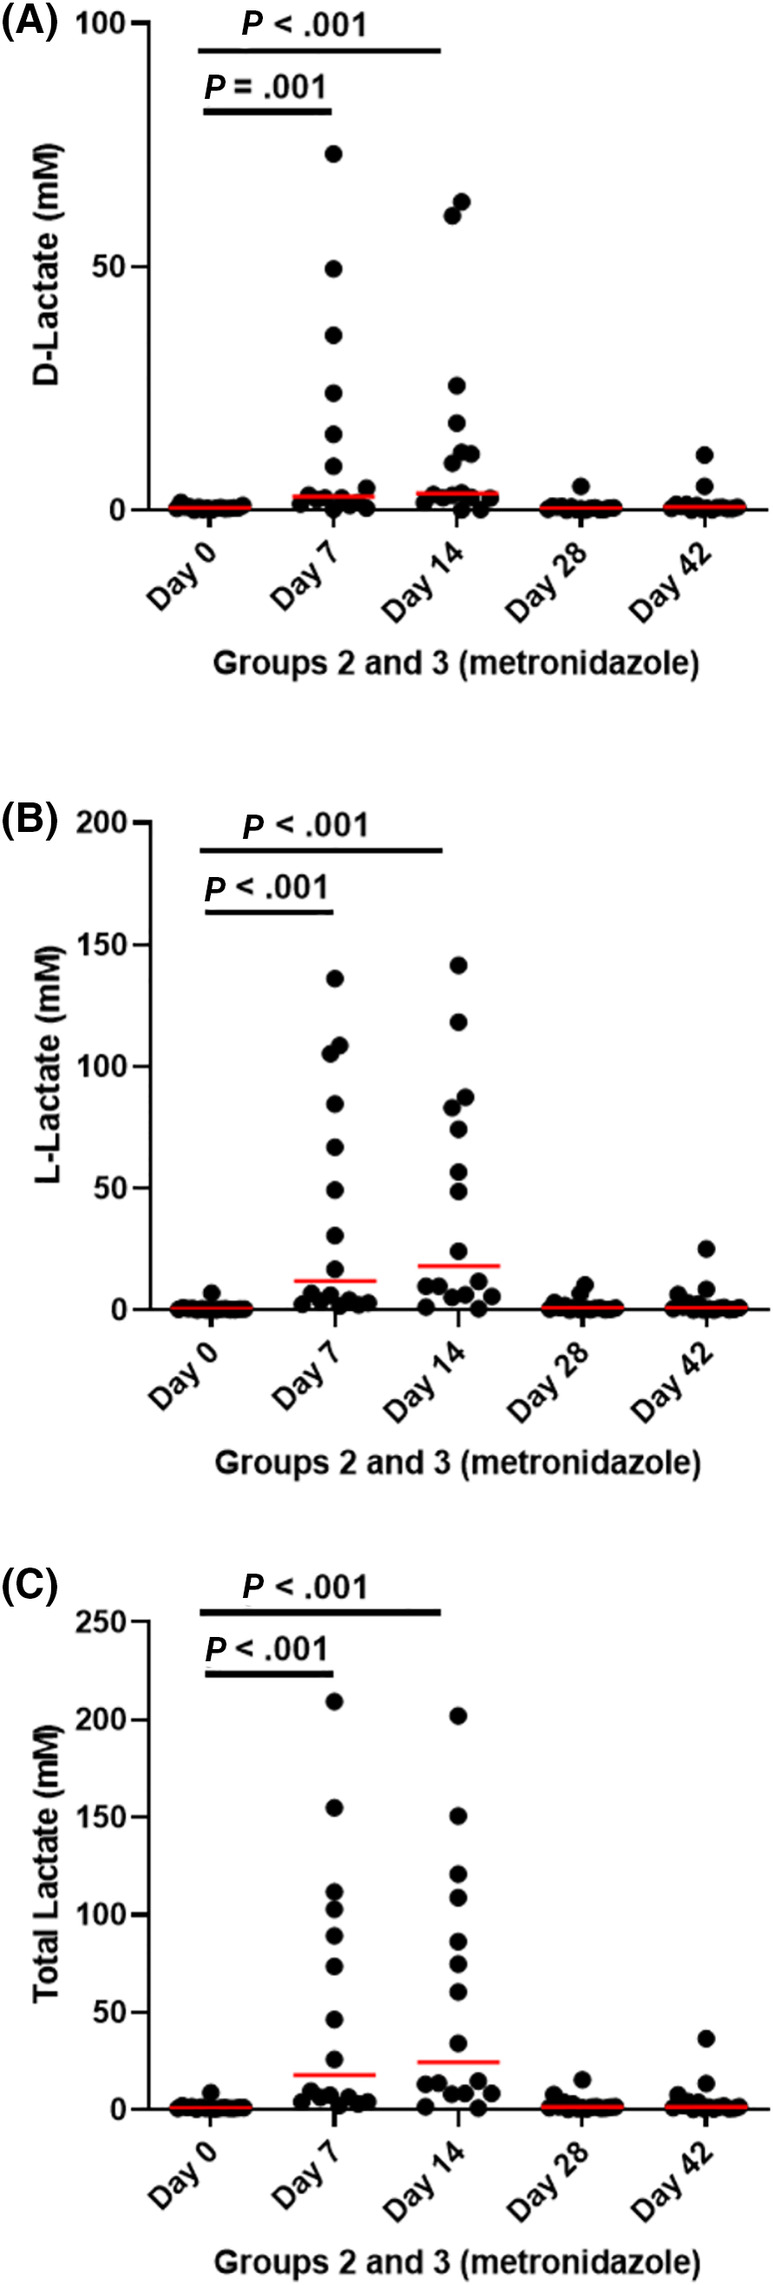
Results: No changes were observed in G1, or G2 during diet change. Metronidazole significantly changed microbiome composition in G2 and G3, including decreases in richness (P < .001) and in key bacteria such as Fusobacteria (q < 0.001) that did not fully resolve 4 weeks after metronidazole discontinuation. Fecal dysbiosis index was significantly increased (P < .001). Those changes were accompanied by increased fecal total lactate (P < .001), and decreased secondary BAs deoxycholic acid and lithocholic acid (P < .001).

Conclusion and clinical importance: Our results indicate a minimum 4-week effect of metronidazole on fecal microbiome and metabolome, supporting a cautious approach to prescription of metronidazole in dogs.

Keywords: antibiotic; bile acid metabolism; dysbiosis; fecal metabolome; microbiota; serum metabolome.


Conflict of interest statement

Rachel Pilla, Amanda B. Blake, Mohammad R. Khattab, Jonathan A. Lidbury, Jörg M. Steiner, and Jan S. Suchodolski are employed by the Gastrointestinal Laboratory at Texas A&M University, which provides assay for intestinal function and microbiota analysis on a fee‐for‐service basis. Frederic P. Gaschen, James W. Barr, Erin Olson, Julia Honneffer, Blake C. Guard, Dean Villanueva, and Mustafa K. AlShawaqfeh have no conflicts to declare.

Figures

FIGURE 1
FIGURE 1
Schematic timeline. Dogs were randomly assigned into 3 groups (n = 8 each). Group 1 (controls) was maintained on their usual diet for the entire study period and did not receive any intervention. Group 2 (diet change/metronidazole) was switched to a soy‐based hydrolyzed protein diet (blue line) for a total of 6 weeks, after which they received metronidazole PO for 2 weeks (weeks 7 and 8, red line). Group 3 (metronidazole) was maintained on their usual diet for the entire study period, and received metronidazole at the same dose as dogs in group 2 for 2 weeks (weeks 1 and 2, red line). Fecal samples were collected at all time points; serum samples were obtained at the time points indicated with gray arrows
FIGURE 2
FIGURE 2
Species richness (A), PCoA of weighted UniFrac distances of taxa (B), and phylum bar graph for group 2 (fed hydrolyzed protein diet for 6 weeks before metronidazole trial, n = 8) during dietary trial. No significant difference was observed in (A) species richness (observed ASVs), (B) beta‐diversity, or (C) overall phylum abundances after diet change. ASVs, amplicon sequence variants; PCoA, principal coordinate analysis
FIGURE 3
FIGURE 3
Species richness (A), PCoA of weighted UniFrac distances of taxa (B), and phylum bar graph for groups 2 (fed hydrolyzed protein diet for 6 weeks before metronidazole trial, n = 8) and 3 (maintained in various commercial diets, n = 8) during metronidazole trial. (A) Species richness (observed ASVs) was significantly decreased by metronidazole administration (days 7 and 14) but recovered after the discontinuation of metronidazole administration. (B) Beta‐diversity: red dots represent baseline samples. After 7 (green) and 14 (blue) days of metronidazole administration, microbial communities were significantly shifted (ANOSIM, P = .001 for both). Two (gray) and 4 (yellow) weeks after metronidazole was discontinued, samples clustered again with baseline samples; however, microbial communities remained significantly different from baseline (P = .02 and P = .01, respectively). (C) Phyla abundances are visibly altered during metronidazole administration (days 7 and 14), but return to baseline abundances 2 and 4 weeks after the end of metronidazole administration (days 28 and 42). ANOSIM, analysis of similarity; ASVs, amplicon sequence variants; PCoA, principal coordinate analysis
FIGURE 4
FIGURE 4
A, qPCR‐based dysbiosis index and, B, Clostridium perfringens abundance from groups 2 (fed hydrolyzed protein diet for 6 weeks before metronidazole trial, n = 8) and 3 (maintained in various commercial diets, n = 8) during metronidazole administration. C, PCoA of weighted UniFrac distances of taxa and, D, observed ASVs for all groups, clustered by dysbiosis index, are also shown. Dysbiosis index (A) is significantly increased (P < .001 for both) after 7 and 14 days of metronidazole administration, but no longer significantly different from baseline on days 28 and 42 (P = .74 and P > .99). Dotted lines indicate the reference interval: values below 0 indicate normobiosis, values between 0 and 2 are considered equivocal, and values above 2 indicate dysbiosis. Abundance of Clostridium perfringens (B) showed a trend towards reduction after 14 days of metronidazole (P = .37), but recovered after the end of administration. When clustered by DI (DI < 0 was considered normal, DI > 0 was considered high), samples with high DI (red) clustered separately from those with normal DI (blue) on a PCoA (weighted UniFrac, C), and showed lower richness (observed ASVs, D), showing that the qPCR‐based DI correlates well with sequencing results. ASVs, amplicon sequence variants; DI, dysbiosis index; PCoA, principal coordinate analysis; qPCR, quantitative polymerase chain reaction
FIGURE 5
FIGURE 5
Principal coordinate analysis of, A, fecal and, B, serum metabolites for groups 2 (fed hydrolyzed protein diet for 6 weeks before metronidazole trial, n = 8) and 3 (maintained in various commercial diets, n = 8) during metronidazole trial. In figure (A), red dots represent baseline fecal samples. After 7 (green) and 14 (blue) days of metronidazole administration, the overall fecal metabolome composition was significantly altered. After 2 weeks (cyan blue, day 28) and 4 weeks (pink, day 42) from the end of administration, most fecal samples clustered again with baseline samples. In figure (B), red dots represent baseline serum samples. Overall, serum metabolome composition was not significantly affected by metronidazole administration (day 14, green), although a few outliers could be seen after 4 weeks from the end of administration (day 42, blue)
FIGURE 6
FIGURE 6
Bile acid quantification in fecal samples from groups 2 (fed hydrolyzed protein diet for 6 weeks before metronidazole trial, n = 8) and 3 (maintained in various commercial diets, n = 8) during metronidazole administration. Primary bile acids, (A) cholic acid, and (B) chenodeoxycholic acid, were increased during metronidazole administration (days 7 and 14), but returned to baseline values after the end of administration (days 28 and 42). In contrast, secondary bile acids (C) deoxycholic acid, and (D) lithocholic acid were decreased during metronidazole administration. After the end of administration secondary bile acids remaining decreased in some dogs
FIGURE 7
FIGURE 7
A, Secondary bile acid percentages, B, Clostridium hiranonis abundance, and, C, correlation between them on day 42 in fecal samples from groups 2 (fed hydrolyzed protein diet for 6 weeks before metronidazole trial, n = 8) and 3 (maintained in various commercial diets, n = 8) during metronidazole administration. In figure (A), secondary bile acid production was decreased during metronidazole administration, and did not recover after 4 weeks from the end of administration (day 42) in 7 dogs (highlighted in red). The same 7 dogs had a low abundance of C. hiranonis (B), which correlated with the percentage of secondary bile acids (C). Only 3/7 of these dogs developed diarrhea during metronidazole administration. Dotted lines (B) indicate the reference interval
FIGURE 8
FIGURE 8
A, d‐lactate, B, l‐lactate, and, C, total lactate in fecal samples from groups 2 (fed hydrolyzed protein diet for 6 weeks before metronidazole trial, n = 8) and 3 (maintained in various commercial diets, n = 8) during metronidazole administration. Lactate was significantly increased during metronidazole administration, but returned to baseline levels after 2 weeks from the end of administration

References

    1. Barko PC, McMichael MA, Swanson KS, et al. The gastrointestinal microbiome: a review. J Vet Intern Med. 2018;32:9‐25. - PMC - PubMed
    1. Machiels K, Joossens M, Sabino J, et al. A decrease of the butyrate‐producing species Roseburia hominis and Faecalibacterium prausnitzii defines dysbiosis in patients with ulcerative colitis. Gut. 2014;63:1275‐1283. - PubMed
    1. Whitfield‐Cargile CM, Cohen ND, Chapkin RS, et al. The microbiota‐derived metabolite indole decreases mucosal inflammation and injury in a murine model of NSAID enteropathy. Gut Microbes. 2016;7:246‐261. - PMC - PubMed
    1. Duboc H, Rajca S, Rainteau D, et al. Connecting dysbiosis, bile‐acid dysmetabolism and gut inflammation in inflammatory bowel diseases. Gut. 2013;62:531‐539. - PubMed
    1. Pavlidis P, Powell N, Vincent RP, Ehrlich D, Bjarnason I, Hayee B. Systematic review: bile acids and intestinal inflammation‐luminal aggressors or regulators of mucosal defence? Aliment Pharmacol Ther. 2015;42:802‐817. - PubMed

Publication types