

Association between breast cancer risk and disease aggressiveness: Characterizing underlying gene expression patterns
- PMID: 32856720
- PMCID: PMC7818270
- DOI: 10.1002/ijc.33270
Association between breast cancer risk and disease aggressiveness: Characterizing underlying gene expression patterns
Abstract
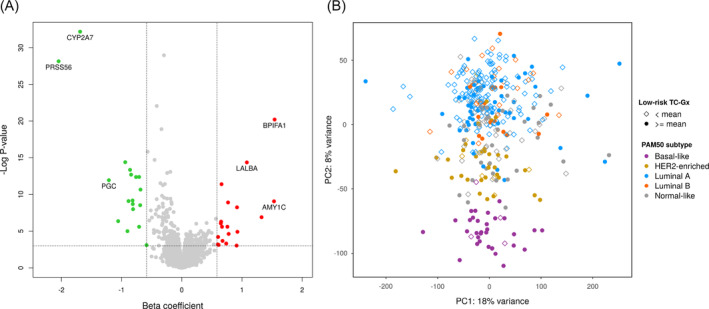
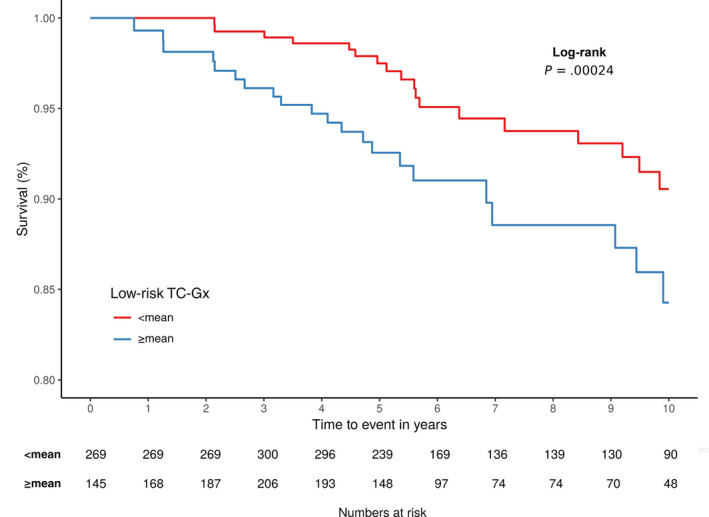
The association between breast cancer risk defined by the Tyrer-Cuzick score (TC) and disease prognosis is not well established. Here, we investigated the relationship between 5-year TC and disease aggressiveness and then characterized underlying molecular processes. In a case-only study (n = 2474), we studied the association of TC with molecular subtypes and tumor characteristics. In a subset of patients (n = 672), we correlated gene expression to TC and computed a low-risk TC gene expression (TC-Gx) profile, that is, a profile expected to be negatively associated with risk, which we used to test for association with disease aggressiveness. We performed enrichment analysis to pinpoint molecular processes likely to be altered in low-risk tumors. A higher TC was found to be inversely associated with more aggressive surrogate molecular subtypes and tumor characteristics (P < .05) including Ki-67 proliferation status (P < 5 × 10-07 ). Our low-risk TC-Gx, based on the weighted sum of 37 expression values of genes strongly correlated with TC, was associated with basal-like (P < 5 × 10-13 ), HER2-enriched subtype (P < 5 × 10-07 ) and worse 10-year breast cancer-specific survival (log-rank P < 5 × 10-04 ). Associations between low-risk TC-Gx and more aggressive molecular subtypes were replicated in an independent cohort from The Cancer Genome Atlas database (n = 975). Gene expression that correlated with low TC was enriched in proliferation and oncogenic signaling pathways (FDR < 0.05). Moreover, higher proliferation was a key factor explaining the association with worse survival. Women who developed breast cancer despite having a low risk were diagnosed with more aggressive tumors and had a worse prognosis, most likely driven by increased proliferation. Our findings imply the need to establish risk factors associated with more aggressive breast cancer subtypes.
Keywords: Tyrer-Cuzick risk score; breast cancer; gene expression; prognosis; subtypes.
© 2020 The Authors. International Journal of Cancer published by John Wiley & Sons Ltd on behalf of Union for International Cancer Control.
Conflict of interest statement
The authors declare no conflict of interest.
Figures
Comment in
-
Comments on "Association between breast cancer risk and disease aggressiveness: Characterizing underlying gene expression patterns".Int J Cancer. 2021 Sep 15;149(6):1398. doi: 10.1002/ijc.33605. Epub 2021 May 6. Int J Cancer. 2021. PMID: 33890298 Free PMC article. No abstract available.
References
-
- Cintolo‐Gonzalez JA, Braun D, Blackford AL, et al. Breast cancer risk models: a comprehensive overview of existing models, validation, and clinical applications. Breast Cancer Res Treat. 2017;164:263‐284. - PubMed
-
- Tyrer J, Duffy SW, Cuzick J. A breast cancer prediction model incorporating familial and personal risk factors. Stat Med. 2004;23:1111‐1130. - PubMed
-
- Shieh Y, Eklund M, Madlensky L, et al. Athena breast health network I. breast cancer screening in the precision medicine era: risk‐based screening in a population‐based trial. J Natl Cancer Inst. 2017;109:djw290. - PubMed
-
- Holm J, Li J, Darabi H, et al. Associations of breast Cancer risk prediction tools with tumor characteristics and metastasis. J Clin Oncol. 2016;34:251‐258. - PubMed
Publication types
MeSH terms
Substances
LinkOut - more resources
Full Text Sources
Medical
Research Materials
Miscellaneous
