

doi: 10.1001/jama.2020.14590.
Trends in Obesity Prevalence by Race and Hispanic Origin-1999-2000 to 2017-2018
Affiliations
- PMID: 32857101
- PMCID: PMC7455882
- DOI: 10.1001/jama.2020.14590
Item in Clipboard
Trends in Obesity Prevalence by Race and Hispanic Origin-1999-2000 to 2017-2018
JAMA.
.
Abstract
This study uses NHANES data to assess trends in obesity and severe obesity stratified by race and Hispanic origin among US residents from 1999 to 2018.
Conflict of interest statement
Figures
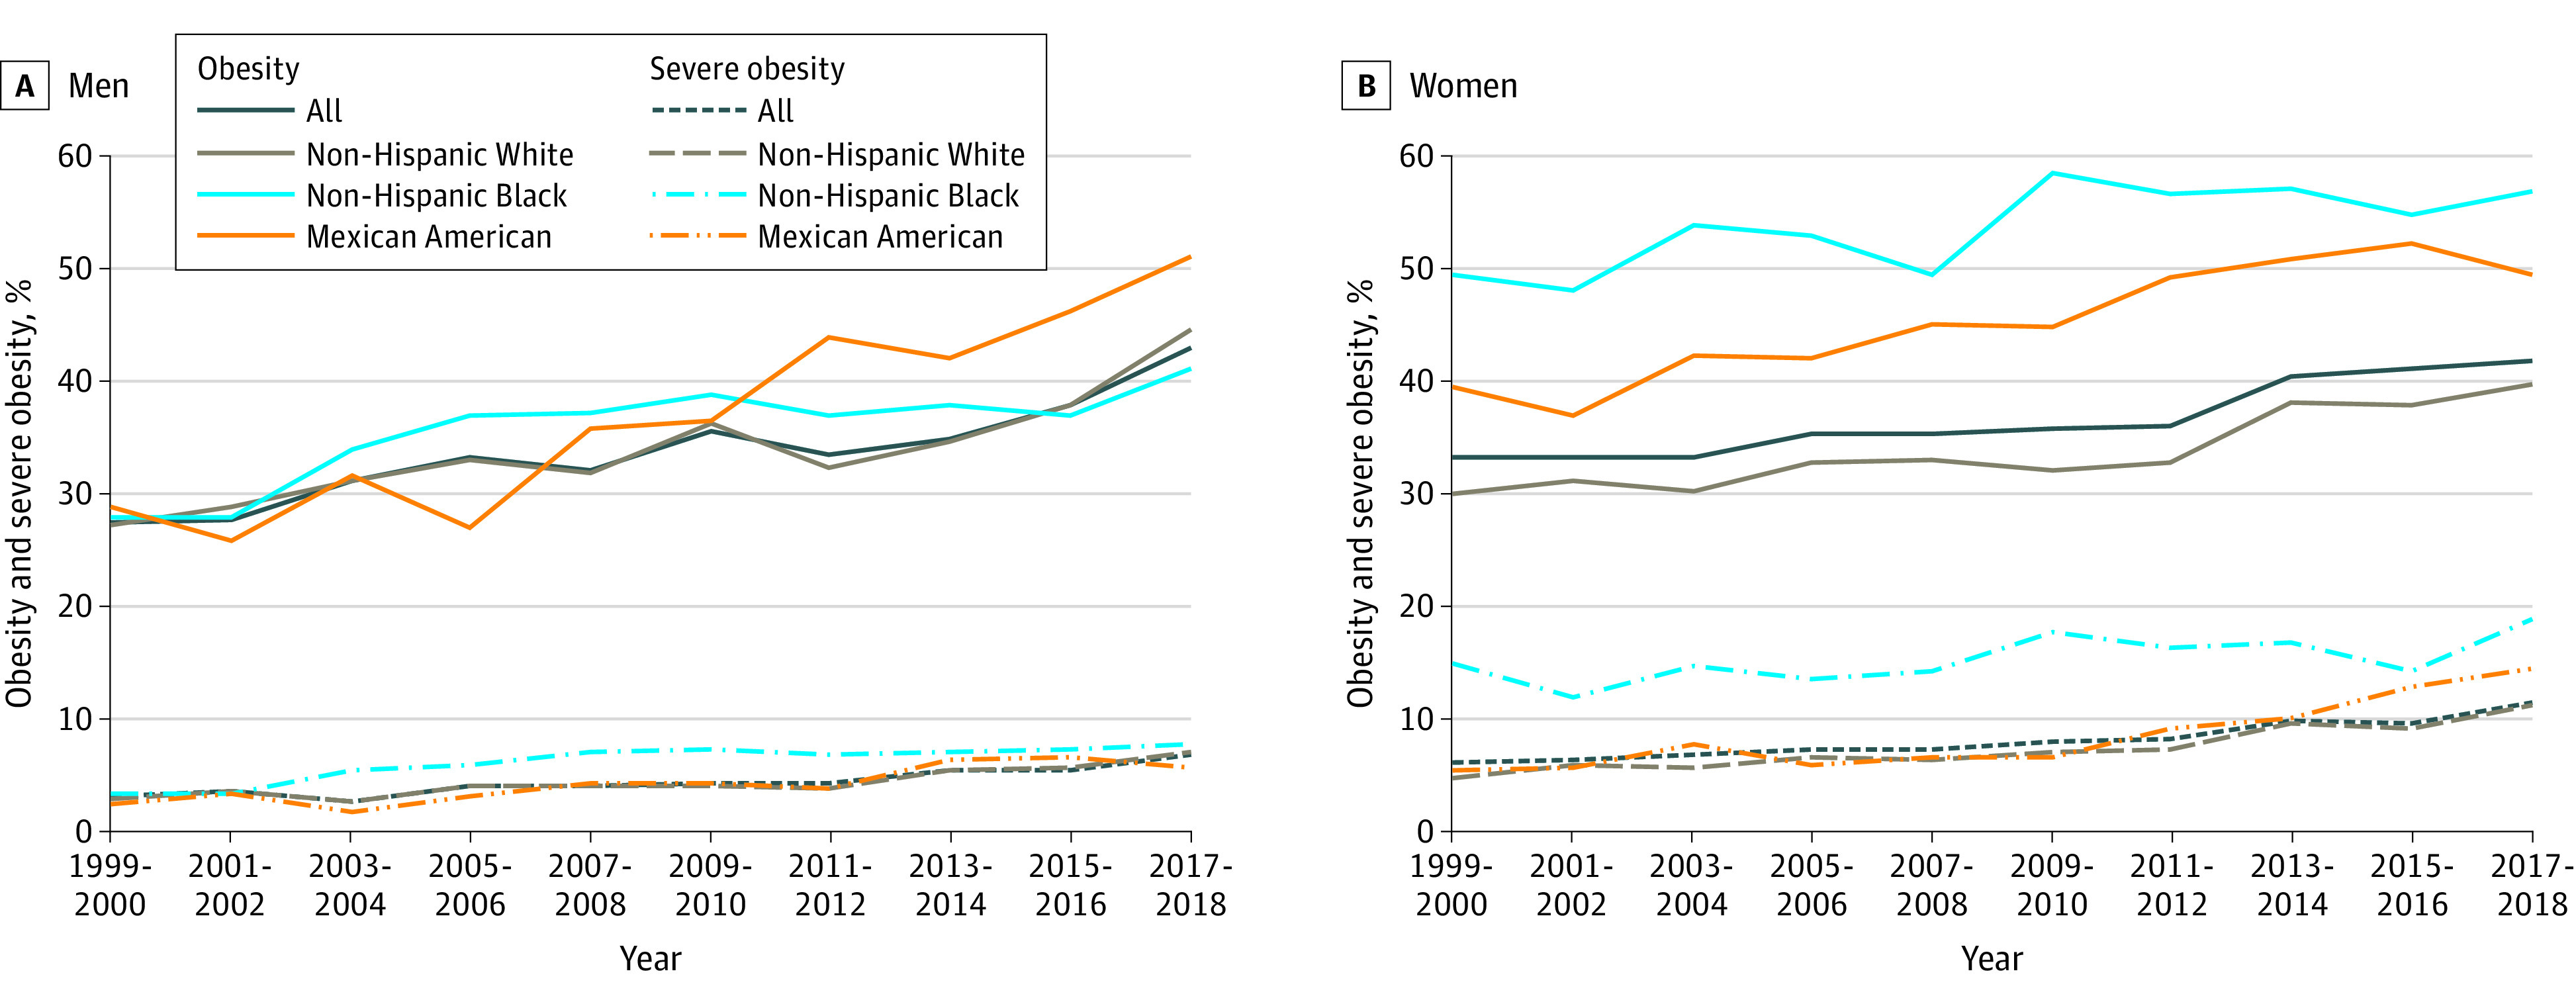
aNational Health and Nutrition Examination Survey data, prevalence estimates are weighted and age-adjusted to the projected 2000 Census population using age groups 20-39, 40-59, and 60 or older. Some estimates are potentially unreliable, due to CI width of more than 5% and relative CI width of more than 130% (severe obesity, non-Hispanic White men 2011-2012; severe obesity, Mexican American men 2001-2002, 2017-2018, and women 2001-2002) or due to fewer than 10 individuals with severe obesity (Mexican American men 2003-2004). The estimate for severe obesity in Mexican American men 2003-2004 was potentially unreliable due to the number of individuals with severe obesity being fewer than 10. Sample size ranges are non-Hispanic White men 879-1395; non-Hispanic Black men 374-662; Mexican American men 266-538; non-Hispanic White women 860-1447; non-Hispanic Black women 422-702; and Mexican American women 237-567. Significant linear trends (P < .001) for all groups except for (1) obesity among non-Hispanic Black men, which increased from 1999-2000 to 2005-2006 (slope, 3.4; 95% CI, 1.8-5.0; P < .001) and then leveled after 2005-2006 (slope, 0.3; 95% CI, −0.6 to 1.2; P = .46; difference in slopes, P = .007); (2) severe obesity among non-Hispanic Black women (P = .02); and (3) severe obesity among Mexican American women, which was level 1999-2000 to 2009-2010 (slope, 0.1; 95% CI, −0.5 to 0.6; P = .81) and increased after 2009-2010 (slope, 2.1; 95% CI, 1.1-3.1; P < .001; difference in slopes, P = .004).
Comment in
-
Obesity and Hypertension in the Time of COVID-19.JAMA. 2020 Sep 22;324(12):1163-1165. doi: 10.1001/jama.2020.16753. JAMA. 2020. PMID: 32902581 No abstract available.
References
-
- CDC National Center for Health Statistics NHANES response rates and population totals. Last reviewed August 4, 2020. Accessed August 4, 2020. https://wwwn.cdc.gov/nchs/nhanes/ResponseRates.aspx
-
- Grummer-Strawn LM, Reinold C, Krebs NF; Centers for Disease Control and Prevention (CDC) . Use of World Health Organization and CDC growth charts for children aged 0-59 months in the United States. MMWR Recomm Rep. 2010;59(RR-9):1-15. - PubMed
-
- Kelly AS, Barlow SE, Rao G, et al. ; American Heart Association Atherosclerosis, Hypertension, and Obesity in the Young Committee of the Council on Cardiovascular Disease in the Young, Council on Nutrition, Physical Activity and Metabolism, and Council on Clinical Cardiology . Severe obesity in children and adolescents: identification, associated health risks, and treatment approaches: a scientific statement from the American Heart Association. Circulation. 2013;128(15):1689-1712. doi: 10.1161/CIR.0b013e3182a5cfb3 - DOI - PubMed
-
- Ingram DD, Malec DJ, Makuc DM, et al. National Center for Health Statistics guidelines for analysis of trends. Vital Health Stat 2. 2018;2(179):1-71. - PubMed
-
- Parker JD, Talih M, Malec DJ, et al. National Center for Health Statistics data presentation standards for proportions. Vital Health Stat 2. 2017;2(175):1-22. - PubMed
