. 2020 Sep 25;48(17):9589-9605.
doi: 10.1093/nar/gkaa702.

The conserved ribonuclease aCPSF1 triggers genome-wide transcription termination of Archaea via a 3'-end cleavage mode

Affiliations

The conserved ribonuclease aCPSF1 triggers genome-wide transcription termination of Archaea via a 3'-end cleavage mode

Lei Yue et al. Nucleic Acids Res. .

Abstract

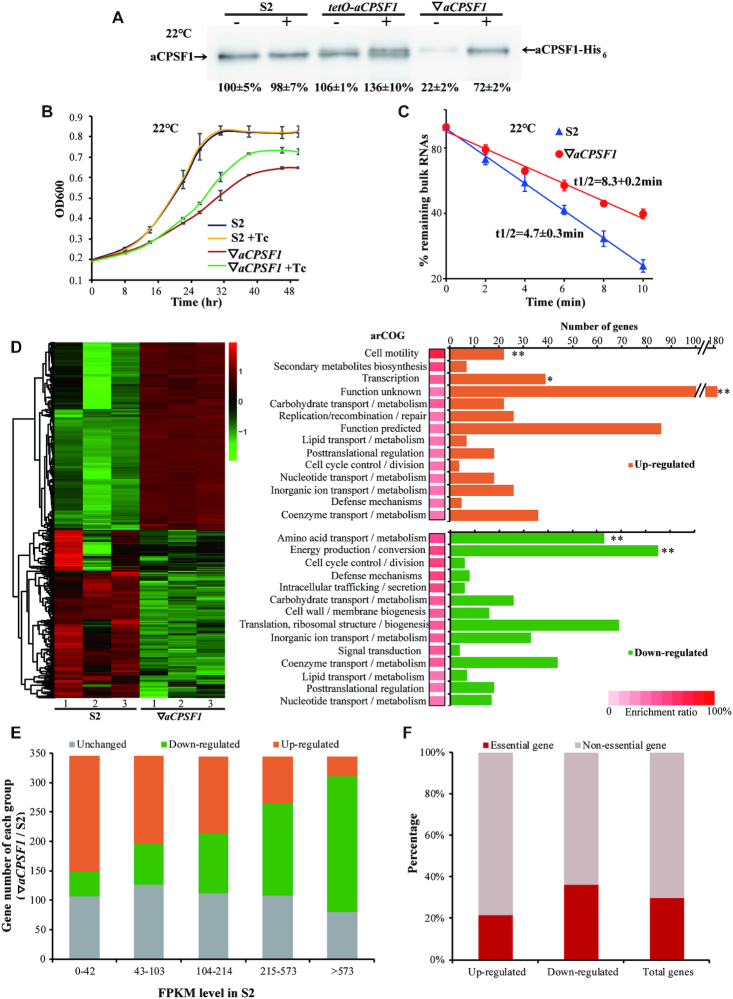
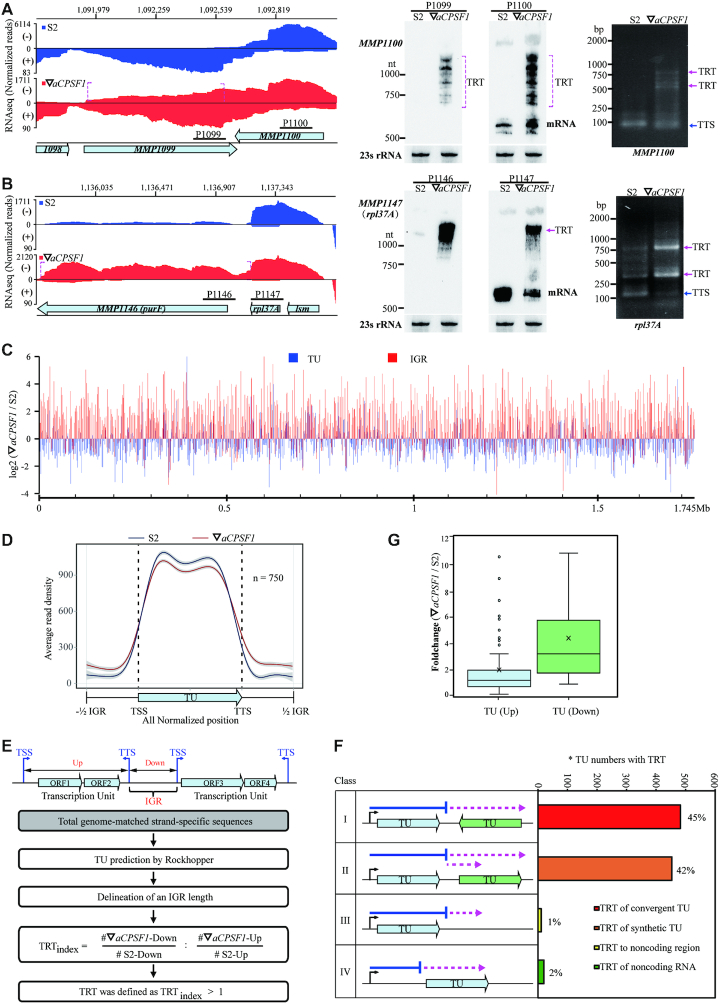
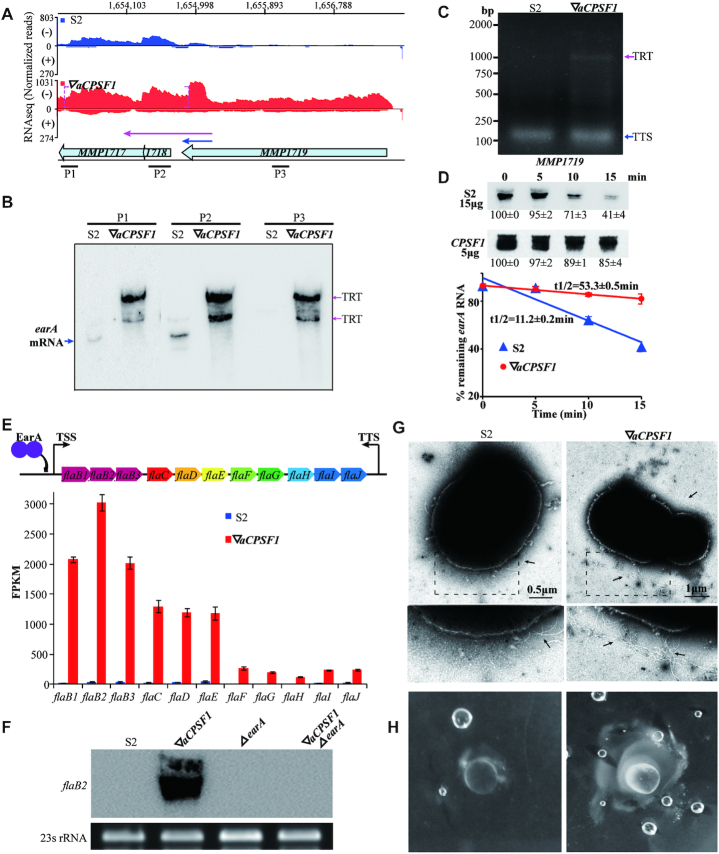
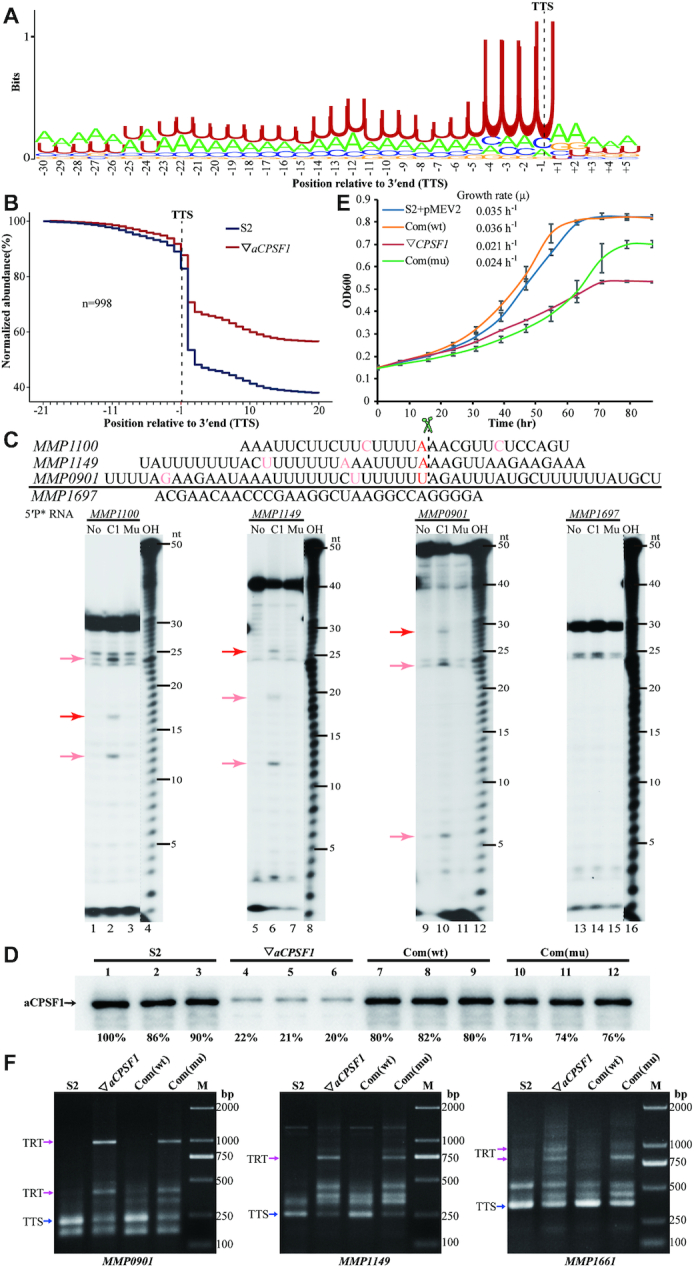
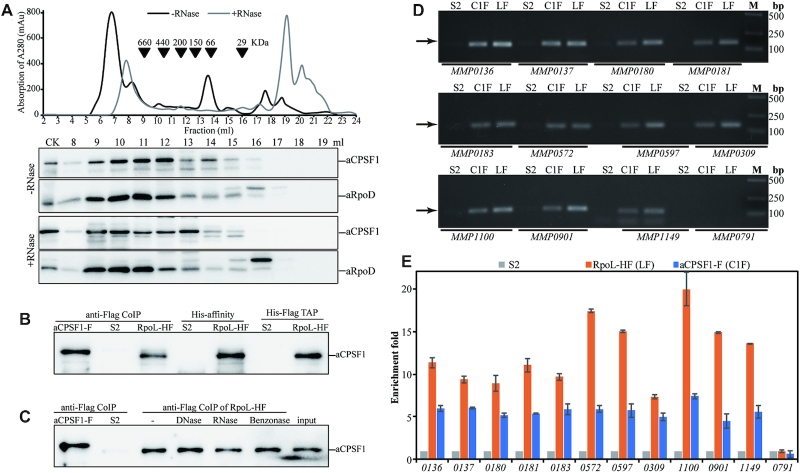
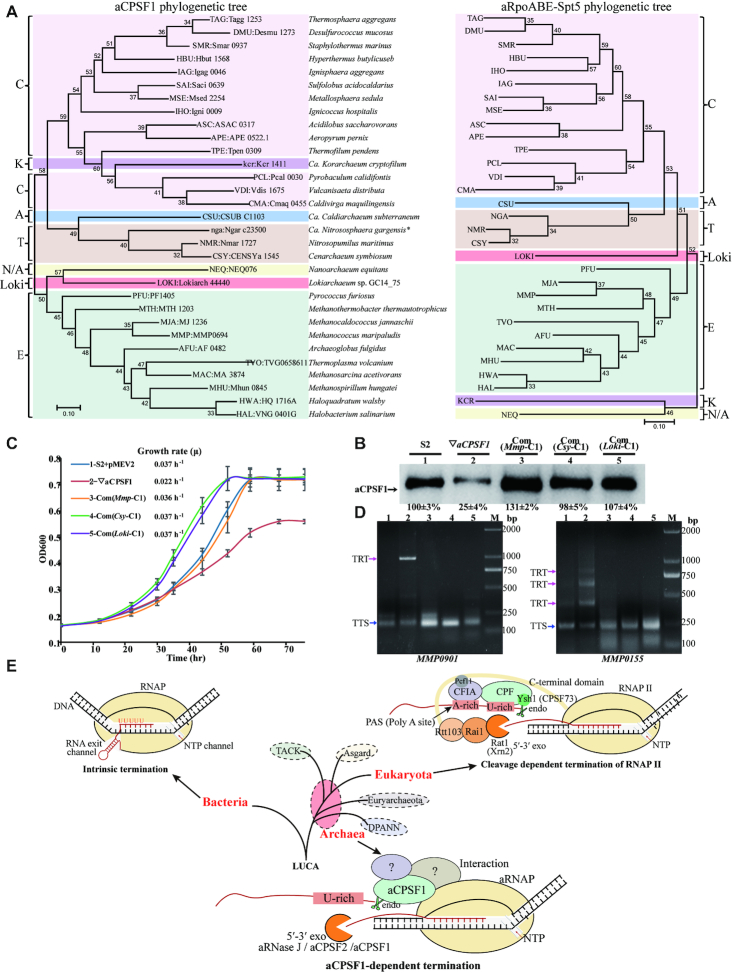
Transcription termination defines accurate transcript 3'-ends and ensures programmed transcriptomes, making it critical to life. However, transcription termination mechanisms remain largely unknown in Archaea. Here, we reported the physiological significance of the newly identified general transcription termination factor of Archaea, the ribonuclease aCPSF1, and elucidated its 3'-end cleavage triggered termination mechanism. The depletion of Mmp-aCPSF1 in Methanococcus maripaludis caused a genome-wide transcription termination defect and disordered transcriptome. Transcript-3'end-sequencing revealed that transcriptions primarily terminate downstream of a uridine-rich motif where Mmp-aCPSF1 performed an endoribonucleolytic cleavage, and the endoribonuclease activity was determined to be essential to the in vivo transcription termination. Co-immunoprecipitation and chromatin-immunoprecipitation detected interactions of Mmp-aCPSF1 with RNA polymerase and chromosome. Phylogenetic analysis revealed that the aCPSF1 orthologs are ubiquitously distributed among the archaeal phyla, and two aCPSF1 orthologs from Lokiarchaeota and Thaumarchaeota could replace Mmp-aCPSF1 to terminate transcription of M. maripaludis. Therefore, the aCPSF1 dependent termination mechanism could be widely employed in Archaea, including Lokiarchaeota belonging to Asgard Archaea, the postulated archaeal ancestor of Eukaryotes. Strikingly, aCPSF1-dependent archaeal transcription termination reported here exposes a similar 3'-cleavage mode as the eukaryotic RNA polymerase II termination, thus would shed lights on understanding the evolutionary linking between archaeal and eukaryotic termination machineries.


Figures

Figure 1.
Figure 1.
Depleted expression of Mmp-aCPSF1 results in reduced growth, prolonged RNA lifespan, and a disordered transcriptome of 22°C-cultured M. maripaludis. (A) Western blot assayed Mmp-aCPSF1 protein abundance (percentages referenced to lane 1) with (+) or without (–) 100 μg/ml of tetracycline in 22°C-grown S2 (wild-type), tetO-aCPSF1, and ▽aCPSF1. Averages and standard deviations of three replicates are shown. aCPSF1 and aCPSF1-His6 flanking the gel point the indigenous- and hpt-site inserted His6-Mmp-aCPSF1, respectively. The schematic depicting the construction of tetO-aCPSF1 and ▽aCPSF1 was shown in Supplementary Figure S1A. (B, C) Depletion of Mmp-aCPSF1 reduced 22°C-growth (B) and prolonged the bulk mRNA half-lives (C). Three batches of cultures of strains S2 and ▽aCPSF1 with or without tetracycline (Tc) were measured, and the averages and standard deviations are shown. Bulk mRNA half-lives were determined by quantifying the [3H]-uridine signal attenuation. (D) Hierarchical clustering (left) and functional category (right) analysis of the differential transcribed genes in three batches of 22°C-cultures of S2 and ▽aCPSF1. Heat plot representation of the differential expression ratio (log2) is shown with color intensity. Green and red represent the minima and maxima fold, respectively. The functional category enrichment ratio (a bar with gradient red intensity at lower right corner) was percentages of the up (orange)- and down (green)-regulated gene numbers (horizontal axis) in total genes of each arCOG categories (Supplementary Table S4). The significance statistical analysis was analyzed by Fisher's exact test with Benjamini-Hochberg multiple-testing correction to calculate P-values for each function category, and ** and * respectively mark the significant enriched categories with P < 0.01 and < 0.05 (Supplementary Table S4). (E) Hierarchical grouping of the differential transcribed genes caused by Mmp-aCPSF1 depletion. Based on the FPKMs in strain S2, transcripts were grouped into five ranks (<42, 43–103, 104–214, 215–573 and >573 of FPKMs), and then the up- and down-regulated and unchanged transcript numbers in each rank in ▽aCPSF1 were counted. (F) According to the gene essentiality in M. maripaludis defined by Sarmiento et al. (29), percentages of essential and non-essential genes falling in the up- and down-regulated and unchanged groups in ▽aCPSF1 were calculated, respectively.
Figure 2.
Figure 2.
The depletion of Mmp-aCPSF1 causes a genome-wide transcription read-through (TRT). (A, B) The strand-specific RNA-seq mapping profiles (left) show 3′-end extensions (dot magenta brackets) of MMP1100 (A) and MMP1147 (B) in ▽aCPSF1 (red) referenced to that in strain S2 (blue). Numbers on top indicate the genomic sites, and bullets show genes. Northern blot (middle) assayed TRTs using the respective probes (horizontal sticks in A), and 23S rRNA was used as an internal control. 3′RACE (right) assayed transcription termination sites (TTSs) and TRTs. (C) Pair-wise comparison of genome-wide Log2 FPKM ratios of transcription units (TUs) and the intergenic regions (IGRs) between strain S2 and ▽aCPSF1. The beneath ruler indicates the genomic location. (D) A metaplot diagram shows the average reads mapping pattern of TUs and the flanking IGRs in S2 and ▽aCPSF1 based on normalization of 750 TUs that have an IGR length >100 nt. (E) A flowchart depicts TRT identification and TRTindex calculation. (F) A diagram shows percentages of each TRT type occurred in ▽aCPSF1. Bent arrows and horizontal blue lines indicate TSS and transcript lengths in strain S2, respectively, and dot magenta arrows indicate transcripts that occur TRT in ▽aCPSF1. *, TU numbers occurring TRTs. (G) Boxplots show the FPKM fold changes of Type II TRT in (F) for the upstream TUs that generate TRTs (TU (Up)) and the tandem downstream TUs (TU (Down)), respectively.
Figure 3.
Figure 3.
TRT upregulates the archaella regulator earA and results in exuberant archaella along with elevated motility in 22°C-cultured ▽aCPSF1. (A) A diagram shows the RNA-seq reads mapped to earA (MMP1718) and the adjacent genes in S2 (blue) and ▽aCPSF1 (red). Dot magenta brackets show that Mmp-aCPSF1 depletion caused 3′-end extension. Numbers on top indicate the mapped genomic regions, and bullets represent the corresponding genes. (B) Northern blot assays MMP1719 TRT into earA and MMP1717 by using DNA probes P1, P2 and P3 shown in (A). (C) 3′RACE amplified fragments contain the transcription termination site (TTS) in S2 and TRT of MMP1719 in ▽aCPSF1, respectively. (D) Northern blot assays the earA transcript stability in S2 and ▽aCPSF1 (upper panel) using probe P2. Hybridization signal intensities were estimated using Quantity One (v4.6.6) and the residual percentages at indicated times referenced to that at 0 min were shown at beneath. Half-lives (t1/2) were calculated from the regression curve of remnant mRNA contents along time (lower panel). Experiments were performed on three batches of cultures, and the averages and standard deviations are shown. (E) A schematic depicts gene organization of the fla operon and its activator EarA (upper). TTS is located 104 nt downstream the stop codon (nt 1618850) of fla J. The histograms (lower) show the FPKMs of the fla operon genes in S2 and ▽aCPSF1. (F) Northern blot assays the flaB2 transcript abundances in strains S2, ▽aCPSF1, earA deletion (ΔearA), and the double mutation of Mmp-aCPSF1 depletion and earA deletion (▽aCPSF1ΔearA). 23S rRNA was used as the sample control. (G) Representative electron microscopic images show more archaella (arrows pointed) at ▽aCPSF1 than S2 cells (upper panels) and in the magnified regions (dot framed, lower panels). Archaella were observed for each 20 cells, and additional representative images are shown in Supplementary Figure S5. (H) Mobility assay displays larger lawn and more bubbles in ▽aCPSF1 than that in S2 when grown on 0.25% agar.
Figure 4.
Figure 4.
The terminator motif of M. maripaludis determined by Term-seq, and the ribonuclease activity of Mmp-aCPSF1 on the motif is essential to transcription termination. (A) Using WebLogo (v2.8.2) (41), a logo representation was generated for the sequence motif upstream of 998 primary TTSs that are defined by Term-seq. (B) A metaplot diagram shows the average reads of each 20 nt upstream and downstream of the 998 primary TTSs (dot black line) in 22°C-cultured S2 (blue line) and ▽aCPSF1 (red line). (C) The ribonuclease activity of Mmp-aCPSF1 was assayed on three representative uridine-rich RNAs derived from the TTSs (red bases) flanking sequences of MMP1100, MMP1149 and MMP0901 (upper). A uridine tract-less RNA fragment from MMP1697 was used as a control. A urea sequencing gel displays the enzymatic products (lower). No, C1, and Mu indicate the assays without, and with addition of Mmp-aCPSF1 and the catalytic inactive mutant (H243A/H246A), respectively. Red and pink arrows point to the presumed cleavage products at TTS and other sites downstream uridine-rich sequences. OH, a hydroxyl ladder indicates migrations of RNA products. (D) Western blot assays the Mmp-aCPSF1 protein abundances in three batches of 22°C-grown strains S2, ▽aCPSF1, Mmp-com(Mmp-C1) (Com(wt)) and Mmp-com(Mmp-C1mu) (Com(mu)). (E) Growth curves of the four strains were assayed on three batches of the 22°C-grown cultures, and the averages and standard deviations are shown. (F) 3′RACE assays the TRTs in 22°C-grown strains S2, ▽aCPSF1, Com(wt) and Com(mu). Blue and magenta arrows indicate the PCR products of normal terminations (TTSs) and TRTs, respectively. M, a DNA ladder indicates migrations of the PCR products.
Figure 5.
Figure 5.
Mmp-aCPSF1 associates with Mmp-aRNAP and the chromosomal DNA. (A) Co-occurrence of Mmp-aCFSF1 and Mmp-RpoD was assayed through size exclusion chromatography (upper) based cell extract fractionation and coupled with western blot (lower). +/–RNase, with or without RNase A treatment. (B, C) Association of Mmp-aCPSF1 with Mmp-aRNAP was determined through co-immunoprecipitation (anti-Flag CoIP), Ni column affinity chromatography (His-affinity), and tandem affinity purification (TAP) using strains Mmp-RpoL-HF and Mmp-aCPSF1-F that carry His6–3× Flag fused Mmp-RpoL and 3× Flag fused Mmp-aCPSF1, respectively. Strain S2 was included as a mock control. Western blot detected Mmp-aCPSF1 in captured products. -, RNase, DNase, and Benzonase indicate treatments without and with the corresponding nucleases of the Mmp-RpoL-HF cell extract before immunoprecipitation. (D) PCR products (arrows pointed) of the indicated genes were amplified from the ChIP DNAs of strains S2 (mock), Mmp-RpoL-HF (LF), and Mmp-aCPSF1-F (C1F), respectively. M, DNA marker. (E) qPCR assayed the enriched genes in ChIP products, and the enrichment fold of a given gene in the ChIP eluates of strains Mmp-RpoL-HF and Mmp-aCPSF1-F over that in S2 (mock control) was calculated as described in the Materials and Methods.
Figure 6.
Figure 6.
The ubiquitous distribution of the aCPSF1 orthologs among Archaea and the aCPSF1 dependent archaeal transcription termination reveals a similar 3′-end cleavage mode as the eukaryotic RNAP II termination. (A) The Maximum Likelihood phylogenetic trees based on aCPSF1 proteins (left) and concatenated RNA polymerase subunits A, B and E, and transcription elongation factor Spt5 (right). Protein sequences were retrieved from genomes or metagenome-assembled genomes of the representative archaeal lineages that have been described thus far, including Euryarchaeota (E), Crenarchaeota (C), Thaumarchaeota (T), Aigarchaeota (A), Korarchaeota (K), Nanoarchaeota (N), and Lokiarchaeota (Loki). The unrooted tree was constructed using Maximum-Likelihood methods in MEGA 7.0 software package. Bootstrap values are shown at each node. (B) Protein abundances of the aCPSF1 orthologs in complemented ▽aCPSF1 strains were examined by western blot using the Mmp-aCPSF1 polyclonal antiserum. The percentiles of protein content referenced to that in S2 are shown beneath the gel. (C) Ectopic expression of the aCPSF1 orthologs from Lokiarchaeum GC14_75 (com(Loki-C1)) and Cenarchaeum symbiosum (com(Csy-C1)) restored the 22°C-growth defect of ▽aCPSF1 similarly as the complementation of itself (com(Mmp-C1)) and wild-type S2 carrying an empty vector (S2-pMEV2). The averages of three replicates and standard deviations are shown. (D) 3′RACE assays the TRT transcripts of MMP0901 and MMP0155 in the strains numbered as in panel (B). (E) A proposed mechanism of aCPSF1 cleavage triggering the archaeal transcription termination exposes a homolog of the eukaryotic RNAP II termination mode (3–5). The bacterial intrinsic termination is included for comparison. LUCA means last universal common ancestor.

References

    1. Maier L.K., Marchfelder A.. It's all about the T: transcription termination in archaea. Biochem Soc. T. 2019; 47:461–468. - PubMed
    1. Ray-Soni A., Bellecourt M.J., Landick R.. Mechanisms of bacterial transcription termination: all good things must end. Annu. Rev. Biochem. 2016; 85:319–347. - PubMed
    1. Porrua O., Boudvillain M., Libri D.. Transcription termination: variations on common themes. Trends Genet. 2016; 32:508–522. - PubMed
    1. Porrua O., Libri D.. Transcription termination and the control of the transcriptome: why, where and how to stop. Nat. Rev. Mol. Cell Bio. 2015; 16:190–202. - PubMed
    1. Kuehner J.N., Pearson E.L., Moore C.. Unravelling the means to an end: RNA polymerase II transcription termination. Nat. Rev. Mol. Cell Bio. 2011; 12:283–294. - PMC - PubMed

Publication types