. 2020 Sep 15;53(3):548-563.e8.
doi: 10.1016/j.immuni.2020.08.001. Epub 2020 Aug 27.

Multifaceted Effects of Antigen Valency on B Cell Response Composition and Differentiation In Vivo

Affiliations

Multifaceted Effects of Antigen Valency on B Cell Response Composition and Differentiation In Vivo

Yu Kato et al. Immunity. .

Abstract

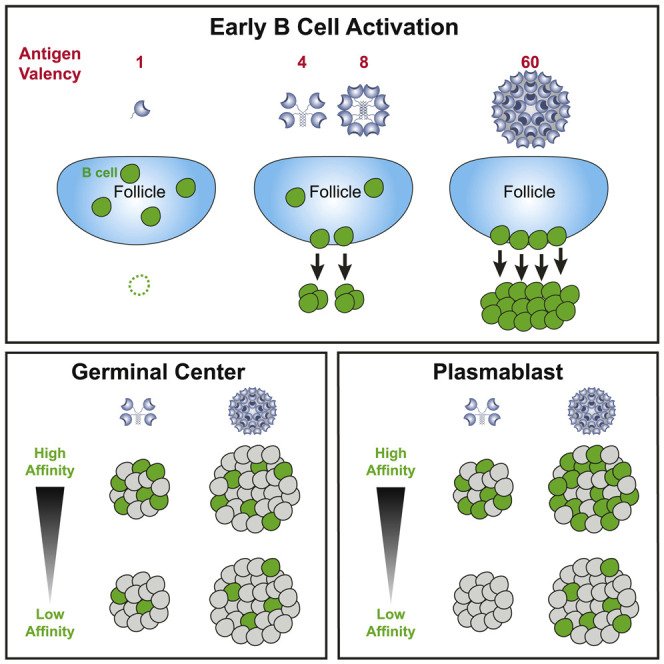
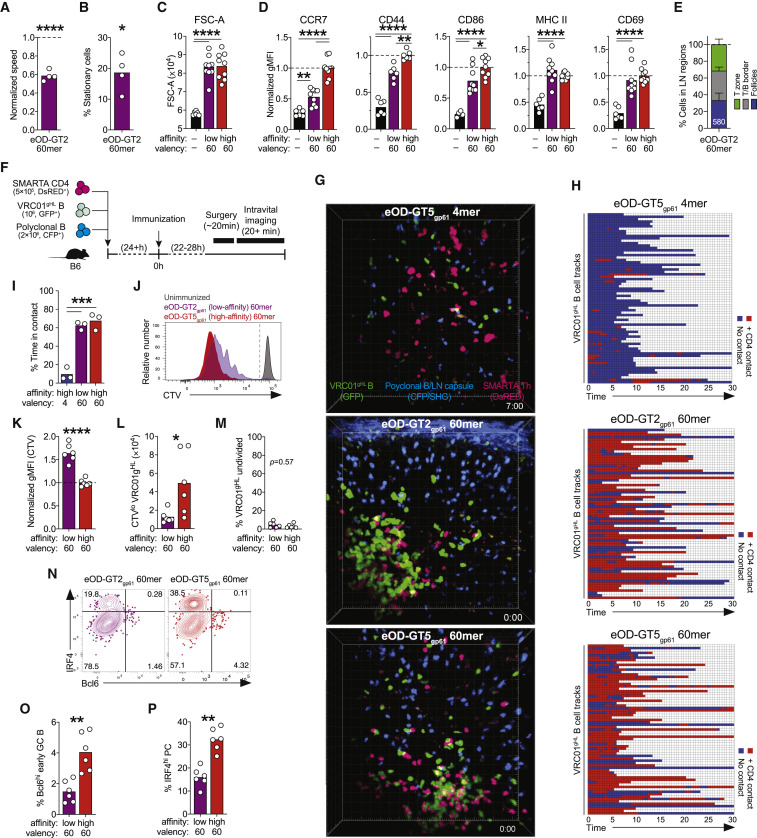
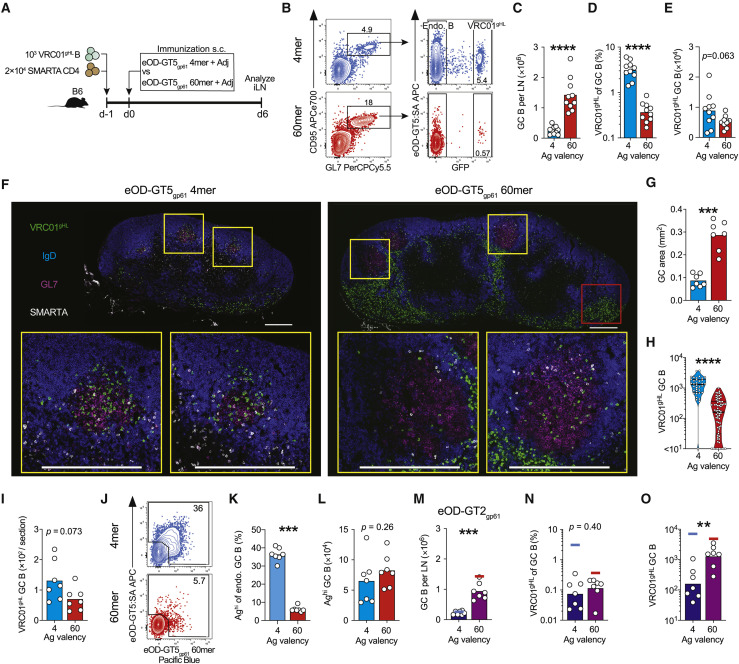
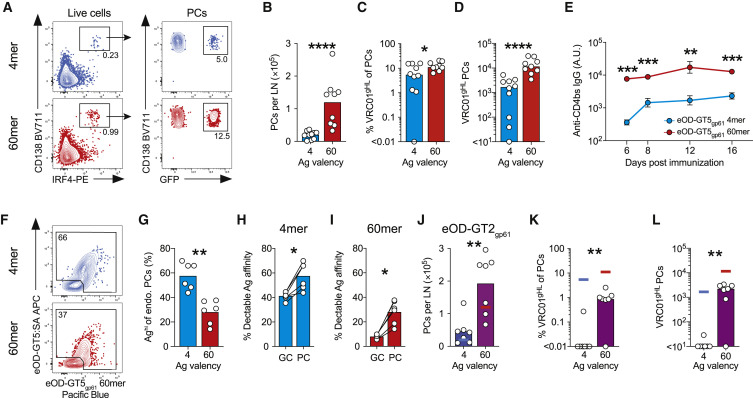
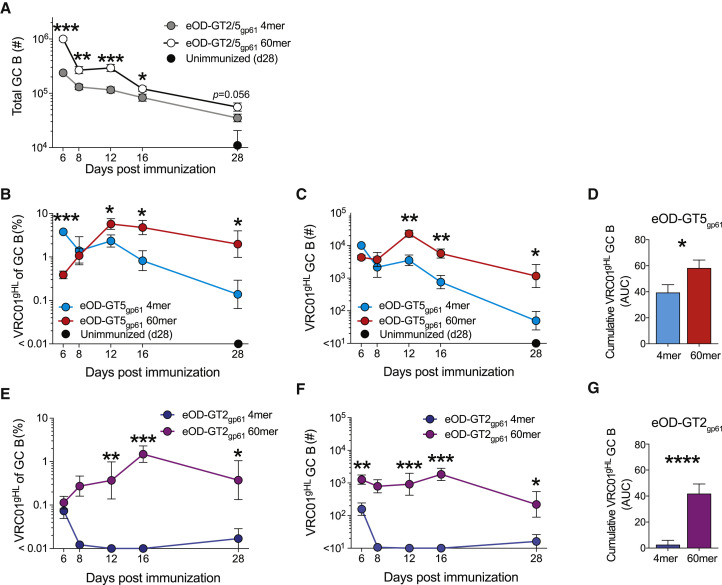
How antigen valency affects B cells in vivo during immune responses is not well understood. Here, using HIV immunogens with defined valencies ranging from 1 to 60, we investigated the role of antigen valency during different phases of B cell responses in vivo. Highly multimerized immunogens preferentially rapidly activated cognate B cells, with little affinity discrimination. This led to strong early induction of the transcription factors IRF4 (interferon regulatory factor 4) and Bcl6, driving both early extrafollicular plasma cell and germinal center responses, in a CD4+ T-cell-dependent manner, involving B cells with a broad range of affinities. Low-valency antigens induced smaller effector B cell responses, with preferential recruitment of high-affinity B cells. Thus, antigen valency has multifaceted effects on B cell responses and can dictate affinity thresholds and competitive landscapes for B cells in vivo, with implications for vaccine design.

Keywords: B cell; HIV; VRC01; affinity threshold; germinal center; germline targeting; nanoparticle; plasma cell; vaccine; valency.


Conflict of interest statement

Declaration of Interests S.M. and W.R.S. are inventors on patent applications filed by IAVI and Scripps on eOD-GT8 60-mer.

Figures

None
Graphical abstract
Figure 1
Figure 1
Antigen Valencies Influence Cognate B Cell Stimulation In Vivo within Hours (A) To-scale models of eOD-GT5 constructs: eOD (green), CD4bs (yellow), scaffold (cyan), and glycans (slate). (B–D) Intravital imaging of iLNs 2–3.5 h after immunization with eOD-GT5 antigens. (B) Schematic. (C) Speed of VRC01gHL B cells normalized to polyclonal B cells. (D) Stationary VRC01gHL B cells (speed <3 μm/min). Data in (A)–(D) are from three experiments with n = 2–5 mice/group. Bars represent the mean. (E–H) VRC01gHL B cell activation at 24 h. (E) Activation markers on VRC01gHL B cells. (F) Quantification of activation markers in (E), geometric mean fluorescence intensity (MFI). (G) VRC01gHL B cell size. (H) Quantification of VRC01gHL B cell size (mean FSC-A). Data in (E)–(H) are from two experiments, with n = 6 mice. Bars represent the mean. p < 0.05; ∗∗p < 0.01; ∗∗∗p < 0.001; ∗∗∗∗p < 0.0001. See also Figures S1 and S2, Video S1, and Table S1.
Figure 2
Figure 2
Differential Effects of Antigen Valencies on B Cell Division In Vivo (A–C) Proliferative responses of VRC01gHL B cells 3 days after immunizations. (A) Division profiles. The gates show CTVhi (undivided) and CTVlo (divided) cells. (B) Divided VRC01gHL B cell number. Bars represent the geometric mean. (C) Undivided VRC01gHL B cells as a frequency of total B cells, normalized to the unimmunized control. Bars represent the mean. Data in (A)–(C) are from two experiments with n = 6 mice. (D–F) VRC01gHL B cell activation and localization patterns 24 h after immunizations. (D) Large (FSC-Ahi) CCR7hi VRC01gHL B cells. (E) Representative iLNs showing VRC01gHL B cells (CTV, white), B cell zones (IgD, blue), and T cell zones (CD4, green). CTV signals were digitally dilated. Scale bar, 300 μm. (F) Distribution of VRC01gHL B cells. The total numbers of cells analyzed are indicated within bars. Data in (D)–(F) are from two experiments with n = 6 mice. p < 0.05; ∗∗p < 0.01; ∗∗∗p < 0.001; ∗∗∗∗p < 0.0001.
Figure 3
Figure 3
TD Induction of Early GC B Cells and PCs (A)–(F) Effects of CD4+ T cell depletion on VRC01gHL B cell responses to eOD-GT5 60-mer. (A) Division profiles. The gates show undivided and divided cells. (B) Divided VRC01gHL B cell number, normalized to the 60-mer control group. (C) Undivided VRC01gHL B cells as a frequency of total B cells, normalized to the unimmunized control. Data in (A)–(C) are from four experiments with n = 6–11 mice. Bars represent the mean. (D) Bcl6 and IRF4 expression by divided VRC01gHL (red) and endogenous (gray) B cells. Numbers in quadrants represent percentages. (E) Divided VRC01gHL B cells that are Bcl6hi IRF4lo GC B cells. (F) Divided VRC01gHL B cells that are IRF4hi Bcl6lo PCs. Data in (D)–(F) are from two experiments with n = 5–6 mice. Bars represent the mean. (G)–(L) VRC01gHL B cell proliferation and differentiation induced by eOD-GT5gp61 4-mer or 60-mer at day 4. (G) Division profiles. The gates show undivided and divided cells. (H) Divided VRC01gHL B cell number. Bars represent the geometric mean. (I) Undivided VRC01gHL B cells as a frequency of total B cells, normalized to the unimmunized control. Bars represent the mean. (J) Bcl6 and IRF4 expression in divided VRC01gHL B cells after immunizations (blue or red) and undivided VRC01gHL B cells from naive mice (gray). Percentages are indicated in quadrants. (K) Divided VRC01gHL B cells that are Bcl6hi IRF4lo GC B cells. (L) Divided VRC01gHL B cells that are IRF4hi Bcl6lo PCs. Data in (G)–(L) are from two experiments with n = 3–5 mice. (M) Divided VRC01gHL B cells that are Bcl6hi early GC B cells (purple), IRF4hi PCs (green), Bc6hi IRF4hi cells (black), or double negative (white). “d0” represents undivided VRC01gHL B cells from naive mice. Data are from two to four experiments with n = 2–8 mice. ∗∗p < 0.01; ∗∗∗∗p < 0.0001. See also Figure S3.
Figure 4
Figure 4
Highly Multimerized Low-Affinity Antigen Effectively Induces Early B Cell Responses (A and B) Intravital imaging of iLNs 2–3.5 h after immunization with eOD-GT2 60-mer. (A) Normalized speed of VRC01gHL B cells (∗∗∗∗p < 0.0001 versus unimmunized). (B) Frequency of stationery VRC01gHL B cells (speed <3 μm/min; p < 0.05 versus unimmunized). Data in (A) and (B) are from three experiments with n = 4 mice. Bars represent the mean. See also Figures 1C and 1D. (C and D) VRC01gHL B cell activation at 24 h. (C) VRC01gHL B cell size (mean FSC-A). (D) Activation markers on VRC01gHL B cells (normalized geometric MFI). Data in (C) and (D) are from three experiments with n = 6–9 mice. Bars represent the mean. (E) Distribution of VRC01gHL B cells at 24 h. Data are from two experiments with n = 6 mice and 580 cells. (F)–(H) Intravital imaging showing T and B cell interactions at 24 h. (F) Schematic. (G) Representative movie frames. (H) VRC01gHL B cells (rows) were classified as “in contact” (red) or “not in contact” (blue) with SMARTA CD4+ T cells. Randomly selected 71 VRC01gHL B cells are shown. (I) Percentage of time VRC01gHL B cells were in contact. Data in (G)–(I) are from two experiments with n = 3 mice. (J–P) Proliferation and differentiation of VRC01gHL B cell 3 days after immunization. (J) Division profiles. The gate identifies undivided and divided cells. (K) CTV (geometric MFI) on divided VRC01gHL B cells, normalized to eOD-GT5gp61 60-mer. (L) Divided VRC01gHL B cell number. (M) Undivided VRC01gHL B cells as a frequency of total B cells, normalized to unimmunized. (N) Bcl6 and IRF4 expression in divided VRC01gHL B cells. Percentages are indicated in quadrants. (O) Divided VRC01gHL B cells that are Bcl6hi IRF4lo GC B cells. (P) Divided VRC01gHL B cells that are IRF4hi Bcl6lo PCs. Data in (J)–(P) are from two experiments with n = 6 mice. Bars represent the mean. p < 0.05; ∗∗p < 0.01; ∗∗∗p < 0.001; ∗∗∗∗p < 0.0001. See also Videos S2 and S3 and Figure S4.
Figure 5
Figure 5
Antigen Valency Influences the Magnitude and the Compositions of GC B Cell Responses (A–L) VRC01gHL and endogenous GC B cell responses 6 days after immunizations. (A) Schematic. (B) Total GC B cell responses (left) and VRC01gHL GC B cell responses (right). Percentages are indicated. (C) Total GC B cell number. Bars indicate the mean. (D) VRC01gHL GC B cells as a percentage of total GC B cells. Bars indicate the geometric mean. (E) VRC01gHL GC B cell number. Bars indicate the mean. Data in (A)–(E) are from three experiments with n = 9–10 mice/group. (F) Representative iLNs: VRC01gHL B cells (GFP, green), IgD (blue), GL7 (red), and SMARTA CD4+ T cells (CD45.1, white). GCs are the GL7+ IgD area. Yellow squares show example GCs. Red square shows extrafollicular VRC01gHL B cells. Scale bars, 300 μm. (G) GC area per section. Bars indicate the mean. (H) VRC01gHL B cell density in GCs (count per mm2). Lines at the first quartile, median, and third quartile; n = 36 GCs (4-mer) and 70 GCs (60-mer). (I) VRC01gHL GC B cell number per section. Bars indicate the mean. Data in (F)–(I) are from two experiments with n = 6 mice. (J) Endogenous GC B cells. The gate identifies “high-affinity” cells with detectable affinities for antigen probes. Percentages are indicated. (K) Frequency of high-affinity endogenous GC B cells. (L) Number of high-affinity endogenous GC B cells. Data in (J)–(L) are from two experiments with n = 7 mice. Bars indicate the mean. (M–O) VRC01gHL GC B cell responses 6 days after immunization with eOD-GT2gp61 4-mer or 60-mer. (M) Total GC B cell number. Lines indicate the data for eOD-GT5gp61 4-mer (blue) and 60-mer (red). See also Figure 5C. (N) VRC01gHL B cells as a percentage of total GC B cells. Lines indicate the data for eOD-GT5gp61 4-mer (blue) and 60-mer (red). See also Figure 5D. (O) VRC01gHL GC B cell number. Lines indicate the data for eOD-GT5gp61 4-mer (blue) and 60-mer (red). See also Figure 5E. Data in (M)–(O) are from two experiments with n = 7 mice. Bars indicate the mean (M) or geometric mean (N and O). p < 0.05; ∗∗p < 0.01; ∗∗∗p < 0.001; ∗∗∗∗p < 0.0001. See also Figure S5.
Figure 6
Figure 6
Antigen Valency Influences the Magnitude and the Compositions of Extrafollicular PC Responses (A–I) VRC01gHL and endogenous PC responses 6 days after immunization with eOD-GT5gp61 4-mer or 60-mer. (A) Total PC responses (left) and VRC01gHL PC responses (right). (B) Total PC number. Bars indicate the mean. (C) VRC01gHL cells as a percentage of total PCs. Bars indicate the median. (D) VRC01gHL PC number. Bars indicate the median. Data in (A)–(D) are from three experiments with n = 9–10 mice. (E) CD4bs-specific IgG responses (geometric mean ± geometric standard error). 2 experiments, n = 7. (F) Endogenous PCs (IgD CD138+). The gate identifies “high-affinity” cells with detectable affinities for antigen probes. (G) High-affinity endogenous PCs. (H and I) High-affinity endogenous GC B cells and PCs after immunization with (H) eOD-GT5gp61 4-mer, or (I) 60-mer. See Figure 5K. (J–L) VRC01gHL PC responses 6 days after immunization with eOD-GT2gp61 4-mer or 60-mer. (J) Total PC number. Bars indicate the mean. Lines indicate the data for eOD-GT5gp61 4-mer (blue) and 60-mer (red). (K) VRC01gHL cells as a percentage of total PCs. Bars indicate the median. Lines indicate the data for eOD-GT5gp61 4-mer (blue) and 60-mer (red). (L) VRC01gHL PC number. Bars indicate the median. Lines indicate the data for eOD-GT5gp61 4-mer (blue) or 60-mer (red). Data in (F)–(L) are from two experiments (n = 6). p < 0.05; ∗∗p < 0.01; ∗∗∗p < 0.0001; ∗∗∗∗p < 0.0001. See also Figure S5.
Figure 7
Figure 7
Persistence of VRC01-Class B Cells in GCs (A–F) Kinetics of VRC01gHL GC B cell responses after immunization with eOD-GT5gp61 antigens (A–D) or eOD-GT2gp61 antigens (A and E–G). (A) Total GC B cell number. Combined data of eOD-GT2gp61 and eOD-GT5gp61 antigens. (B and E) VRC01gHL cells as a percentage of total GC B cells (geometric mean ± geometric standard error). (C and F) VRC01gHL GC B cell number (geometric mean ± geometric standard error). (D and G) Cumulative VRC01gHL GC B cell response. (D) Area under the curve (AUC) of log-transformed data in (C). (G) AUC of log-transformed data in (F). Mean + standard deviation. Data in (A)–(G) are from two experiments, n = 7. p < 0.05; ∗∗p < 0.01; ∗∗∗p < 0.001, ∗∗∗∗p < 0.0001. See also Figure S6.

Comment in

References

    1. Abbott R.K., Lee J.H., Menis S., Skog P., Rossi M., Ota T., Kulp D.W., Bhullar D., Kalyuzhniy O., Havenar-Daughton C. Precursor frequency and affinity determine B cell competitive fitness in germinal centers, tested with germline-targeting HIV vaccine immunogens. Immunity. 2018;48:133–146.e6. - PMC - PubMed
    1. Allen C.D.C., Okada T., Cyster J.G. Germinal-center organization and cellular dynamics. Immunity. 2007;27:190–202. - PMC - PubMed
    1. Bachmann M.F., Rohrer U.H., Kündig T.M., Bürki K., Hengartner H., Zinkernagel R.M. The influence of antigen organization on B cell responsiveness. Science. 1993;262:1448–1451. - PubMed
    1. Bachmann M.F., Zinkernagel R.M. The influence of virus structure on antibody responses and virus serotype formation. Immunol. Today. 1996;17:553–558. - PubMed
    1. Batista F.D., Iber D., Neuberger M.S. B cells acquire antigen from target cells after synapse formation. Nature. 2001;411:489–494. - PubMed

Publication types

MeSH terms