. 2020 Sep 17;79(6):978-990.e5.
doi: 10.1016/j.molcel.2020.08.004. Epub 2020 Aug 27.

Multivalent Proteins Rapidly and Reversibly Phase-Separate upon Osmotic Cell Volume Change

Affiliations

Multivalent Proteins Rapidly and Reversibly Phase-Separate upon Osmotic Cell Volume Change

Ameya P Jalihal et al. Mol Cell. .

Abstract

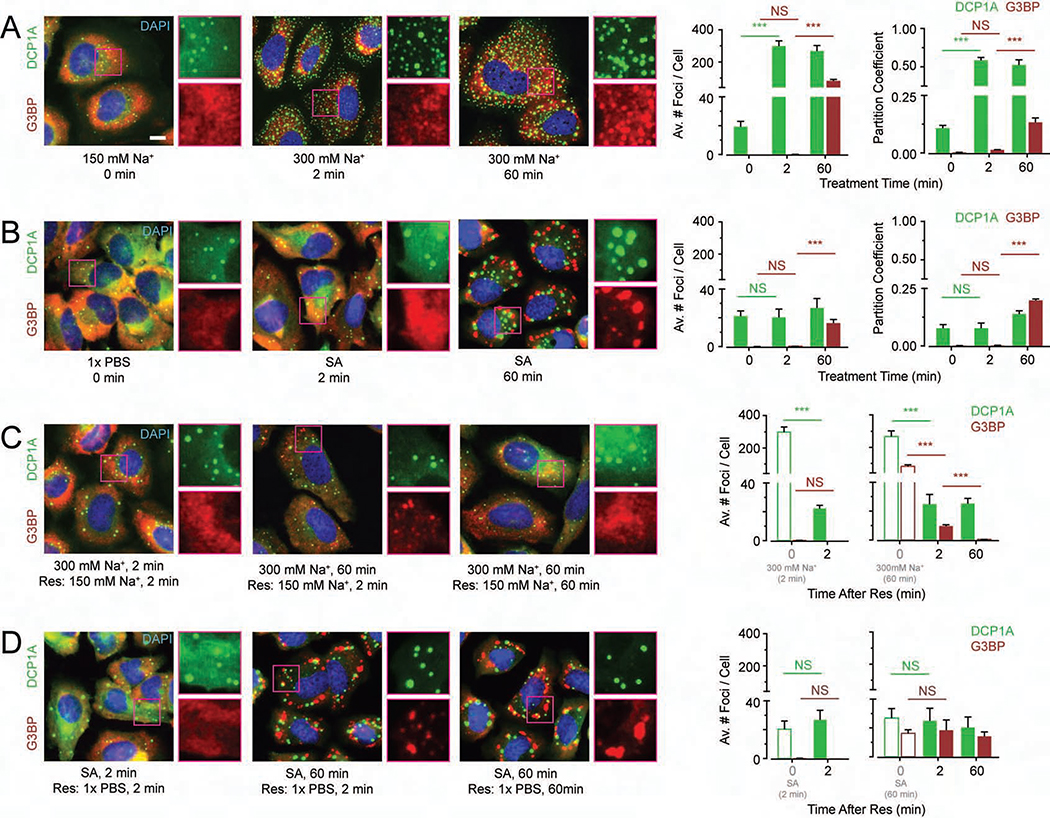
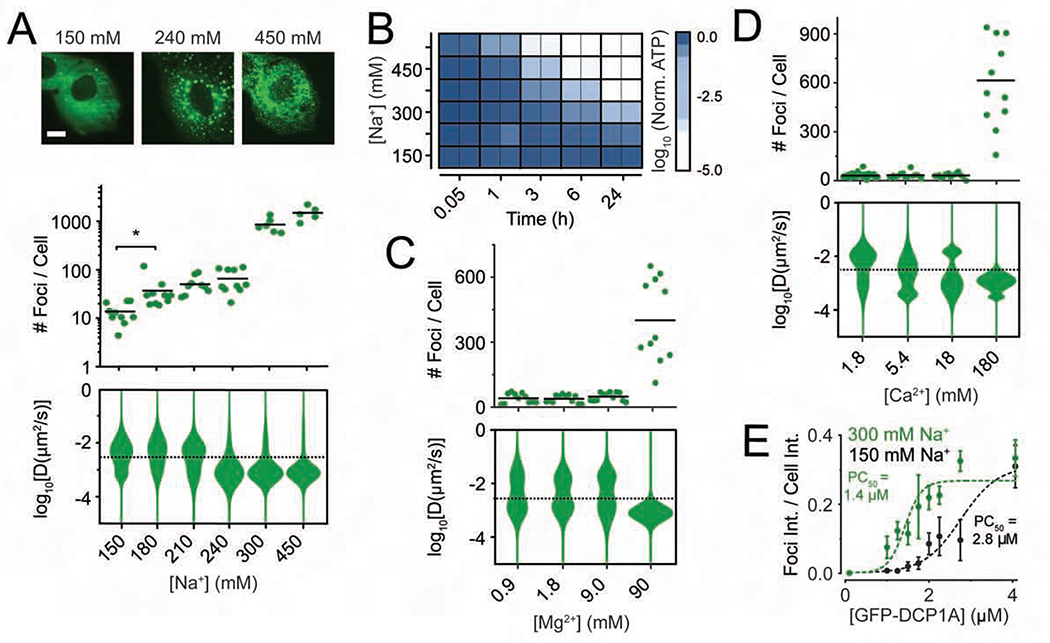
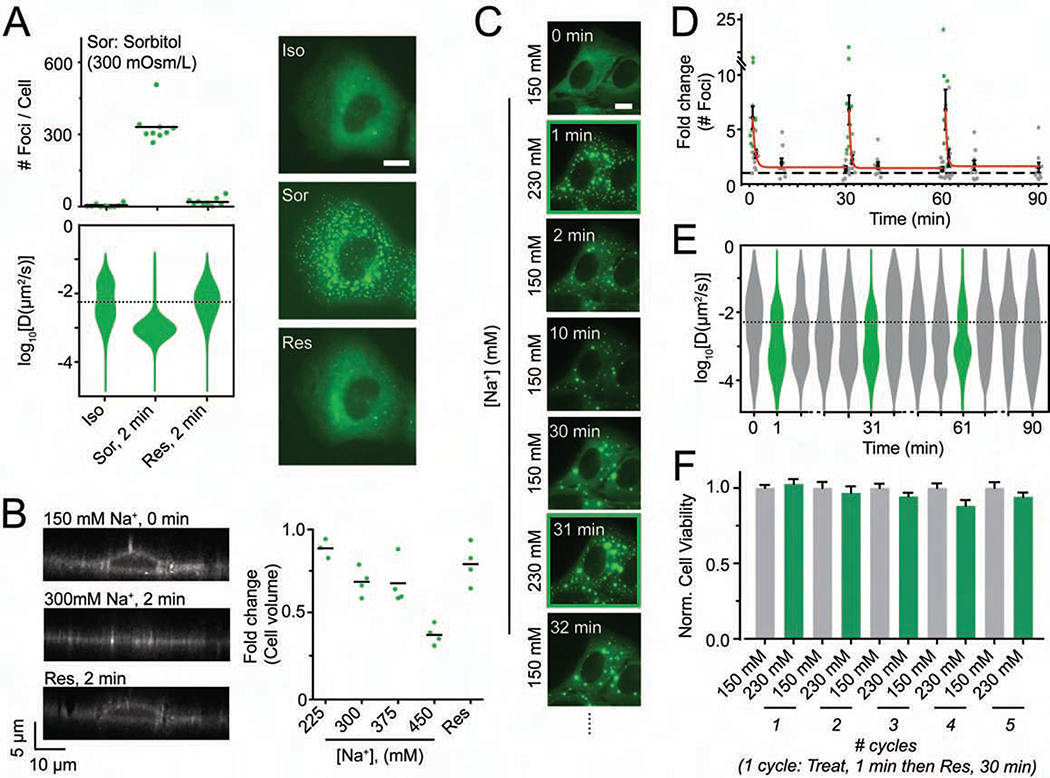
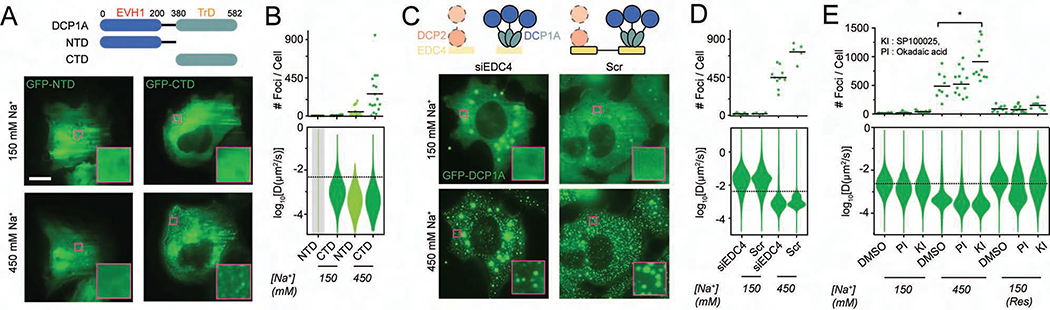
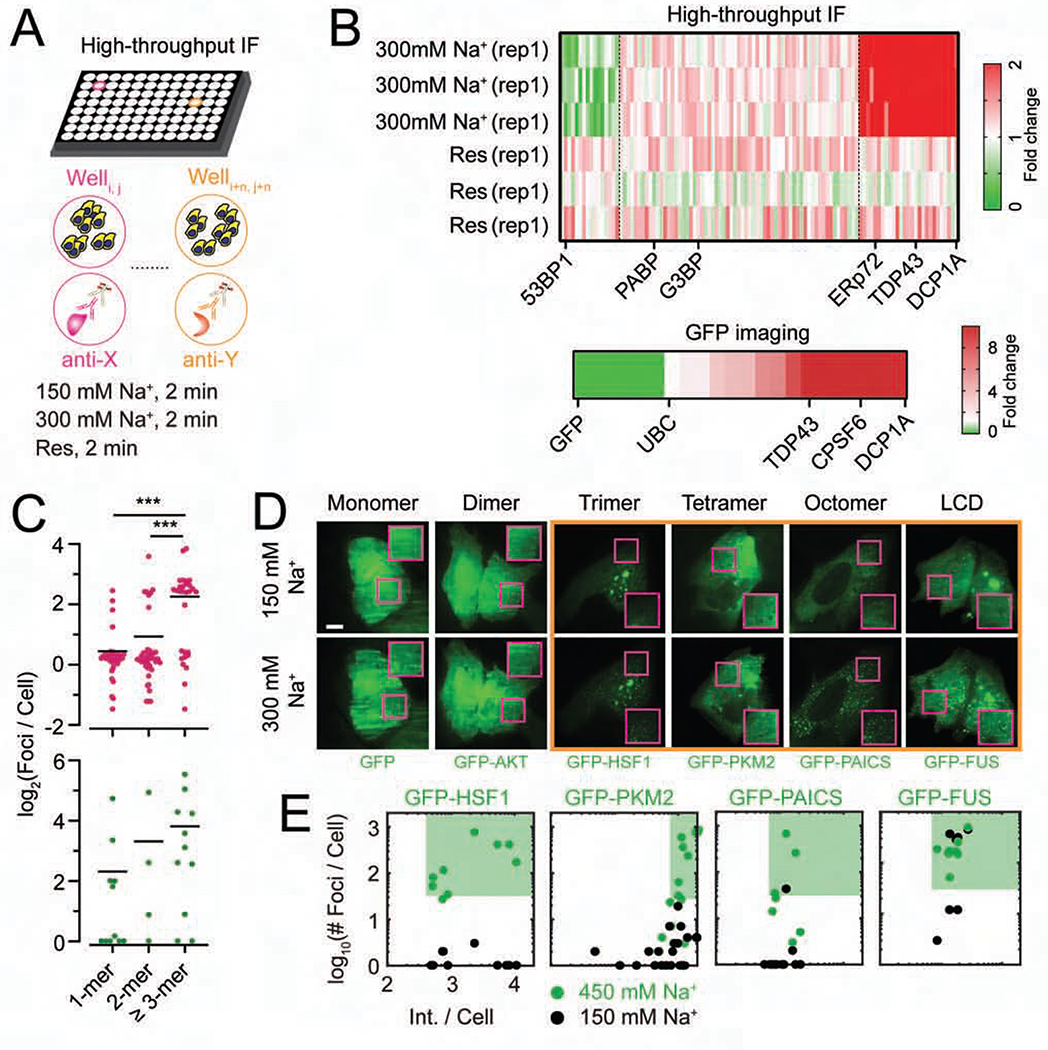
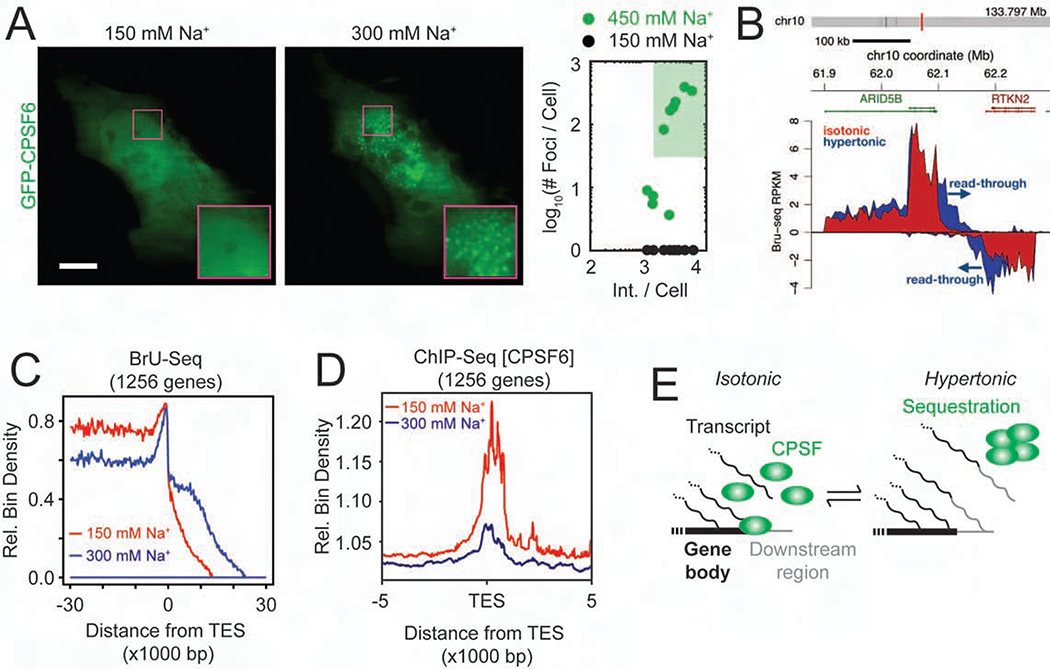
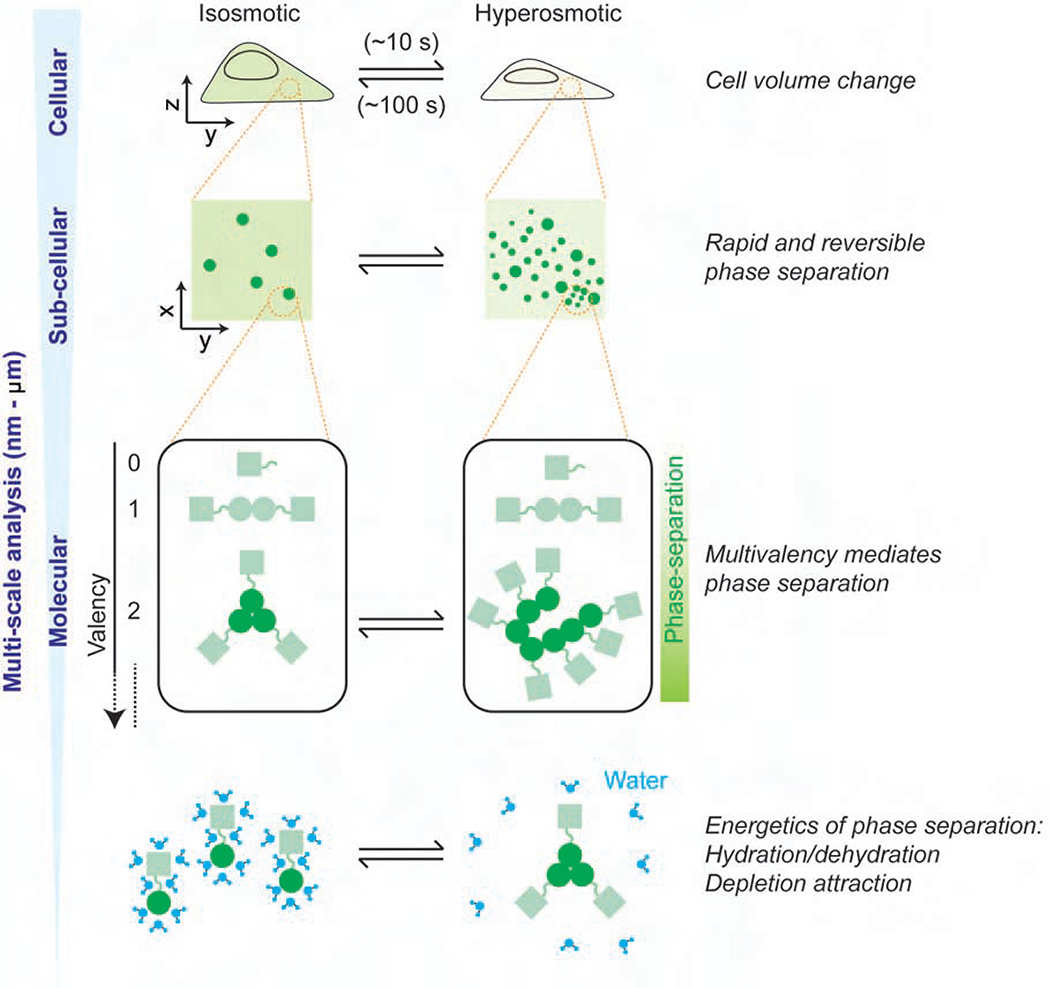
Processing bodies (PBs) and stress granules (SGs) are prominent examples of subcellular, membraneless compartments that are observed under physiological and stress conditions, respectively. We observe that the trimeric PB protein DCP1A rapidly (within ∼10 s) phase-separates in mammalian cells during hyperosmotic stress and dissolves upon isosmotic rescue (over ∼100 s) with minimal effect on cell viability even after multiple cycles of osmotic perturbation. Strikingly, this rapid intracellular hyperosmotic phase separation (HOPS) correlates with the degree of cell volume compression, distinct from SG assembly, and is exhibited broadly by homo-multimeric (valency ≥ 2) proteins across several cell types. Notably, HOPS sequesters pre-mRNA cleavage factor components from actively transcribing genomic loci, providing a mechanism for hyperosmolarity-induced global impairment of transcription termination. Our data suggest that the multimeric proteome rapidly responds to changes in hydration and molecular crowding, revealing an unexpected mode of globally programmed phase separation and sequestration.

Keywords: cell volume; hydration; hyperosmotic stress; molecular crowding; phase separation; processing bodies; protein multivalency; self-interaction; stress granules; stress response.


Conflict of interest statement

Declaration of Interests The authors declare no competing interests.

Figures

Figure 1.
Figure 1.. Extent and kinetics of DCP1A phase separation during hypertonic stress are distinct from those of SG markers G3BP.
(A-D) Representative pseudocolored immunofluorescence (IF) images of U2OS cells stained for DAPI (blue), DCP1A (green) or G3BP (red) and the corresponding quantification of average number of spots per cell. Scale bar, 10 μm. (A) Cells were treated with isotonic (150 mM Na+) medium or hypertonic (300 mM Na+) medium for the appropriate time points. Quantified partition coefficients of DCP1A and G3BP are represented in the far right panel. (B) Cells were mock treated with 1x PBS or treated with 0.5 mM SA for the appropriate time points. Quantified partition coefficients of DCP1A and G3BP are represented in the far right panel. (C) Cells were first treated with hypertonic medium (300 mM Na+) for the appropriate time points and then rescued with isotonic (150 mM Na+) medium for various durations. Bars with green and red outline depict data points from panel A. (D) Cells were first treated with 0.5 mM SA for the appropriate time points and then rescued with medium containing 1x PBS for various durations. Bars with green and red outline depict data points from panel B. n = 3, > 60 cells, ***p ≤ 0.0001, N.S. denotes non-significance by two-tailed, unpaired Student’s t-test. See also Figure S1.
Figure 2.
Figure 2.. Physicochemical and phenotypic characterization of DCP1A phase separation during hypertonic stress.
(A) Representative pseudocolored images of UGD cells (GFP, green) treated with growth medium containing various concentrations of Na+ (top), scatter plot of the number of foci per cell (middle), violin plots of diffusion constants associated with DCP1A foci (bottom). n = 2, > 5 cells per sample, *p ≤ 0.01 by two-tailed, unpaired Student’s t-test. (B) Representative image of a 96-well plate probed for cell viability by cell-titer glo assay across various Na+ concentrations and multiple time points. n = 3, with technical replicates for each n. (C and D) Scatter plot of the number of foci per cell (top) and violin plots of diffusion constants associated with DCP1A foci (bottom) within UGD cells treated with growth medium containing various levels if Mg2+ (C) or Ca2+ (D). n = 3, > 5 cells per sample. The dotted line in the diffusion plots empirically demarcates high- and low-mobility fractions. (E) Plot of partition coefficient against cellular concentration of DCP1A in samples treated with 150 mM Na+ (light green) or 300 mM Na+ (dark green). Data points were fitted with a dose response curve. PC50 = half maximal partition coefficient. See also Figure S2.
Figure 3.
Figure 3.. Hyperosmotic compression mediates DCP1A phase separation.
(A) Scatter plot of the number of foci per cell (top), violin plots of diffusion constants associated with DCP1A foci (bottom) and representative pseudocolored images of UGD cells (GFP, green) treated with isosmotic (Iso) growth medium, hyperosmotic growth medium containing the non-ionic osmolyte Sorbitol (Sor), or rescued (Res) with isosmotic medium after Sorbitol treatment. n = 2, > 5 cells per sample. Scale bar, 10 μm. (B) Representative y-z projection of UGD cells (gray-scale) from 3-D imaging assay wherein the cell were treated with isotonic (150 mM Na+) medium, hypertonic (300 mM Na+) medium or rescued with isotonic medium after hypertonic treatment. n = 1, 4 cells per sample. Scale bar, 10 μm. Scatter plot of the fold change in cell volume, as normalized to the cell volume in isotonic conditions, is shown. (C) Representative pseudocolored images of a UGD cell (GFP, green) that was cyclically treated with isotonic (150 mM Na+) or hypertonic (300 mM Na+) medium. Scale bar, 10 μm. (D) Scatter plot of the fold change in foci number, as normalized to foci number in isotonic samples, associated with assay represented in C. Red line depicts exponential fit. n = 2, > 5 cells per sample. (E) Violin plots of diffusion constants associated with DCP1A foci, associated with assay represented in C. n = 2, > 5 cells per sample. The dotted line in the diffusion plots empirically demarcates high- and low-mobility fractions. (F) Bar plots of cell viability, normalized to isotonic samples, associated with assay represented in C. n = 3, with 3 technical replicates for each n. See also Figure S3.
Figure 4.
Figure 4.. HOPS of DCP1A is dependent on its trimerization domain and modulated by PTMs, but not its interaction with EDC4.
(A) Schematic of full length DCP1A, NTD, or CTD constructs (top, not to scale). EVH1 domain, trimerization domain, and the amino acid numbers are marked. Representative pseudocolored images of U2OS cells (GFP, green) transfected with GFP-NTD or GFP-CTD that were treated with isotonic (150 mM Na+) or hypertonic (300 mM Na+) medium (bottom). Scale bar, 10 μm. (B) Scatter plot of the number of foci per cell (top) and violin plots of diffusion constants associated with DCP1A foci (bottom) imaged in panel A. n = 3, > 5 cells per sample. (C) Schematic of DCP1A, DCP2 and EDC4 in the decapping complex (top, not to scale) in siEDC4 or Scr treatment conditions. Representative pseudocolored images of siEDC4 or Scr siRNA treated UGD cells (GFP, green) treated with isotonic (150 mM Na+) or hypertonic (300 mM Na+) medium (bottom). Scaled as in panel A. (D) Scatter plot of the number of foci per cell (top) and violin plots of DCP1A diffusion constants (bottom), associated with assay represented in C. n = 3, > 5 cells per sample. (E) Scatter plot of the number of foci per cell (top) and violin plots of DCP1A diffusion constants (bottom) within UGD cells that were pre-treated treated with DMSO, KI, or PI, and imaged in isotonic (150 mM Na+) medium, hypertonic (300 mM Na+) medium, or rescued (Res) with isotonic medium after hypertonic treatment. n = 3, > 5 cells per sample. The dotted line in the diffusion plots empirically demarcates high- and low-mobility fractions. See also Figure S4.
Figure 5.
Figure 5.. High-throughput IF and GFP imaging show that several multimeric proteins of valency ≥2 generally exhibit HOPS.
(A) Schematic of high throughput IF assay. (B) Heatmap representing the fold change in spot number of the 108 targets tested by high throughput IF, as normalized to isotonic conditions. “rep” denotes replicates. Heatmap representing the fold change in spot number of 22 protein targets tested by GFP imaging, normalized to isotonic conditions are shown below. (C) Scatter plot of the average number of foci per cell as a function of known protein multimerization ability. Each dot represents an individual target in the high-throughput IF of GFP imaging assay. n = 3, ***p ≤ 0.0001 by two-tailed, unpaired Student’s t-test. (D) Representative pseudocolored images of U2OS cells (GFP, green) transfected with the appropriate GFP-tagged construct and treated with isotonic (150 mM Na+) medium or hypertonic (300 mM Na+) medium. Scale bar, 10 μm. Inset depicts a zoomed-in area corresponding to a 15 × 15 μm2 magenta box. The orange box encloses proteins that exhibit HOPS. (E) Scatter plot of the number of foci per cell against the area-normalized cell intensity for each protein is shown. n = 2, > 5 cells per sample. The green contour depicts the HOPS regime. See also Figure S5.
Figure 6.
Figure 6.. HOPS of CPSF6 is correlated with impaired transcription termination.
(A) Representative pseudocolored images of a U2OS cell transfected with GFP-CPSF6 (green) incubated with isotonic (150 mM Na+, red) medium and then treated with hypertonic (300 mM Na+, blue) medium for 1 min. Scale bar, 10 μm. (B) Bru-seq tracks across the ARID5B and RTKN2 genes showing transcriptional read-through of the TES. (C) Aggregate nascent RNA Bru-Seq enrichment profile across TESs. Relative bin density of ~1256 genes expressed >0.5 RPKM and >30 kb long showing an ~10 kb average extension of reads past the TES following exposure to hypertonic conditions for 30 min. Samples were prepared from cells treated with isotonic (150 mM Na+, red) or hypertonic (300 mM Na+, blue) medium for 30 min. (D) Aggregated ChIP-seq peaks of CPSF6 around the TES under hypertonic (300 mM Na+, blue) and isotonic conditions (300 mM Na+, red). (E) Schematic model of transcription termination defect induced by HOPS of CPSFs. See also Figure S6.
Figure 7.
Figure 7.. Model of the multiscale features of HOPS.
Our multi-scale analysis has shown that HOPS of multimeric proteins is mediated by the concerted changes in cell volume, macromolecular crowding, and hydration.

Comment in

References

    1. Aizer A, Brody Y, Ler LW, Sonenberg N, Singer RH, and Shav-Tal Y (2008). The dynamics of mammalian P body transport, assembly, and disassembly in vivo. Mol Biol Cell 19, 4154–4166. - PMC - PubMed
    1. Aizer A, Kafri P, Kalo A, and Shav-Tal Y (2013). The P body protein Dcp1a is hyper-phosphorylated during mitosis. PloS one 8, e49783. - PMC - PubMed
    1. Alberti S (2017). Phase separation in biology. Curr Biol 27, R1097–R1102. - PubMed
    1. Alberti S, Gladfelter A, and Mittag T (2019). Considerations and Challenges in Studying Liquid-Liquid Phase Separation and Biomolecular Condensates. Cell 176, 419–434. - PMC - PubMed
    1. Alexandrov AI, Grosfeld EV, Dergalev AA, Kushnirov VV, Chuprov-Netochin RN, Tyurin-Kuzmin PA, Kireev II, Ter-Avanesyan MD, Leonov SV, and Agaphonov MO (2019). Analysis of novel hyperosmotic shock response suggests ‘beads in liquid’ cytosol structure. Biology open 8, bio044529. - PMC - PubMed

Publication types