. 2020 Oct 19;30(20):4103-4111.e6.
doi: 10.1016/j.cub.2020.07.095. Epub 2020 Aug 27.

Uclacyanin Proteins Are Required for Lignified Nanodomain Formation within Casparian Strips

Affiliations

Uclacyanin Proteins Are Required for Lignified Nanodomain Formation within Casparian Strips

Guilhem Reyt et al. Curr Biol. .

Abstract

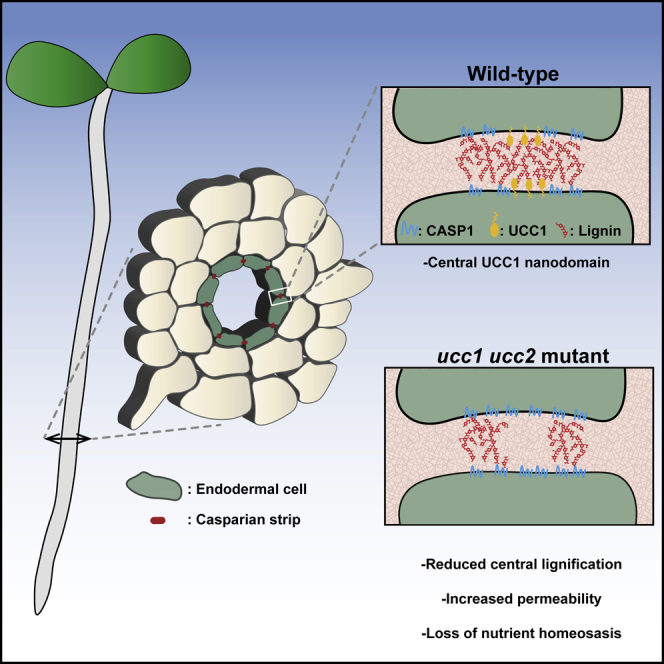
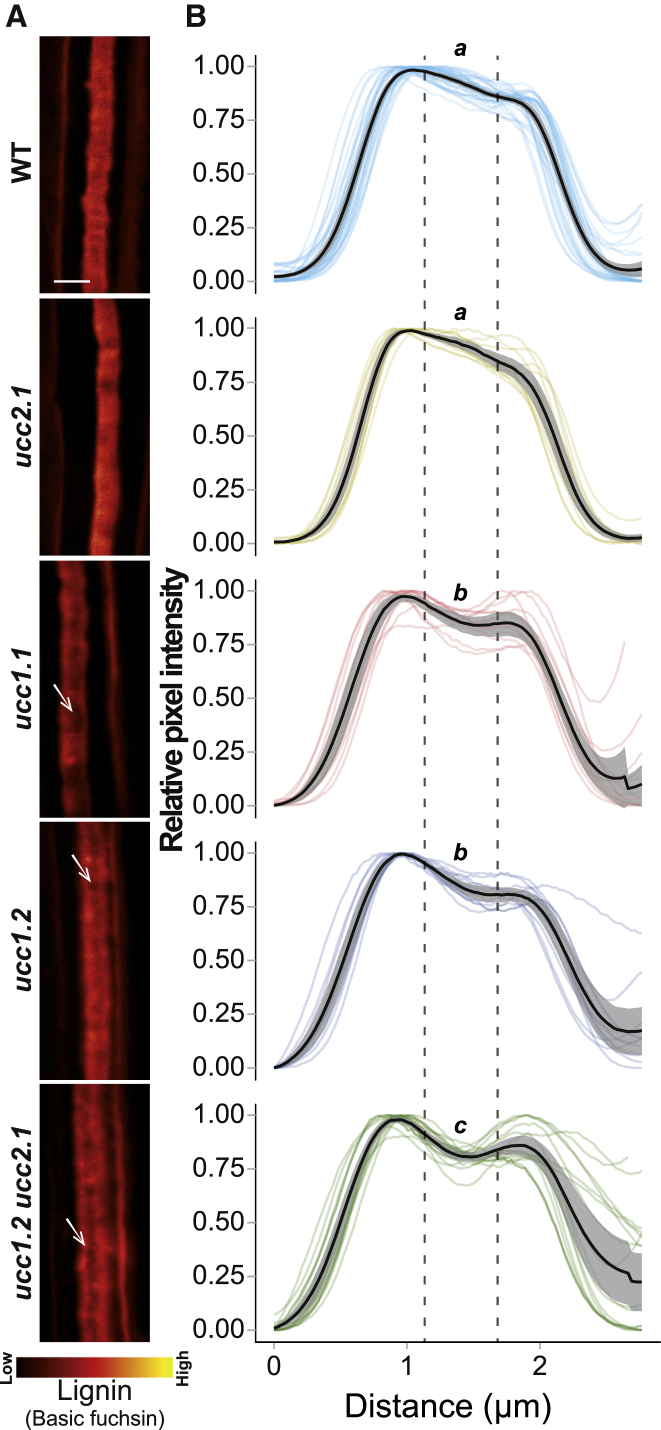
Casparian strips (CSs) are cell wall modifications of vascular plants restricting extracellular free diffusion into and out of the vascular system [1]. This barrier plays a critical role in controlling the acquisition of nutrients and water necessary for normal plant development [2-5]. CSs are formed by the precise deposition of a band of lignin approximately 2 μm wide and 150 nm thick spanning the apoplastic space between adjacent endodermal cells [6, 7]. Here, we identified a copper-containing protein, Uclacyanin1 (UCC1), that is sub-compartmentalized within the CS. UCC1 forms a central CS nanodomain in comparison with other CS-located proteins that are found to be mainly accumulated at the periphery of the CS. We found that loss-of-function of two uclacyanins (UCC1 and UCC2) reduces lignification specifically in this central CS nanodomain, revealing a nano-compartmentalized machinery for lignin polymerization. This loss of lignification leads to increased endodermal permeability and, consequently, to a loss of mineral nutrient homeostasis.

Keywords: Casparian strips; Uclacyanin; endodermis; extracellular diffusion barriers; lignin; nanodomain; phytocyanin; plant cell wall.


Conflict of interest statement

Declaration of interests The authors declare no competing interests.

Figures

None
Graphical abstract
Figure 1
Figure 1
Uclacyanins UCC1 and UCC2 Are Required for a Functional Casparian Strip (A) Left: figure shows a phylogenetic analysis of phytocyanins protein family in A. thaliana. The tree was built using the full-length amino acid sequences for all proteins. Different colors represent the three phytocyanins subfamilies: uclacyanins, stellacyanins, and plantacyanins (39). In the tree, branch lengths are proportional to the number of substitutions per site. AT3G17675 has been previously annotated as a stellacyanin (STC4), however, the signal peptide for the secretion pathway and the hydrophobic extension for Glycosylphosphatidylinositol (GPI) anchoring are missing. Right: heatmap showing the endodermal expression of the phytocyanins family in A. thaliana across the different root zones (Meristematic, Elongation, Maturation). For the analysis, expression data were collected from the Bio-Analytic Resource database, AtGenExpress Consortium. The expression of two endodermal localized proteins, CASP1 and ESB1, were added to the analysis as a reference. Asterisks indicate a significant downregulation in a myb36 mutant according to [18]. (B) Schematic representation of the UCC1 and UCC2 proteins showing the different protein domains and the types of mutations. Domains were defined according to [19] (see also Figure S1A). (C) Boxplot analysis showing the number of the cells from the onset of elongation permeable to propidium iodide in wild-type (WT) plants, ucc1 mutants (ucc1.1 and ucc1.2), ucc2 mutant (ucc2.1 and ucc2.2), and the double ucc1 ucc2 mutants (ucc1.2 ucc2.1 and ucc1.2ucc2.2). Data were collected from two independent experiments (n ≥ 29). Different letters represent significant statistical differences between genotypes using one-way ANOVA and Tukey’s test (p < 0.01) (see also Figure S1B). (D) Diagram shows the quantification analysis of the endodermal suberization in roots of WT plants, ucc1.1, ucc1.2, ucc2.1, ucc2.2 and ucc1.2 ucc2.1. Each color in the graph represents the percentage of the root length (percentage of root length [%]) that is unsuberized (white), discontinuously suberized (yellow), continuously suberized (orange). Suberin was staining with Fluorol yellow 088. (n ≥ 18). Error bars in the figure are the standard deviation (SD). Different letters represent significant differences between genotypes using a Mann-Whitney test (p < 0.01) (See also Figure S1C). (E) Heatmap representing the ionomic profiles (Z-scores) of WT plants, and a collection of mutants with a defective Casparian strip: ucc2.1, ucc1.1, ucc1.2, ucc1.2 ucc2.1, esb1, ucc1.1 esb1, ucc1.2 esb1, sgn3, ucc1.1 sgn3, and ucc1.2 sgn3 grown in full nutrient conditions on agar plate for 2 weeks (n = 10). Elements concentration were determined by ICP-MS and the raw data are available in the Table S1. Significant differences were determined in comparison with WT using a t test (p < 0.01). Genotypes were subjected to hierarchical clustering analysis.
Figure 2
Figure 2
UCC1 Defines a New Central Sub-domain in the Casparian Strip (A) Diagram representing the construct pUCC1::mCherry-UCC1 (UTR, untranslated region; SP, signal peptide; H Cter, hydrophobic C terminus for GPI anchoring). (B) Maximum intensity projection, orthogonal, median, and surface views of confocal sections of plants expressing pUCC1::mCherry-UCC1 (red) in cleared roots. In the case of maximum intensity projection (maximum projection), the figure represents different regions of the root measured as number of cells after the onset of elongation. For the orthogonal, median, and surface views, cell walls were stained with Calcofluor white (gray in the figures). Scale bar, 20 μm for the maximum projection and orthogonal views. Scale bar, 5 μm for the median and surface views. Ep, epidermis; Co, cortex; End, endodermis (see also Figure S2A). (C) Maximum intensity projection, median, and surface view of confocal sections of plants expressing CASP1-GFP (cyan) and mCherry-UCC1 (red). Signal was captured at the 10th endodermal cell after the onset of elongation observed in vivo. Scale bar, 20 μm for maximum projection and 3 μm for median and surface view (see also Figure S2B). (D) In vivo observation of the surface view of an endodermal cell expressing pESB1::ESB1-mCherry or pCASP1::CASP1-GFP. Scale bar, 2 μm. (E) Immunolocalization assay of UCC1 protein (red) in plant expressing pCASP1::CASP1-GFP (cyan). A primary polyclonal antibody targeting UCC1 was used in combination with a secondary antibody conjugated with Dylight 633. Scale bar, 2 μm see also Figures S2C–S2H. (F) Graph presenting the distribution of normalized pixels intensity (relative pixel intensity, 0–1) across the Casparian strip (distance in μm) for CASP1-GFP fluorescence (cyan) and UCC1 immunofluorescence (red, Dylight 633). Light curves represent individual replicates coming from individual plants (n = 4). Each replicate is the average pixel intensity across a segment of 25 μm along the Casparian strip axis. Dark curves represent the mean values for CASP1-GFP and UCC1 immunofluorescence.
Figure 3
Figure 3
Relations between UCC1 Positioning and Other Components of the Casparian Strips Machinery (A) Analysis of the spatial distribution of CASP1 and UCC1 at the endodermal cell junctions. Images were generated from the same plant co-expressing CASP1-GFP and mCherry-UCC1 using confocal microscopy. The numbers at the bottom of the figure indicate the number of cells after the onset of elongation. White arrows indicate the central accumulation for CASP1-GFP or mCherry-UCC1. Scale bar, 6 μm. (B) Histograms showing the frequency distribution (Frequency [%]) of the onset of expression (upper plot, n = 18) and the onset of localization at the Casparian strip of CASP1-GFP and mCherry-UCC1 (lower plot, n = 28). (C) Maximum intensity projection (left) and surface view (right) of UCC1 immunolocalization (red) at 10 cells after the onset of elongation in WT plants and a collection of Casparian strips mutants: casp1 casp3, esb1, sgn3, esb1 sgn3. White arrows show gaps in the UCC1 localization. Scale bar, 20 μm for the maximum projections and 2 μm the surface views. see also Figure S3A. (D) Maximum intensity projection of CASP1-GFP localization in cleared root of WT plants and the mutants ucc1.1 and ucc1.1 ucc2.1. Scale bar, 20 μm. (E) Surface view of the localization of CASP1-GFP in cleared root of WT plants and the mutants: ucc1.1, ucc1.2, and ucc1.1 ucc2.1. Scale bar, 2 μm. (F) Quantification of normalized pixels intensity (relative pixel intensity; 0–1) across the Casparian strip in plants expressing CASP1-GFP. The plots are showing the intensity profile for individual replicates (n ≥ 10), the mean value (black line), and the 95% confidence interval (gray interval). Each replicate corresponds to the quantification of one picture containing a Casparian strip segment of approximately 25 μm long. The pictures were generated at the 15th cells after the onset of elongation from at least 8 individual plants per genotype. Intensity profiles across the Casparian strip were always measured in the same orientation—from the cortical side toward the pericycle side of the endodermis. Letters indicate statistically significant differences between genotypes for the intensity values comprised between the dashed lines using an ANOVA and Tukey’s test as post hoc analysis (p < 0.01) (see also Figures S3B and S3C).
Figure 4
Figure 4
UCC1 and UCC2 Are Necessary for the Central Lignification of the Casparian Strip (A) Surface view of the Casparian strip lignin stained with Basic fuchsin in WT plants and the mutants ucc2.1, ucc1.1, ucc1.2, and ucc1.2 ucc2.1. Whites arrows show lack of lignification in the central domain of the Casparian strip across the different genotypes. Scale bar, 2 μm. see also Figure S4A. (B) Quantification of normalized pixels intensity (0–1) (relative pixel intensity) across the Casparian strip using surface views as shown in (A). The plots show the intensity profile for individual plants (n ≥ 13). In the figure, the mean value is represented by a black line and the 95% confidence interval is in gray. The data were generated using individual pictures containing a Casparian strip segment of approximately 25 μm long. The pictures were taken at the 15th cells after the onset of elongation and the intensity profiles were measured in the same direction, from the cortex side toward the pericycle side of the endodermis. Letters indicate statistically significant differences between genotypes using an ANOVA and Tukey’s test as post hoc analysis (p < 0.01) (see also Figure S4B).

Comment in

References

    1. Geldner N. The endodermis. Annu. Rev. Plant Biol. 2013;64:531–558. - PubMed
    1. Kamiya T., Borghi M., Wang P., Danku J.M.C., Kalmbach L., Hosmani P.S., Naseer S., Fujiwara T., Geldner N., Salt D.E. The MYB36 transcription factor orchestrates Casparian strip formation. Proc. Natl. Acad. Sci. USA. 2015;112:10533–10538. - PMC - PubMed
    1. Li B., Kamiya T., Kalmbach L., Yamagami M., Yamaguchi K., Shigenobu S., Sawa S., Danku J.M.C., Salt D.E., Geldner N., Fujiwara T. Role of LOTR1 in Nutrient Transport through Organization of Spatial Distribution of Root Endodermal Barriers. Curr. Biol. 2017;27:758–765. - PubMed
    1. Wang P., Calvo-Polanco M., Reyt G., Barberon M., Champeyroux C., Santoni V., Maurel C., Franke R.B., Ljung K., Novák O. Surveillance of cell wall diffusion barrier integrity modulates water and solute transport in plants. Sci. Rep. 2019;9:4227. - PMC - PubMed
    1. Pfister A., Barberon M., Alassimone J., Kalmbach L., Lee Y., Vermeer J.E., Yamazaki M., Li G., Maurel C., Takano J. A receptor-like kinase mutant with absent endodermal diffusion barrier displays selective nutrient homeostasis defects. eLife. 2014;3:e03115. - PMC - PubMed

Publication types

MeSH terms

LinkOut - more resources