Clinical Trial
. 2021 Mar;128(3):425-442.
doi: 10.1016/j.ophtha.2020.08.018. Epub 2020 Aug 25.

Dietary Nutrient Intake and Progression to Late Age-Related Macular Degeneration in the Age-Related Eye Disease Studies 1 and 2

Affiliations
Clinical Trial

Dietary Nutrient Intake and Progression to Late Age-Related Macular Degeneration in the Age-Related Eye Disease Studies 1 and 2

Elvira Agrón et al. Ophthalmology. 2021 Mar.

Abstract

Purpose: To analyze associations between the dietary intake of multiple nutrients and risk of progression to late age-related macular degeneration (AMD), its subtypes, and large drusen.

Design: Post hoc analysis of 2 controlled clinical trial cohorts: Age-Related Eye Disease Study (AREDS) and AREDS2.

Participants: Eyes with no late AMD at baseline among AREDS participants (n = 4504) and AREDS2 participants (n = 3738) totaled 14 135 eyes. Mean age was 71.0 years (standard deviation, 6.7 years), and 56.5% of patients were women.

Methods: Fundus photographs were collected at annual study visits and graded centrally for late AMD. Dietary intake of multiple nutrients was calculated from food frequency questionnaires.

Main outcome measures: Progression to late AMD, geographic atrophy (GA), neovascular AMD, and (separate analyses) large drusen.

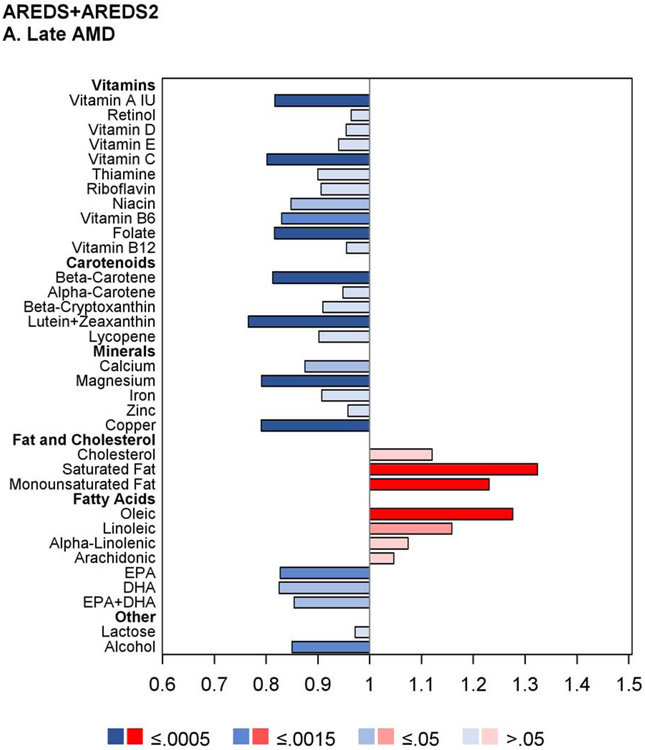
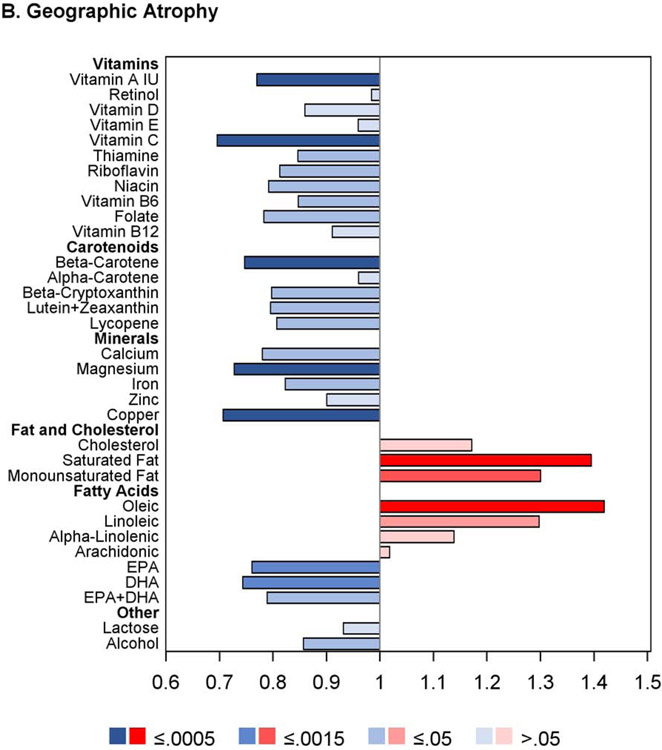
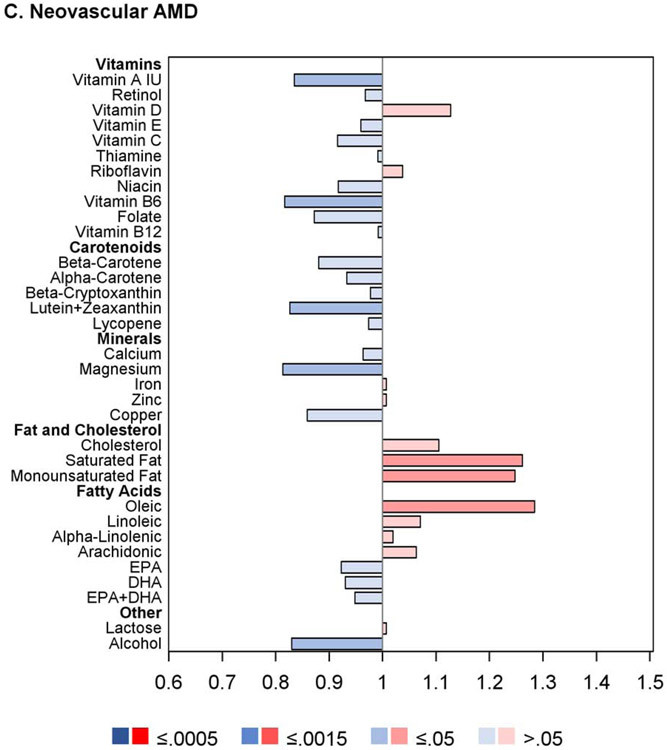
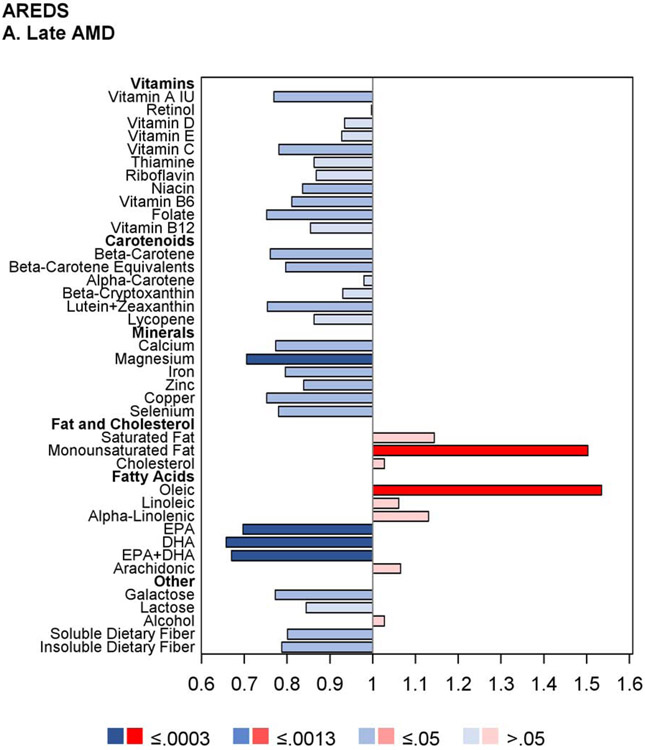
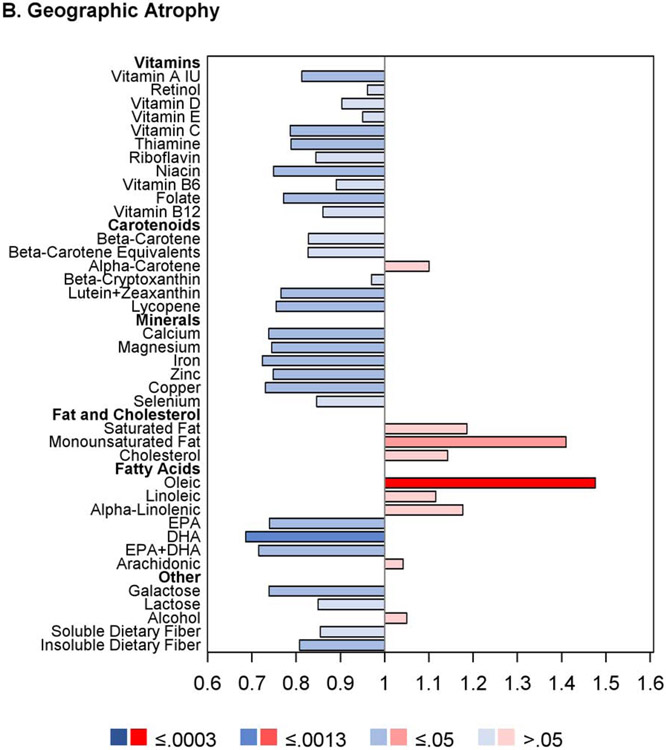
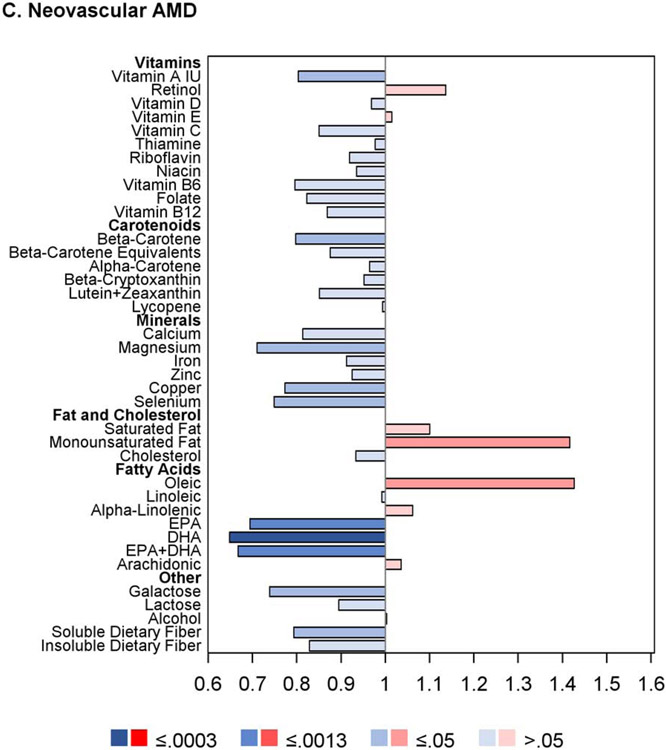
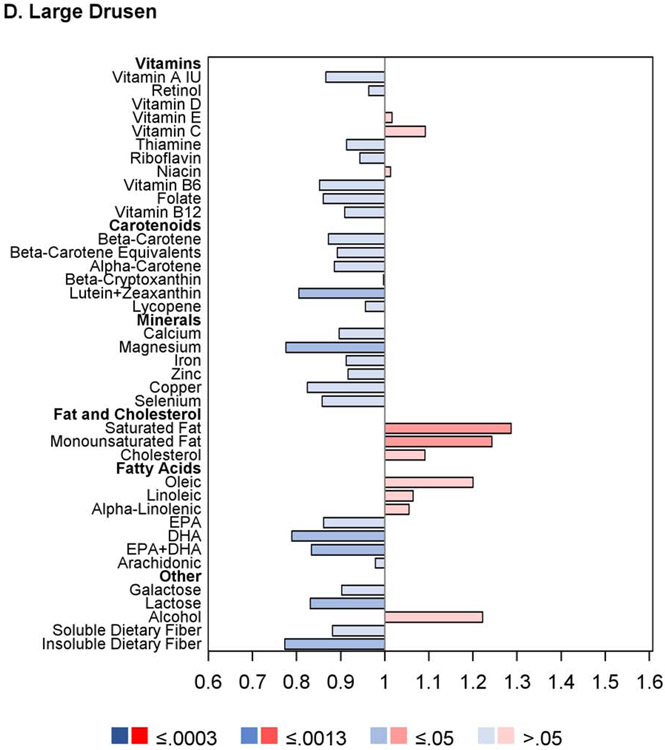
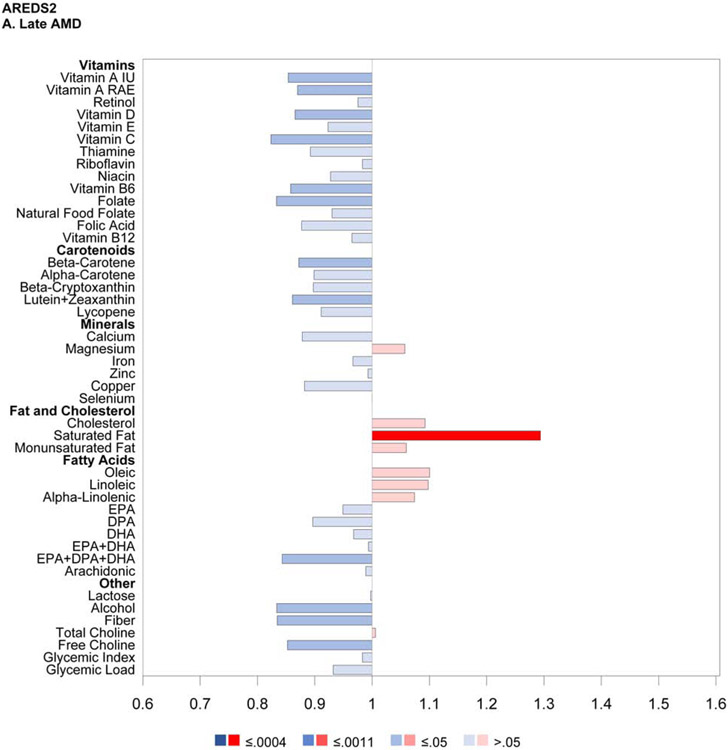
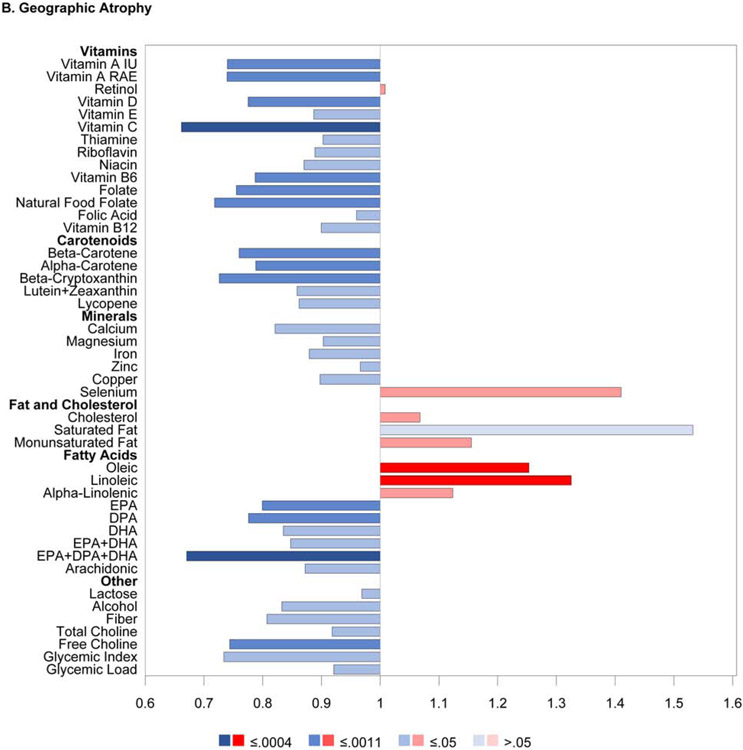
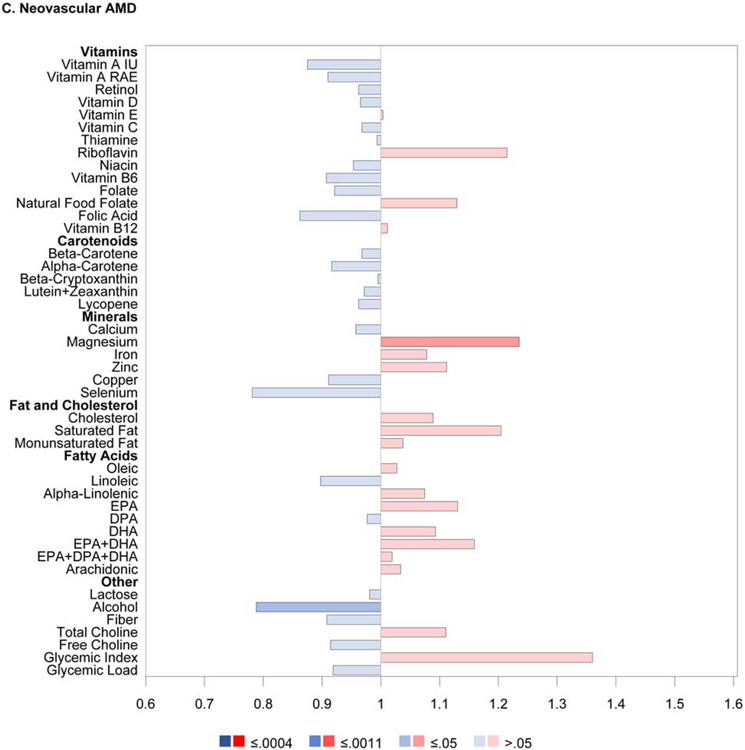
Results: Over median follow-up of 10.2 years, of the 14 135 eyes, 32.7% progressed to late AMD. For 9 nutrients, intake quintiles 4 or 5 (vs. 1) were associated significantly (P ≤ 0.0005) with decreased risk of late AMD: vitamin A, vitamin B6, vitamin C, folate, β-carotene, lutein and zeaxanthin, magnesium, copper, and alcohol. For 3 nutrients, quintiles 4 or 5 were associated significantly with increased risk: saturated fatty acid, monounsaturated fatty acid, and oleic acid. Similar results were observed for GA. Regarding neovascular AMD, 9 nutrients were associated nominally with decreased risk-vitamin A, vitamin B6, β-carotene, lutein and zeaxanthin, magnesium, copper, docosahexaenoic acid, omega-3 fatty acid, and alcohol-and 3 nutrients were associated with increased risk-saturated fatty acid, monounsaturated fatty acid, and oleic acid. In separate analyses (n = 5399 eyes of 3164 AREDS participants), 12 nutrients were associated nominally with decreased risk of large drusen.

Conclusions: Higher dietary intake of multiple nutrients, including minerals, vitamins, and carotenoids, is associated with decreased risk of progression to late AMD. These associations are stronger for GA than for neovascular AMD. The same nutrients also tend to show protective associations against large drusen development. Strong genetic interactions exist for some nutrient-genotype combinations, particularly omega-3 fatty acids and CFH. These data may justify further research into underlying mechanisms and randomized trials of supplementation.

Keywords: Age-related macular degeneration; Antioxidant; Carotenoid; Diet; Fatty acid; Geographic atrophy; Large drusen; Mineral; Neovascular AMD; Nutrient; Supplement; Vitamin.


Conflict of interest statement

Conflict of interest:

No conflicting relationship exists for any author.

Figures

Figure 1.
Figure 1.
Butterfly plots showing proportional hazards regression modeling of progression to late age-related macular degeneration outcomes in the combined AREDS/AREDS2 cohort. For each nutrient, the hazard ratio of dietary intake quintile 5 (with quintile 1 as reference) is shown on the x axis, with protective associations in blue and harmful associations in red; smaller P values are denoted by darker colors.
Figure 1.
Figure 1.
Butterfly plots showing proportional hazards regression modeling of progression to late age-related macular degeneration outcomes in the combined AREDS/AREDS2 cohort. For each nutrient, the hazard ratio of dietary intake quintile 5 (with quintile 1 as reference) is shown on the x axis, with protective associations in blue and harmful associations in red; smaller P values are denoted by darker colors.
Figure 2.
Figure 2.
Butterfly plots showing proportional hazards regression modeling of progression to late age-related macular degeneration outcomes and progression to large drusen in the AREDS cohort. For each nutrient, the hazard ratio of dietary intake quintile 5 (with quintile 1 as reference) is shown on the x axis, with protective associations in blue and harmful associations in red; smaller P values are denoted by darker colors.
Figure 2.
Figure 2.
Butterfly plots showing proportional hazards regression modeling of progression to late age-related macular degeneration outcomes and progression to large drusen in the AREDS cohort. For each nutrient, the hazard ratio of dietary intake quintile 5 (with quintile 1 as reference) is shown on the x axis, with protective associations in blue and harmful associations in red; smaller P values are denoted by darker colors.
Figure 3.
Figure 3.
Butterfly plots showing proportional hazards regression modeling of progression to late age-related macular degeneration outcomes in the AREDS2 cohort. For each nutrient, the hazard ratio of dietary intake quintile 5 (with quintile 1 as reference) is shown on the x axis, with protective associations in blue and harmful associations in red; smaller P values are denoted by darker colors.
Figure 3.
Figure 3.
Butterfly plots showing proportional hazards regression modeling of progression to late age-related macular degeneration outcomes in the AREDS2 cohort. For each nutrient, the hazard ratio of dietary intake quintile 5 (with quintile 1 as reference) is shown on the x axis, with protective associations in blue and harmful associations in red; smaller P values are denoted by darker colors.

References

    1. Quartilho A, Simkiss P, Zekite A, Xing W, Wormald R, Bunce C. Leading causes of certifiable visual loss in England and Wales during the year ending 31 March 2013. Eye (Lond). 2016;30(4):602–607. - PMC - PubMed
    1. Congdon N, O'Colmain B, Klaver CC, et al. Causes and prevalence of visual impairment among adults in the United States. Arch Ophthalmol. 2004;122(4):477–485. - PubMed
    1. Fritsche LG, Fariss RN, Stambolian D, Abecasis GR, Curcio CA, Swaroop A. Age-related macular degeneration: genetics and biology coming together. Annu Rev Genomics Hum Genet. 2014;15:151–171. - PMC - PubMed
    1. Chakravarthy U, Wong TY, Fletcher A, et al. Clinical risk factors for age-related macular degeneration: a systematic review and meta-analysis. BMC Ophthalmol. 2010;10:31. - PMC - PubMed
    1. Chapman NA, Jacobs RJ, Braakhuis AJ. Role of diet and food intake in age-related macular degeneration: a systematic review. Clin Exp Ophthalmol. 2019;47(1):106–127. - PubMed

Publication types