. 2020 Aug 26;9(9):2765.
doi: 10.3390/jcm9092765.

The Effects of Adding Transcutaneous Spinal Cord Stimulation (tSCS) to Sit-To-Stand Training in People with Spinal Cord Injury: A Pilot Study

Affiliations

The Effects of Adding Transcutaneous Spinal Cord Stimulation (tSCS) to Sit-To-Stand Training in People with Spinal Cord Injury: A Pilot Study

Yazi Al'joboori et al. J Clin Med. .

Abstract

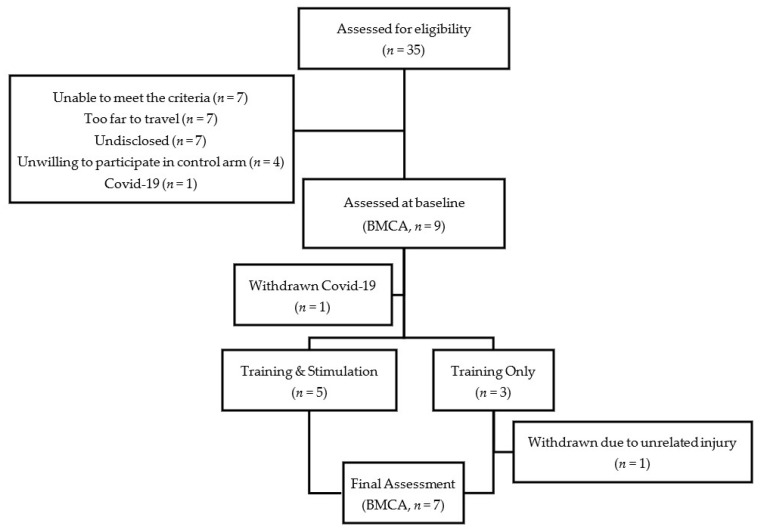
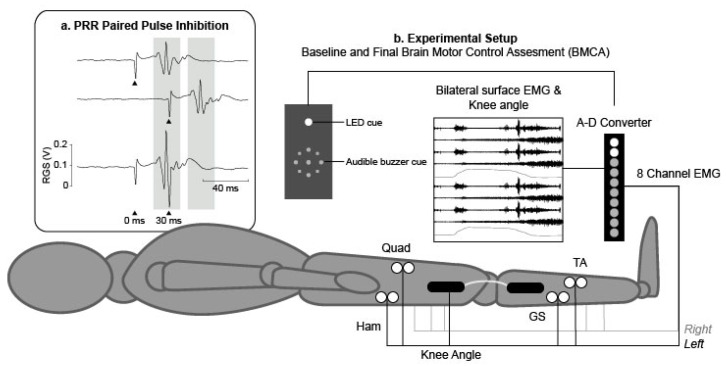
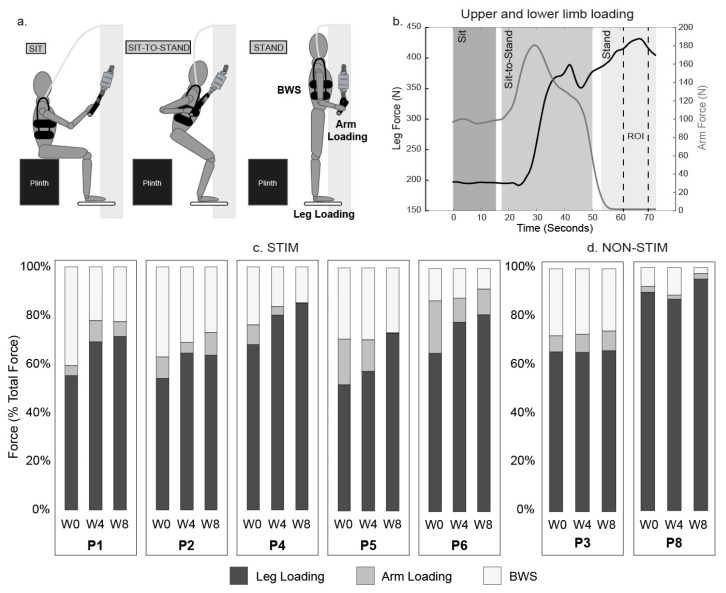
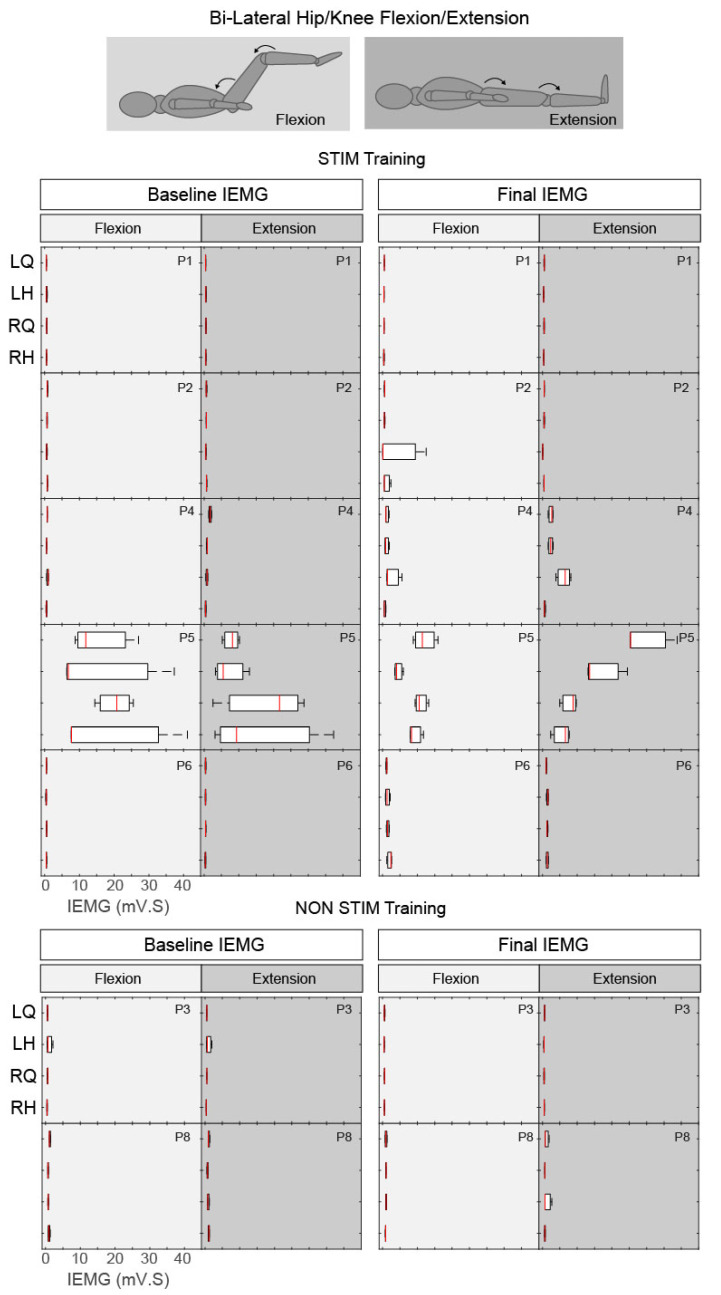
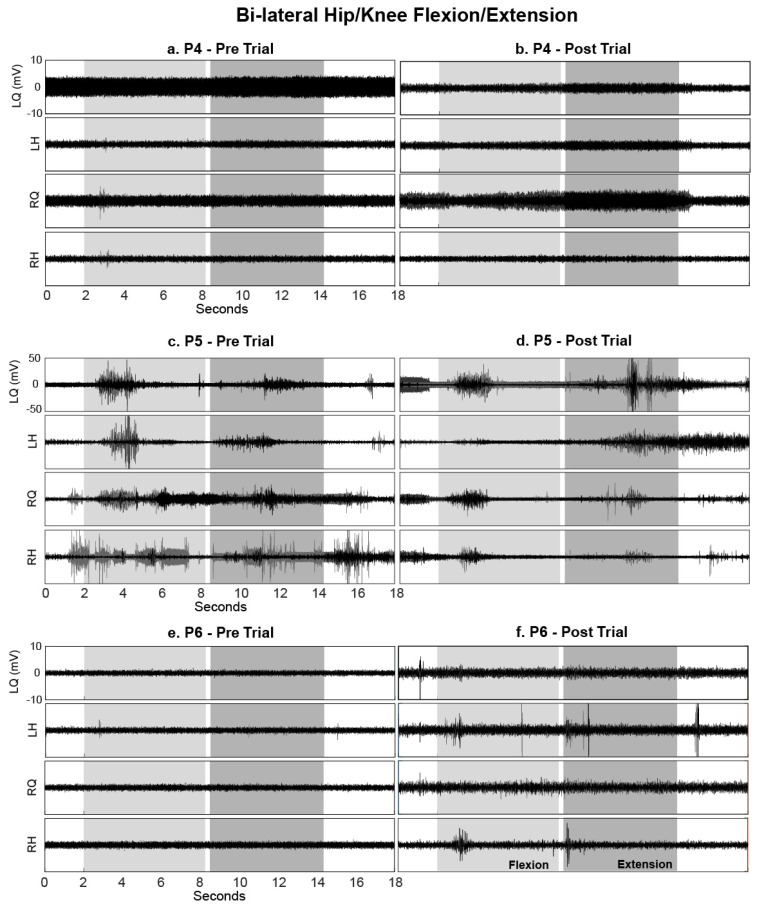
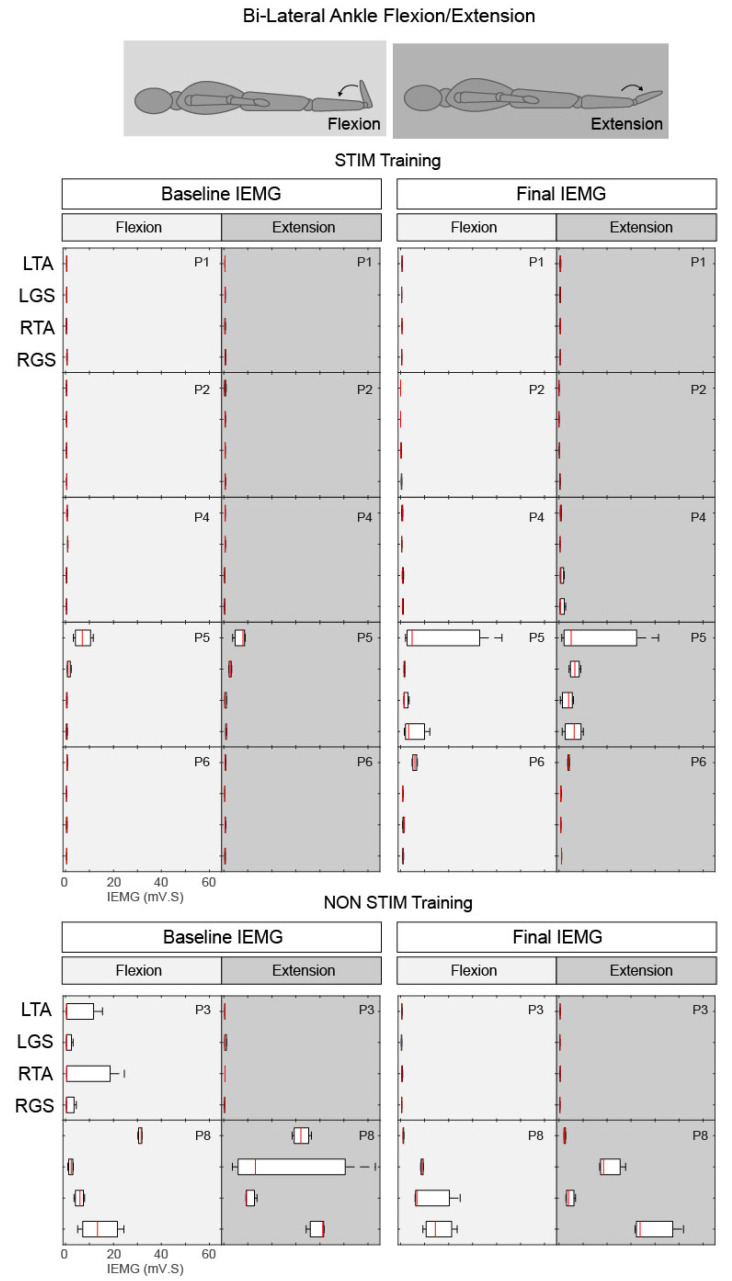
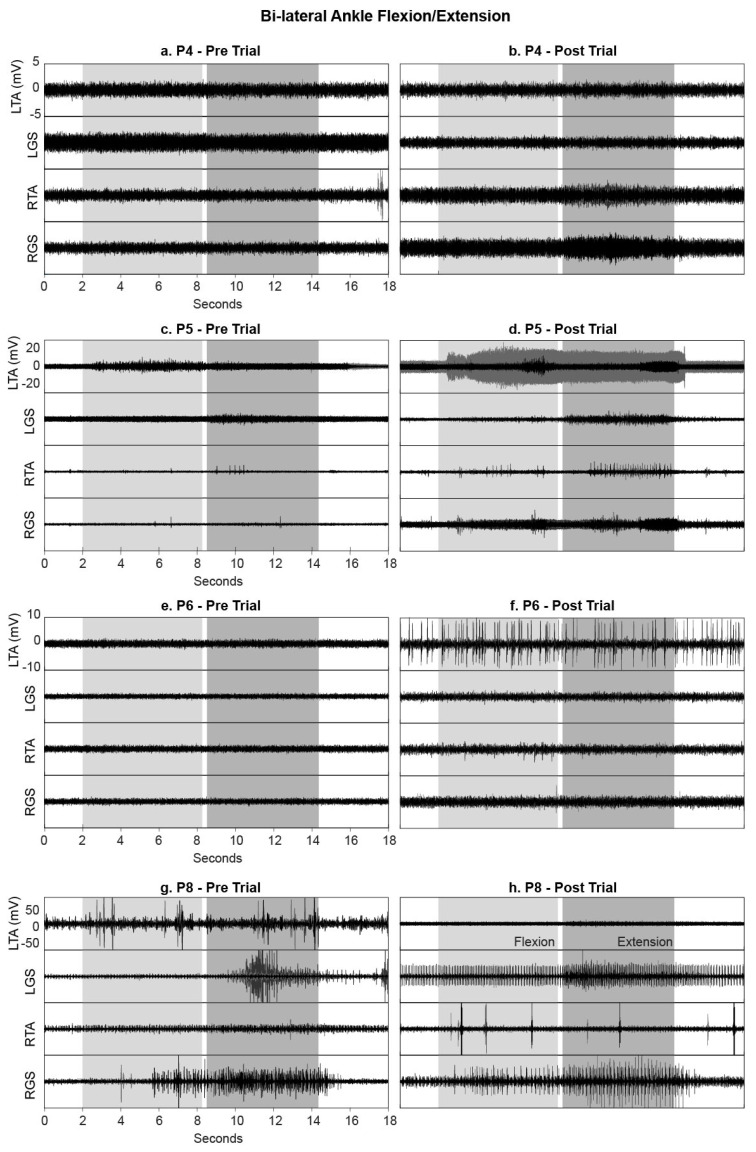
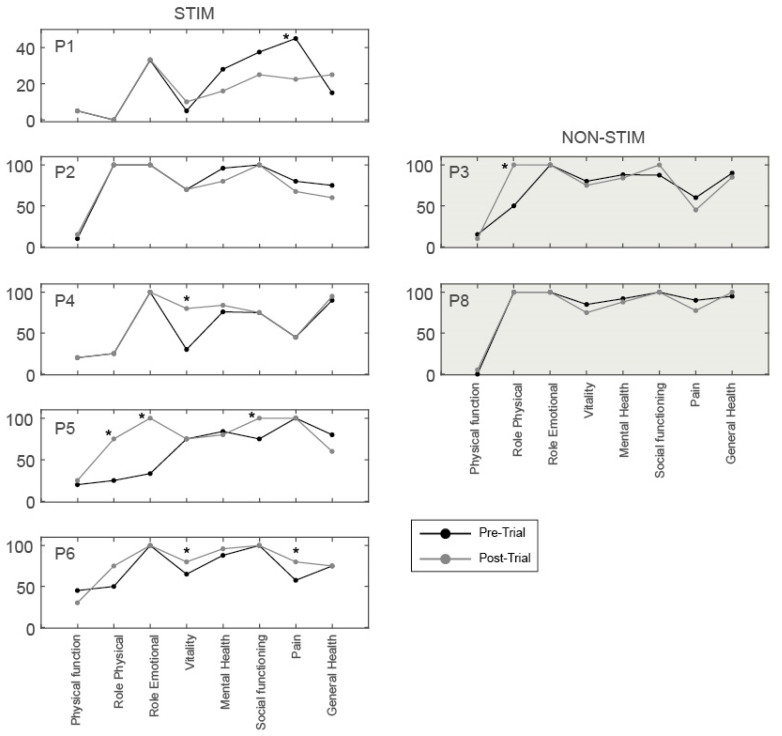
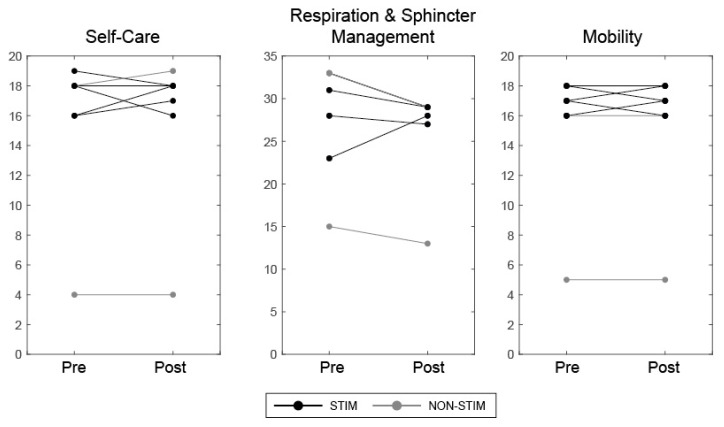
Spinal cord stimulation may enable recovery of volitional motor control in people with chronic Spinal Cord Injury (SCI). In this study we explored the effects of adding SCS, applied transcutaneously (tSCS) at vertebral levels T10/11, to a sit-to-stand training intervention in people with motor complete and incomplete SCI. Nine people with chronic SCI (six motor complete; three motor incomplete) participated in an 8-week intervention, incorporating three training sessions per week. Participants received either tSCS combined with sit-to-stand training (STIM) or sit-to-stand training alone (NON-STIM). Outcome measures were carried out before and after the intervention. Seven participants completed the intervention (STIM N = 5; NON-STIM N = 2). Post training, improvements in International Standards for Neurological Classification of Spinal Cord Injury (ISNCSCI) motor scores were noted in three STIM participants (range 1.0-7.0), with no change in NON-STIM participants. Recovery of volitional lower limb muscle activity and/or movement (with tSCS off) was noted in three STIM participants. Unassisted standing was not achieved in any participant, although standing with minimal assistance was achieved in one STIM participant. This pilot study has shown that the recruitment of participants, intervention and outcome measures were all feasible in this study design. However, some modifications are recommended for a larger trial.

Keywords: human; neuromodulation; neurorehabilitation; non-invasive; spinal cord injury; transcutaneous spinal cord stimulation.


Conflict of interest statement

The authors declare no conflict of interest. The funders had no role in the design of the study; in the collection, analyses, or interpretation of data; in the writing of the manuscript, or in the decision to publish the results.

Figures

Figure 1
Figure 1
CONSORT flow diagram.
Figure 2
Figure 2
(a) Example traces during posterior root reflex (PRR) testing; single pulses were delivered at 0 and 30 ms (upper traces) and as a pair with an interstimulus interval (ISI) of 30 ms (lower trace) to demonstrate paired pulse inhibition (arrows denote the time at which the stimulus was applied). (b) Experimental setup for baseline and final Brain Motor Control Assessments. Participants were placed in a supine position with bilateral electromyography (EMG) electrodes placed over the Quadriceps (Quad), Hamstring (Ham), Tibialis Anterior (TA) and Gastrocnemius (GS) muscles to record EMG and electro-goniometers were placed laterally across the knee joints to synchronously record knee joint range of motion.
Figure 3
Figure 3
Maximum loading through the lower and upper limbs during standing. Experimental set up (a) and example plot of measured leg force (black) and arm force (grey) from one participant with dashed lines indicating an isolated region of interest (ROI) used to quantify force as described in 2.6 (b). The weekly changes in distribution of forces (measured from the ROI) are shown in (c,d). Loading though lower limbs (black), upper limbs (grey) and manually recorded bodyweight support (white) at week 0, 4 and 8 of the intervention, for all participants.
Figure 4
Figure 4
Box plots of integrated EMG activity recorded from the left (L) and right (R) quadriceps (Q) and hamstrings (H) during hip/knee flexion (light grey) and extension (dark grey) movements without tSCS, before (Baseline) and after (Final) the intervention, for all participants. Patterns of integrated EMG (IEMG) (averaged over 3 trials) are displayed for each participant during both flexion and extension phases. Each plot indicates the 25–75th percentiles (box), minimum and maximum values (whiskers), and median value (central red line).
Figure 5
Figure 5
EMG activity recorded from the left (L) and right (R) quadriceps (Q) and hamstrings (H) during hip/knee flexion (light grey) and extension (dark grey) movements without tSCS, before and after the intervention. Data are shown for (a,b) P4, (c,d) P5 and (e,f) P6 (all in the STIM group); each movement was repeated three times, and EMG data from all three movements are overlaid.
Figure 6
Figure 6
Box plots of integrated EMG activity recorded from the left (L) and right (R) Tibialis Anterior (TA) and Gastrocnemius (GS) during ankle flexion (light grey) and extension (dark grey) movements without tSCS, before (Baseline) and after (Final) the intervention for all participants. Patterns of IEMG (averaged over 3 trials) are displayed for each participant during both flexion and extension phases. Each plot indicates the 25–75th percentiles (box), minimum and maximum values (whiskers), and median value (central red line).
Figure 7
Figure 7
EMG activity recorded from the left (L) and right (R) Tibialis Anterior (TA) and Gastrocnemius (GS) during ankle flexion (light grey) and extension (dark grey) movements without tSCS, before and after the intervention. Data are shown for (a,b) P4, (c,d) P5, (e,f) P6 (STIM group) and (g,h) P8 (NON-STIM group); each movement was repeated three times, and EMG data from all three movements are overlaid.
Figure 8
Figure 8
SF-36 scores across 8 sub-categories before (black) and after (grey) the intervention for participants in STIM and NON-STIM groups. * denotes a pre-post intervention change of >MDC for each participant within each sub-category [43].
Figure 9
Figure 9
SCIM scores across three sub-categories before (pre) and after (post) the intervention for participants in STIM (black) and NON-STIM (grey) groups.

References

    1. Spinal Cord Injury Centre Physiotherapy Lead Clinicians United Kingdom and Ireland . Clinical Guideline for Standing Adults Following Spinal Cord Injury. MASCIP; Aylesbury, UK: 2013.
    1. Hofer A.S., Schwab M.E. Enhancing rehabilitation and functional recovery after brain and spinal cord trauma with electrical neuromodulation. Curr. Opin. Neurol. 2019;32:828–835. doi: 10.1097/WCO.0000000000000750. - DOI - PMC - PubMed
    1. Ichiyama R.M., Gerasimenko Y.P., Zhong H., Roy R.R., Edgerton V.R. Hindlimb stepping movements in complete spinal rats induced by epidural spinal cord stimulation. Neurosci. Lett. 2005;383:339–344. doi: 10.1016/j.neulet.2005.04.049. - DOI - PubMed
    1. Lavrov I., Dy C.J., Fong A.J., Gerasimenko Y., Courtine G., Zhong H., Roy R.R., Edgerton V.R. Epidural stimulation induced modulation of spinal locomotor networks in adult spinal rats. J. Neurosci. Off. J. Soc. Neurosci. 2008;28:6022–6029. doi: 10.1523/JNEUROSCI.0080-08.2008. - DOI - PMC - PubMed
    1. Dimitrijevic M.R., Gerasimenko Y., Pinter M.M. Evidence for a spinal central pattern generator in humans. Ann. N. Y. Acad. Sci. 1998;860:360–376. doi: 10.1111/j.1749-6632.1998.tb09062.x. - DOI - PubMed

Grants and funding