. 2020 Aug 26;20(17):4827.
doi: 10.3390/s20174827.

Quantitative Long-Term Monitoring of the Circulating Gases in the KATRIN Experiment Using Raman Spectroscopy

Max Aker  1 Konrad Altenmüller  2   3 Armen Beglarian  4 Jan Behrens  5   6 Anatoly Berlev  7 Uwe Besserer  1 Benedikt Bieringer  8 Klaus Blaum  9 Fabian Block  5 Beate Bornschein  1 Lutz Bornschein  6 Matthias Böttcher  8 Tim Brunst  2   10 Thomas C Caldwell  11   12 Suren Chilingaryan  4 Wonqook Choi  5 Deseada D Díaz Barrero  13 Karol Debowski  14 Marco Deffert  5 Martin Descher  5 Peter J Doe  15 Otokar Dragoun  16 Guido Drexlin  5 Stephan Dyba  8 Frank Edzards  2   10 Klaus Eitel  6 Enrico Ellinger  14 Ralph Engel  6 Sanshiro Enomoto  15 Mariia Fedkevych  8 Arne Felden  6 Joseph F Formaggio  17 Florian Fränkle  6 Gregg B Franklin  18 Fabian Friedel  5 Alexander Fulst  8 Kevin Gauda  8 Woosik Gil  6 Ferenc Glück  6 Robin Größle  1 Rainer Gumbsheimer  6 Volker Hannen  8 Norman Haußmann  14 Klaus Helbing  14 Stephanie Hickford  5 Roman Hiller  5 David Hillesheimer  1 Dominic Hinz  6 Thomas Höhn  6 Thibaut Houdy  2   10 Anton Huber  5 Alexander Jansen  6 Christian Karl  2   10 Jonas Kellerer  5 Luke Kippenbrock  15 Manuel Klein  5 Christoph Köhler  2   10 Leonard Köllenberger  6 Andreas Kopmann  4 Marc Korzeczek  5 Alojz Kovalík  16 Bennet Krasch  1 Holger Krause  6 Luisa La Cascio  5 Thierry Lasserre  3 Thanh-Long Le  1 Ondřej Lebeda  16 Bjoern Lehnert  19 Alexey Lokhov  8 Moritz Machatschek  5 Emma Malcherek  6 Alexander Marsteller  1 Eric L Martin  11   12 Matthias Meier  2   10 Christin Melzer  1 Susanne Mertens  2   10 Klaus Müller  6 Simon Niemes  1 Patrick Oelpmann  8 Alexander Osipowicz  20 Diana S Parno  18 Alan W P Poon  19 Jose M Lopez Poyato  13 Florian Priester  1 Oliver Rest  8 Marco Röllig  1 Carsten Röttele  1   5   6 R G Hamish Robertson  15 Caroline Rodenbeck  8 Milos Ryšavỳ  16 Rudolf Sack  8 Alejandro Saenz  21 Peter Schäfer  1 Anna Schaller Née Pollithy  2   10 Lutz Schimpf  5 Klaus Schlösser  6 Magnus Schlösser  1 Lisa Schlüter  2   10 Michael Schrank  6 Bruno Schulz  21 Michal Sefčík  16 Hendrik Seitz-Moskaliuk  5 Valérian Sibille  17 Daniel Siegmann  2   10 Martin Slezák  2   10 Felix Spanier  6 Markus Steidl  6 Michael Sturm  1 Menglei Sun  15 Helmut H Telle  13 Larisa A Thorne  18 Thomas Thümmler  6 Nikita Titov  7 Igor Tkachev  7 Drahoš Vénos  16 Kathrin Valerius  6 Ana P Vizcaya Hernández  18 Marc Weber  4 Christian Weinheimer  8 Christiane Weiss  22 Stefan Welte  1 Jürgen Wendel  1 John F Wilkerson  11   12 Joachim Wolf  5 Sascha Wüstling  4 Weiran Xu  17 Yung-Ruey Yen  18 Sergey Zadoroghny  7 Genrich Zeller  1
Affiliations

Quantitative Long-Term Monitoring of the Circulating Gases in the KATRIN Experiment Using Raman Spectroscopy

Max Aker et al. Sensors (Basel). .

Abstract

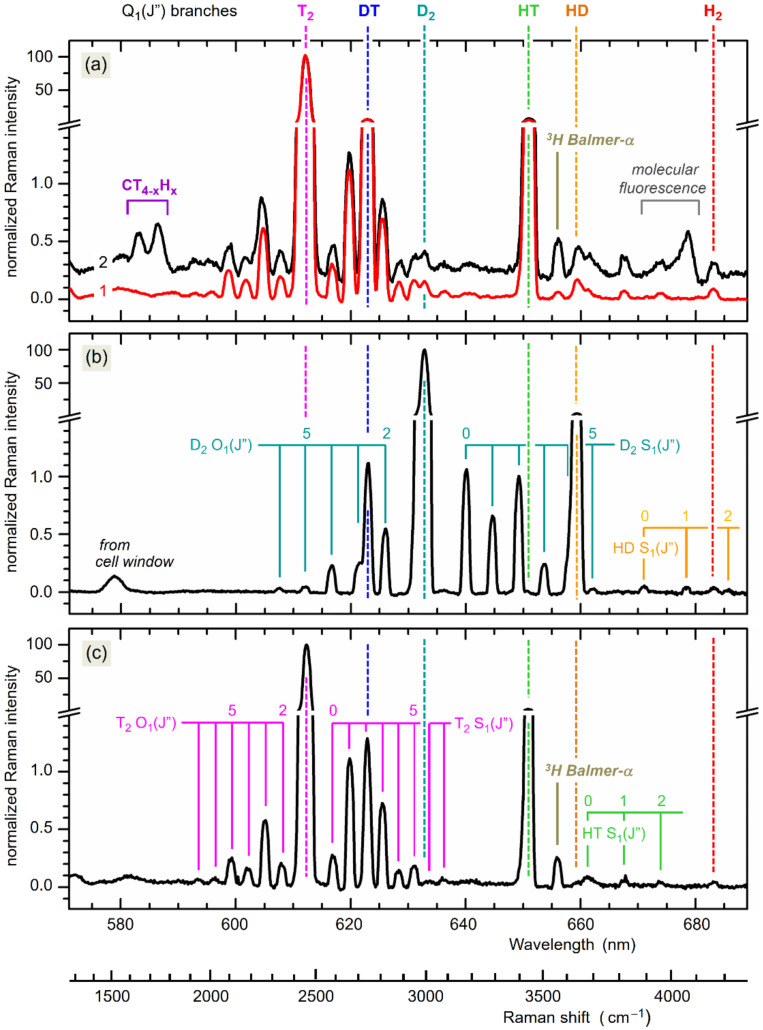
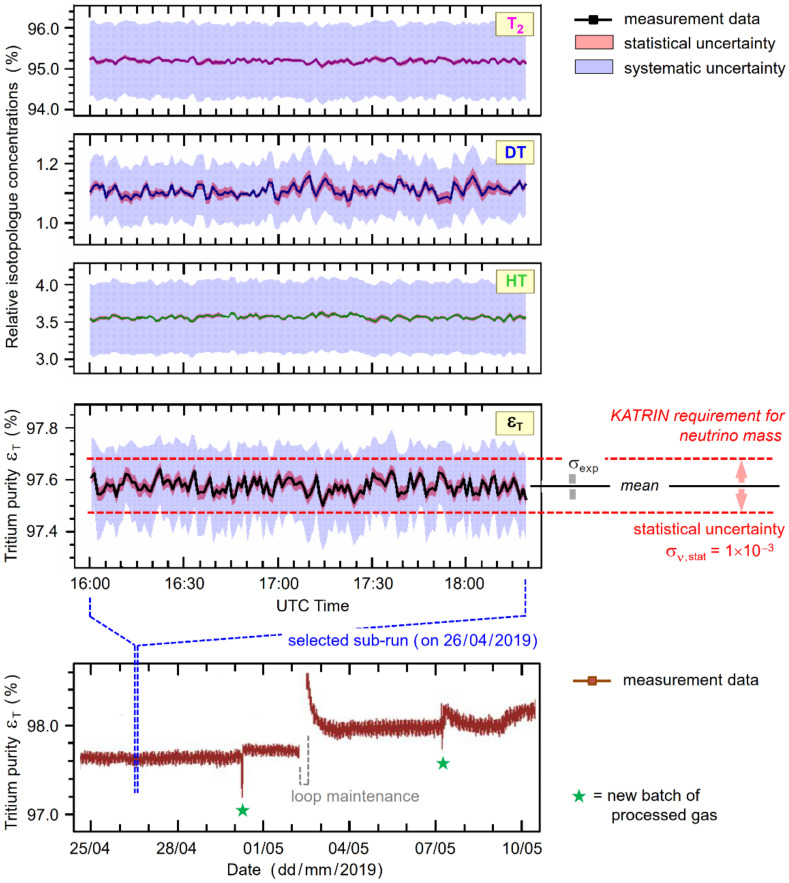
The Karlsruhe Tritium Neutrino (KATRIN) experiment aims at measuring the effective electron neutrino mass with a sensitivity of 0.2 eV/c2, i.e., improving on previous measurements by an order of magnitude. Neutrino mass data taking with KATRIN commenced in early 2019, and after only a few weeks of data recording, analysis of these data showed the success of KATRIN, improving on the known neutrino mass limit by a factor of about two. This success very much could be ascribed to the fact that most of the system components met, or even surpassed, the required specifications during long-term operation. Here, we report on the performance of the laser Raman (LARA) monitoring system which provides continuous high-precision information on the gas composition injected into the experiment's windowless gaseous tritium source (WGTS), specifically on its isotopic purity of tritium-one of the key parameters required in the derivation of the electron neutrino mass. The concentrations cx for all six hydrogen isotopologues were monitored simultaneously, with a measurement precision for individual components of the order 10-3 or better throughout the complete KATRIN data taking campaigns to date. From these, the tritium purity, εT, is derived with precision of <10-3 and trueness of <3 × 10⁻³, being within and surpassing the actual requirements for KATRIN, respectively.

Keywords: KATRIN; Raman spectroscopy; gas composition monitoring; tritium.


Conflict of interest statement

The authors declare no conflict of interest.

Figures

Figure 1
Figure 1
Concept of the gas circulation through the WGTS. (a) Schematic simplified diagram of the inner loop, incorporating the WGTS component group; note that, for clarity, not all differential pump port connections to the loop are drawn. The link to the outer loop of the TLK infrastructure for recovery, isotope separation, and storage is included conceptually. (b) Selected technical details of the loop segment from the Raman cell to the WGTS injection chamber; relevant numerical values for dimensions—L and ID (=inner diameter)—and operating parameters—p and T—are indicated.
Figure 2
Figure 2
Concept of the laser Raman (LARA) monitoring setup. The LARA cell is positioned within the secondary glove box enclosure (for tritium safety); it is accessible for laser excitation and Raman light collection through anti-reflection (AR) coated windows. For in situ absolute spectral sensitivity calibration, the LARA cell can be replaced with a fluorescence standard assembly. For further details, see text.
Figure 3
Figure 3
Concept of LARA system control and Raman data processing, based on the bespoke, modular LabVIEW suite LARAsoft. Note that the KATRIN control and data storage routines are not part of LARAsoft. For further details, see text.
Figure 4
Figure 4
Spectra from selected pre-KATRIN and KATRIN gas circulation campaigns. (a) LOOPINO—12/2014: Raman spectra from the first day of circulation (trace 1) and after 55 days of circulation (trace 2, offset by +0.2); the two spectra are offset to each other for clarity. (b) First tritium (FT)—05/2018: Raman spectrum of the gas mixture after two days of circulation. (c) KATRIN ramp-up (KNM1)—03/2019: Raman spectrum recorded after five days of circulation, during the second ramp-up step. For all spectra, relevant features are annotated; for further detail, see text. Note the split intensity scales to visualize both strong and weak spectral features.
Figure 5
Figure 5
Deconvolution of spectral overlapping, exemplified for the determination of exact T2/DT concentrations in the KNM1 gas mixture. Top-left—segment of the spectrum in Figure 3c (the scale is split, to visualize all spectral features; center-left—theoretical O1(J″)/S1(J″) lines for T2, overlaid on the experimental spectrum, with the individual Raman lines annotated; bottom-left—spectrum with the O1(J″)/S1(J″) lines subtracted, leaving only the Q1(J″)-branches to evaluate species concentrations. Top-right—experimental line profile function, derived using ShapeFit; center-right—theoretical Raman line strengths φij for the O1(J″)/Q1(J″)/S1(J″) lines of T2 and DT, calculated for a gas temperature of T = 298 ± 2 K. Note that the values for the O1(J″)/S1(J″) lines of T2 are scaled by ×20, to emphasize the overlap between T2 S1(2) and DT Q1(J”).
Figure 6
Figure 6
Temporal change of relative isotopologue concentrations of the tritium gas mixture circulating through the WGTS, during the first ramp-up to full KATRIN operation during 4–15 March 2019. Top panels: relative concentrations for the three radioactive isotopologues T2, DT, and HT. During the time period indicated by the symbol ★, no data were available (caused by an intermittent data transfer failure); during the ramp-up change periods (indicated by the dashed vertical lines), the system response does not tend to equilibrium—these data are excluded from the long-term analysis. Bottom panel: monitoring data for the pressure-controlled buffer vessel (PC-BV) during the ramp-up—the related, nominal ρd values for the WGTS are indicated. For further details, see text.
Figure 7
Figure 7
Selected measurement data from KATRIN LARA during KNM1 (April—May 2019). Top panels—concentrations of the three tritiated isotopologues T2, DT, and HT (in percent of the sum of all molecular gas components); the statistical and systematic uncertainties are indicated by the colored bands. Bottom panels—derived tritium purity εT for a two-week period during KNM1 (lower data trace) and an individual sub-run (upper data trace); for the latter the statistical and systematic uncertainties are indicated by the colored bands. The statistical uncertainty limit, required for the KATRIN neutrino mass calculation, is indicated on the right. For further details, see text.

References

    1. Brown L.M. The idea of the neutrino. Phys. Today. 1978;31:23–28. doi: 10.1063/1.2995181. - DOI
    1. Mößbauer R.L. History of Neutrino Physics: Pauli’s Letters. In Proceedings of the Fourth SFB-375 Ringberg Workshop Neutrino Astrophysics. [(accessed on 10 July 2020)];1998 :3–5. Available online: https://arxiv.org/pdf/astro-ph/9801320.pdf#page=11.
    1. Cowan C.L., Jr., Reines F., Harrison F.B., Kruse H.W., McGuire A.D. Detection of the free neutrino: A confirmation. Science. 1956;124:103–104. doi: 10.1126/science.124.3212.103. - DOI - PubMed
    1. Gaillard M.K., Grannis P.D., Sciulli F.J. The standard model of particle physics. Rev. Mod. Phys. 1999;71:S96–S111. doi: 10.1103/RevModPhys.71.S96. - DOI
    1. Fukuda Y., Hayakawa T., Ichihara E., Inoue K., Ishihara K., Ishino H., Itow Y., Kajita T., Kameda J., Kasuga S., et al. Evidence for oscillation of atmospheric neutrinos. Phys. Rev. Lett. 1998;81:1562–1567. doi: 10.1103/PhysRevLett.81.1562. - DOI