

CRISPR/Cas9 Directed Mutagenesis of OsGA20ox2 in High Yielding Basmati Rice (Oryza sativa L.) Line and Comparative Proteome Profiling of Unveiled Changes Triggered by Mutations
- PMID: 32859098
- PMCID: PMC7504442
- DOI: 10.3390/ijms21176170
CRISPR/Cas9 Directed Mutagenesis of OsGA20ox2 in High Yielding Basmati Rice (Oryza sativa L.) Line and Comparative Proteome Profiling of Unveiled Changes Triggered by Mutations
Abstract
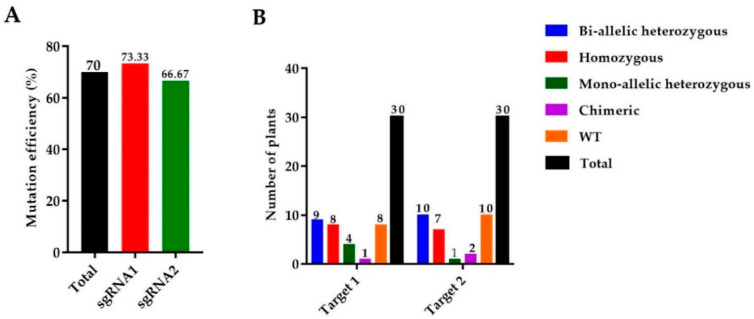
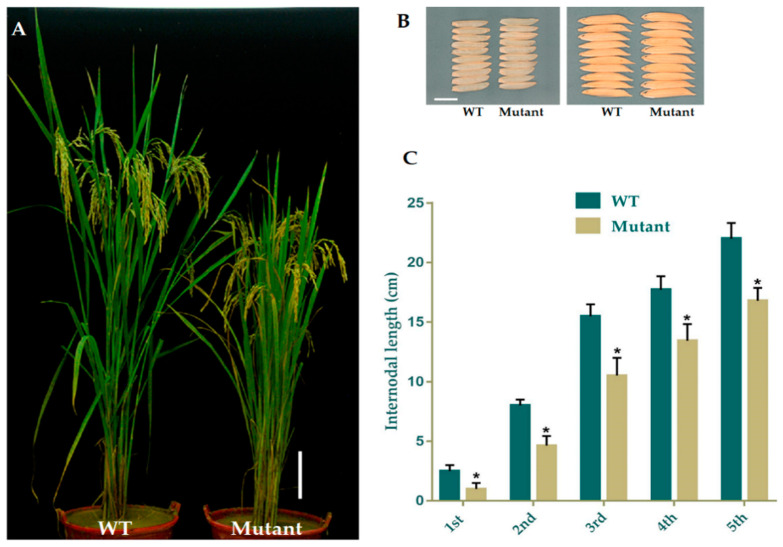
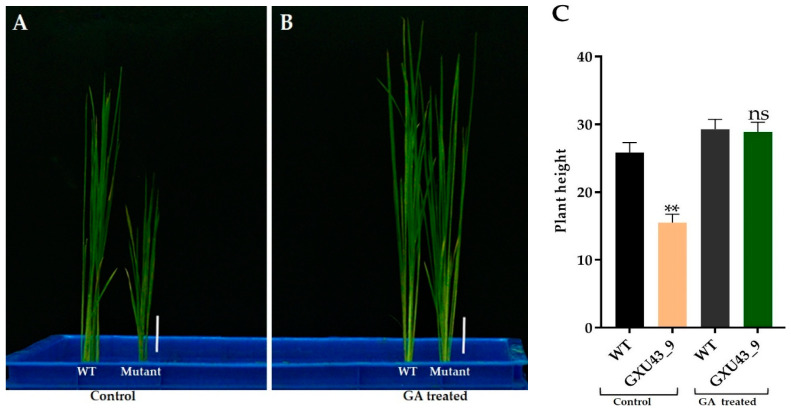
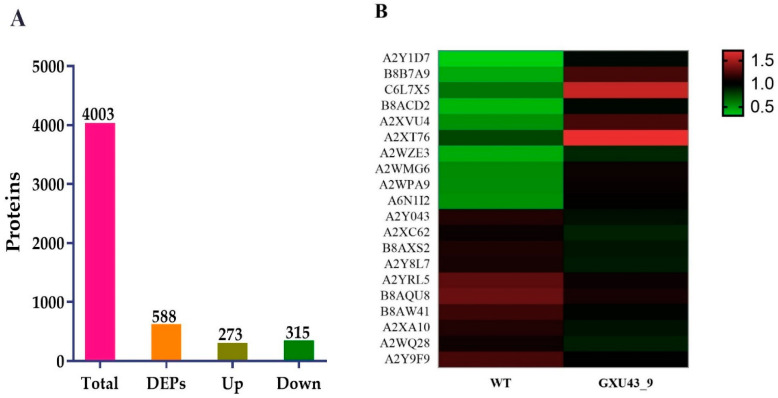
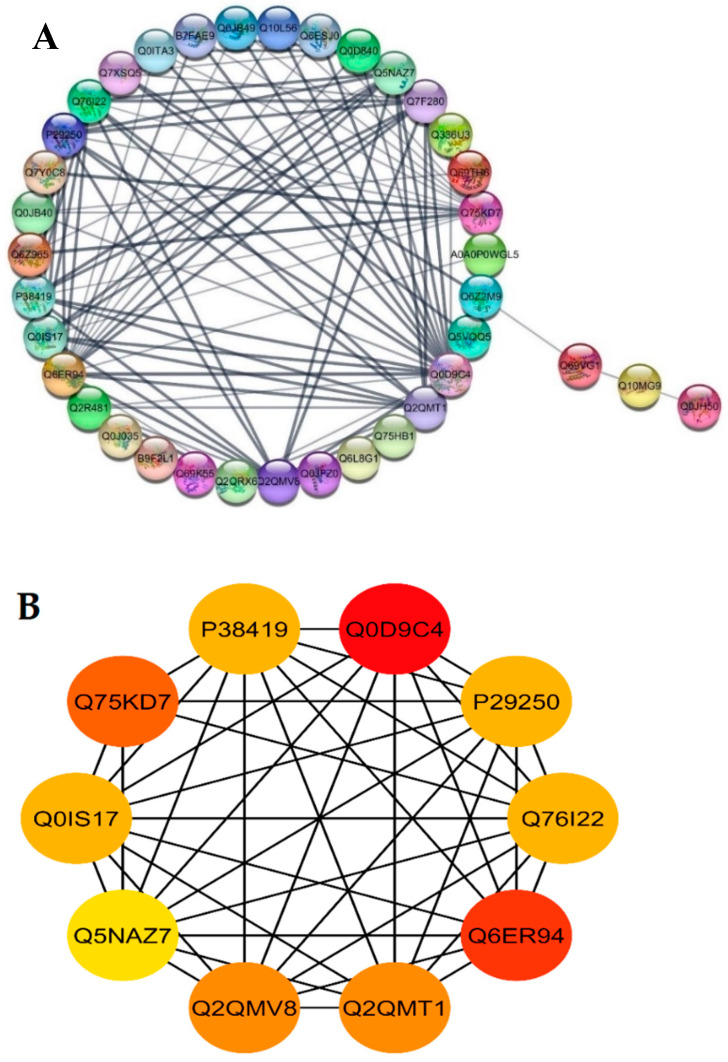
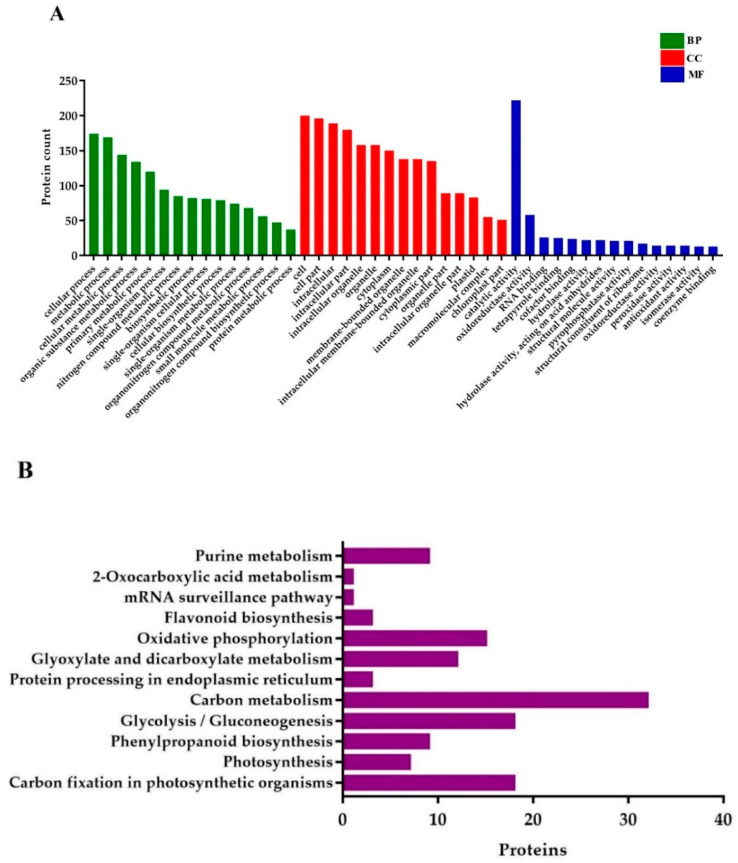
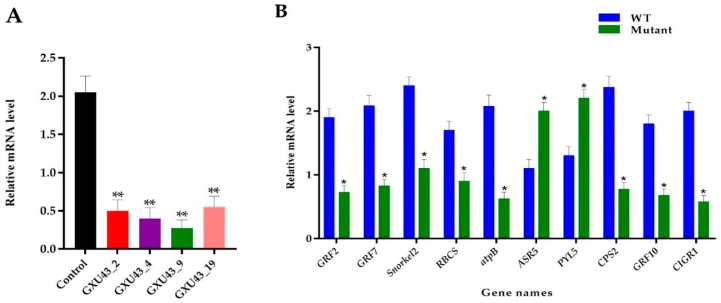
In rice, semi-dwarfism is among the most required characteristics, as it facilitates better yields and offers lodging resistance. Here, semi-dwarf rice lines lacking any residual transgene-DNA and off-target effects were generated through CRISPR/Cas9-guided mutagenesis of the OsGA20ox2 gene in a high yielding Basmati rice line, and the isobaric tags for relative and absolute quantification (iTRAQ) strategy was utilized to elucidate the proteomic changes in mutants. The results indicated the reduced gibberellins (GA1 and GA4) levels, plant height (28.72%), and flag leaf length, while all the other traits remained unchanged. The OsGA20ox2 expression was highly suppressed, and the mutants exhibited decreased cell length, width, and restored their plant height by exogenous GA3 treatment. Comparative proteomics of the wild-type and homozygous mutant line (GXU43_9) showed an altered level of 588 proteins, 273 upregulated and 315 downregulated, respectively. The identified differentially expressed proteins (DEPs) were mainly enriched in the carbon metabolism and fixation, glycolysis/gluconeogenesis, photosynthesis, and oxidative phosphorylation pathways. The proteins (Q6AWY7, Q6AWY2, Q9FRG8, Q6EPP9, Q6AWX8) associated with growth-regulating factors (GRF2, GRF7, GRF9, GRF10, and GRF11) and GA (Q8RZ73, Q9AS97, Q69VG1, Q8LNJ6, Q0JH50, and Q5MQ85) were downregulated, while the abscisic stress-ripening protein 5 (ASR5) and abscisic acid receptor (PYL5) were upregulated in mutant lines. We integrated CRISPR/Cas9 with proteomic screening as the most reliable strategy for rapid assessment of the CRISPR experiments outcomes.
Keywords: CRISPR/Cas9; OsGA20ox2; gibberellins; plant height; proteomic analysis; rice.
Conflict of interest statement
The authors declare no conflict of interest.
Figures


Similar articles
-
Generation of semi-dwarf rice (Oryza sativa L.) lines by CRISPR/Cas9-directed mutagenesis of OsGA20ox2 and proteomic analysis of unveiled changes caused by mutations.3 Biotech. 2019 Nov;9(11):387. doi: 10.1007/s13205-019-1919-x. Epub 2019 Oct 5. 3 Biotech. 2019. PMID: 31656725 Free PMC article.
-
CRISPR/Cas9 Guided Mutagenesis of Grain Size 3 Confers Increased Rice (Oryza sativa L.) Grain Length by Regulating Cysteine Proteinase Inhibitor and Ubiquitin-Related Proteins.Int J Mol Sci. 2021 Mar 22;22(6):3225. doi: 10.3390/ijms22063225. Int J Mol Sci. 2021. PMID: 33810044 Free PMC article.
-
Precise Editing of the OsPYL9 Gene by RNA-Guided Cas9 Nuclease Confers Enhanced Drought Tolerance and Grain Yield in Rice (Oryza sativa L.) by Regulating Circadian Rhythm and Abiotic Stress Responsive Proteins.Int J Mol Sci. 2020 Oct 23;21(21):7854. doi: 10.3390/ijms21217854. Int J Mol Sci. 2020. PMID: 33113937 Free PMC article.
-
The genetic and molecular basis of crop height based on a rice model.Planta. 2018 Jan;247(1):1-26. doi: 10.1007/s00425-017-2798-1. Epub 2017 Nov 6. Planta. 2018. PMID: 29110072 Review.
-
The knockout of Gγ subunit HvGS3 by CRISPR/Cas9 gene editing improves the lodging resistance of barley through dwarfing and stem strengthening.Theor Appl Genet. 2025 Feb 27;138(3):61. doi: 10.1007/s00122-025-04853-8. Theor Appl Genet. 2025. PMID: 40014102 Review.
Cited by
-
Genome-editing approaches and applications: a brief review on CRISPR technology and its role in cancer.3 Biotech. 2021 Mar;11(3):146. doi: 10.1007/s13205-021-02680-4. Epub 2021 Feb 26. 3 Biotech. 2021. PMID: 33732568 Free PMC article. Review.
-
Extra-large G proteins have extra-large effects on agronomic traits and stress tolerance in maize and rice.Trends Plant Sci. 2023 Sep;28(9):1033-1044. doi: 10.1016/j.tplants.2023.04.005. Epub 2023 May 7. Trends Plant Sci. 2023. PMID: 37156701 Free PMC article. Review.
-
Programmed Editing of Rice (Oryza sativa L.) OsSPL16 Gene Using CRISPR/Cas9 Improves Grain Yield by Modulating the Expression of Pyruvate Enzymes and Cell Cycle Proteins.Int J Mol Sci. 2020 Dec 29;22(1):249. doi: 10.3390/ijms22010249. Int J Mol Sci. 2020. PMID: 33383688 Free PMC article.
-
Plant Proteomic Research 3.0: Challenges and Perspectives.Int J Mol Sci. 2021 Jan 14;22(2):766. doi: 10.3390/ijms22020766. Int J Mol Sci. 2021. PMID: 33466599 Free PMC article.
-
Targeted genome modifications in cereal crops.Breed Sci. 2021 Sep;71(4):405-416. doi: 10.1270/jsbbs.21019. Epub 2021 Aug 27. Breed Sci. 2021. PMID: 34912167 Free PMC article.
References
-
- Singh V., Siddiq E., Zaman F., Sadananda A. Improved Basmati Donors [Rice Varieties; India] International Rice Research Newsletter; Los Baños, Philippines: 1988.
MeSH terms
Substances
Grants and funding
LinkOut - more resources
Full Text Sources
