. 2020 Aug 28;18(1):324.
doi: 10.1186/s12967-020-02491-w.

Analyzing and validating the prognostic value and mechanism of colon cancer immune microenvironment

Affiliations

Analyzing and validating the prognostic value and mechanism of colon cancer immune microenvironment

Xinyi Wang et al. J Transl Med. .

Abstract

Background: Colon cancer is a disease with high malignancy and incidence in the world. Tumor immune microenvironment (TIM) and tumor mutational burden (TMB) have been proved to play crucial roles in predicting clinical outcomes and therapeutic efficacy, but the correlation between them and the underlying mechanism were not completely understood in colon cancer.

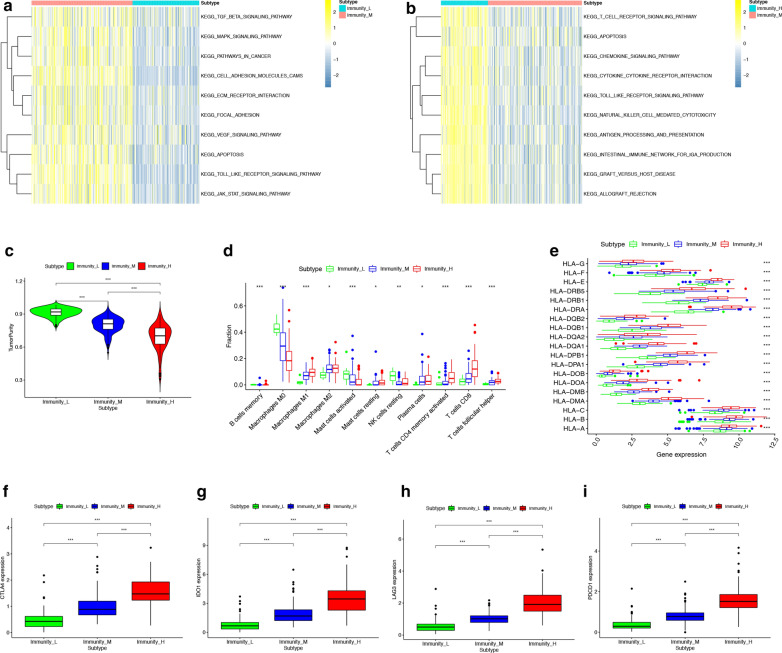
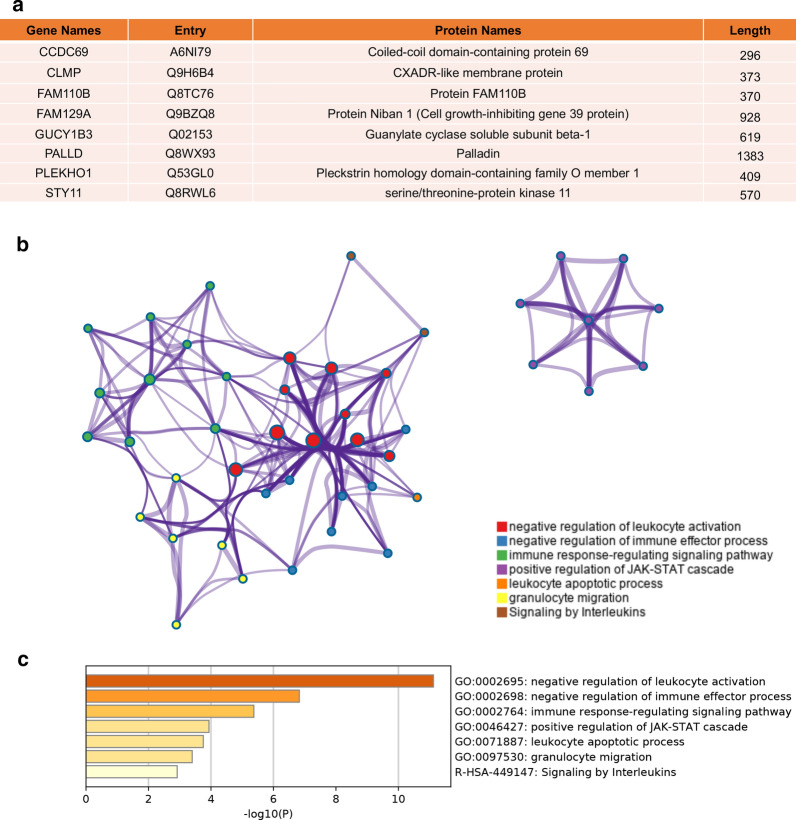
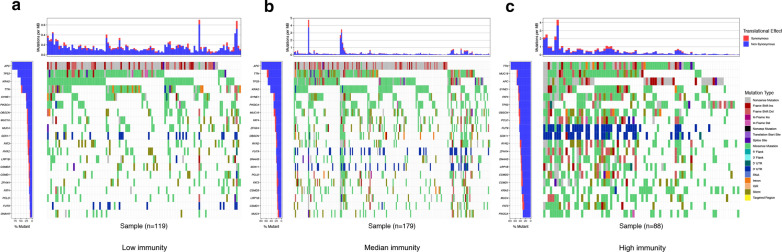
Methods: In this study, we used Single-Sample Gene Set Enrichment Analysis (ssGSEA) and unsupervised consensus clustering analysis to divide patients from the TCGA cohort into three immune subgroups. Then we validated their differences in immune cell infiltration, overall survival outcomes, clinical phenotypes and expression levels of HLA and checkpoint genes by Mann-Whitney tests. We performed weighted correlation network analysis (WGCNA) to obtain immunity-related module and hub genes. Then we explored the underlying mechanism of hub genes by gene set enrichment analysis (GSEA) and gene set evaluation analysis (GSVA). Finally, we gave an overall view of gene variants and verified the correlation between TIM and TMB by comparing microsatellite instability (MSI) and gene mutations among three immune subgroups.

Results: The colon cancer patients were clustered into low immunity, median immunity and high immunity groups. The median immunity group had a favorable survival probability compared with that of the low and high immunity groups. Three groups had significant differences in immune cell infiltration, tumor stage, living state and T classification. We got 8 hub genes (CCDC69, CLMP, FAM110B, FAM129A, GUCY1B3, PALLD, PLEKHO1 and STY11) and predicted that immunity may correlated with inflammatory response, KRAS signaling pathway and T cell infiltration. With higher immunity, the TMB was higher. The most frequent mutations in low and median immunity groups were APC, TP53 and KRAS, while TTN and MUC16 showed higher mutational frequency in high immunity group.

Conclusions: We performed a comprehensive evaluation of the immune microenvironment landscape of colon cancer and demonstrated the positive correlation between immunity and TMB. The hub genes and frequently mutated genes were strongly related to immunity and may give suggestion for immunotherapy in the future.

Keywords: Colon cancer; Tumor immune microenvironment; Tumor mutational burden; Weighted correlation network analysis.


Conflict of interest statement

The authors declare that they have no competing interests.

Figures

Fig. 1
Fig. 1
Identification and validation of colon cancer immunity-related subgroups. a In ssGSEA, 29 immune-related gene sets are enriched with colon cancer. These gene sets are composed of immune cells and immune processes. The tumor purity, ESTIMATE score, immune score and stromal score are also shown in this heatmap. b Consensus clustering cumulative distribution function (CDF) for k = 2 to 9. c Relative change in area under CDF curve for k = 2 to 9. d Heatmap of sample clustering at consensus k = 3. ek Survival analysis of the total TCGA cohort, samples without lymphatic invasion. samples without metastasis, samples without lymph node metastasis, samples which are stage1 or 2, samples which are T3 or T4 and samples with age less than 60
Fig. 2
Fig. 2
GSVA and analysis of immune cell infiltration, HAL genes and checkpoint genes expression in 3 immune subgroups. a, b The heatmap was used to visualize these biological processes, and yellow represented activated pathways and blue represented inhibited pathways. The colon cancer cohorts were used as sample annotations. A: Immunity-L vs Immunity-M, B: Immunity-M vs Immunity-H. c The tumor purity of samples from 3 immune subgroups (*P < 0.05, **P < 0.01, ***P < 0.001). d The fractions of 11 types of infiltrating immune cells in samples from 3 immune subgroups. e The RNA expression levels of HLA genes in samples from 3 immune subgroups. f, i The RNA expression levels of checkpoint-related genes (CTLA4, IDO1, LAG3 and PDCD1) in samples from 3 immune subgroups
Fig. 3
Fig. 3
Detection and validation of immunity-related module by WGCNA. a The cluster was based on the transcriptome data from TCGA. The color intensity represents the clinical phenotypes (fustat, TNM classification, stage, age, gender, lymphatic invasion, venous invasion and immunity). b Heat‐map of the correlation between gene modules and the clinical phenotypes of colon cancer. The brown module was the most correlated module with immunity. c The correlation analysis between membership (MM) in brown module and gene significance (GS) for immunity. d, e Bubble chart of GO and KEGG results of brown module
Fig. 4
Fig. 4
Mann–Whitney test of 8 hub genes expression in different types of samples. ah Expression level of 8 hub genes in normal tissue and tumor tissue. i, j The expression levels of hub genes are different in clinical subgroups. PALLD was correlated with venous invasion (P = 0.047), PLEKHO1 was correlated with lymphatic invasion (P = 0.019) and SYT11 was correlated with lymph node metastasis (P = 0.048)
Fig. 5
Fig. 5
The expressional differences of hub gene levels between colon cancer tissues and the para-cancer normal solid tissues in the Human Protein Atlas database
Fig. 6
Fig. 6
Functional analysis of hub genes. a The annotation of hub genes using Uniport database. b Protein–Protein interaction network of genes which were directly related to hub genes. A sport represented a gene and the color of spots represented which pathway this gene was involved in. C The enrichment statistical significance of GO-terms and KEGG pathways
Fig. 7
Fig. 7
The landscape of frequently mutated genes in colon cancer. a The TMB of samples from 3 immune subgroups (*P < 0.05, **P < 0.01, ***P < 0.001). b The Chi-square test of MSI status in 3 immune subgroups. c The coincident and exclusive associations across mutated genes. d Classification and frequency of mutation types. e Frequency of variant types. f Frequency of SNV classes. g, h tumor mutation burden in specific samples; i the top 10 mutated genes in colon cancer
Fig. 8
Fig. 8
Frequently mutated genes in 3 immune subgroups. ac Waterfall plots display the frequently mutated genes in 3 immune subgroups of colon cancer. The left panel shows the genes ordered by their mutation frequencies. The right panel presents different mutation types

References

    1. Chen W, Zheng R, Zhang S, Zeng H, Xia C, Zuo T, et al. Cancer incidence and mortality in China, 2013. Cancer Lett. 2017;401:63–71. doi: 10.1016/j.canlet.2017.04.024. - DOI - PubMed
    1. Labianca R, Beretta GD, Kildani B, Milesi L, Merlin F, Mosconi S, et al. Colon cancer. Crit Rev Oncol Hematol. 2010;74(2):106–133. doi: 10.1016/j.critrevonc.2010.01.010. - DOI - PubMed
    1. Pagès F, Mlecnik B, Marliot F, Bindea G, Ou F-S, Bifulco C, et al. International validation of the consensus Immunoscore for the classification of colon cancer: a prognostic and accuracy study. Lancet. 2018;391(10135):2128–2139. doi: 10.1016/S0140-6736(18)30789-X. - DOI - PubMed
    1. Beane J, Spira A, Lenburg ME. Clinical impact of high-throughput gene expression studies in lung cancer. J Thor Oncol. 2009;4(1):109–18. doi: 10.1097/JTO.0b013e31819151f8. - DOI - PMC - PubMed
    1. Nagy Á, Lánczky A, Menyhárt O, Győrffy B. Validation of miRNA prognostic power in hepatocellular carcinoma using expression data of independent datasets. Sci Rep. 2018;8(1):9227. doi: 10.1038/s41598-018-27521-y. - DOI - PMC - PubMed

Publication types

Substances