. 2020 Sep-Oct;17(5):469-497.
doi: 10.21873/cgp.20205.

Whole-transcriptome Analysis of Fully Viable Energy Efficient Glycolytic-null Cancer Cells Established by Double Genetic Knockout of Lactate Dehydrogenase A/B or Glucose-6-Phosphate Isomerase

Affiliations

Whole-transcriptome Analysis of Fully Viable Energy Efficient Glycolytic-null Cancer Cells Established by Double Genetic Knockout of Lactate Dehydrogenase A/B or Glucose-6-Phosphate Isomerase

Elizabeth Mazzio et al. Cancer Genomics Proteomics. 2020 Sep-Oct.

Abstract

Background/aim: Nearly all mammalian tumors of diverse tissues are believed to be dependent on fermentative glycolysis, marked by elevated production of lactic acid and expression of glycolytic enzymes, most notably lactic acid dehydrogenase (LDH). Therefore, there has been significant interest in developing chemotherapy drugs that selectively target various isoforms of the LDH enzyme. However, considerable questions remain as to the consequences of biological ablation of LDH or upstream targeting of the glycolytic pathway.

Materials and methods: In this study, we explore the biochemical and whole transcriptomic effects of CRISPR-Cas9 gene knockout (KO) of lactate dehydrogenases A and B [LDHA/B double KO (DKO)] and glucose-6-phosphate isomerase (GPI KO) in the human colon cancer cell line LS174T, using Affymetrix 2.1 ST arrays.

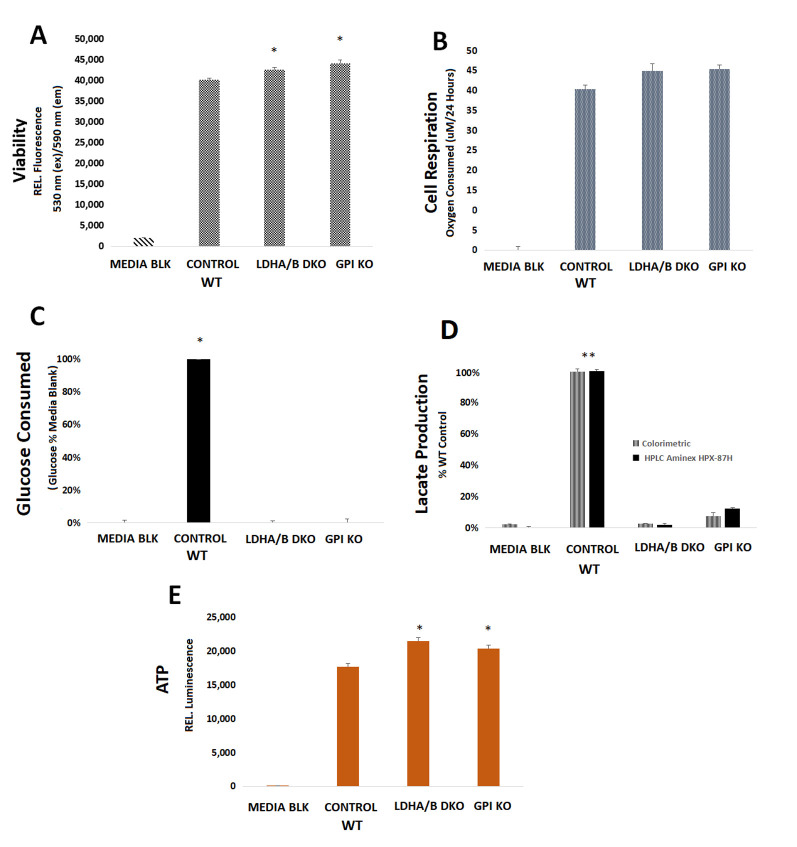
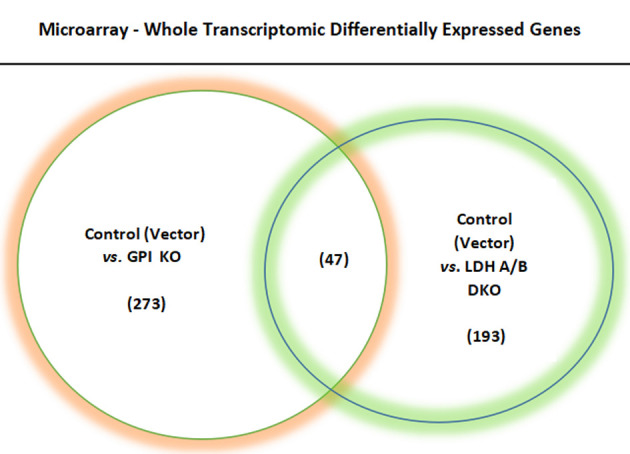
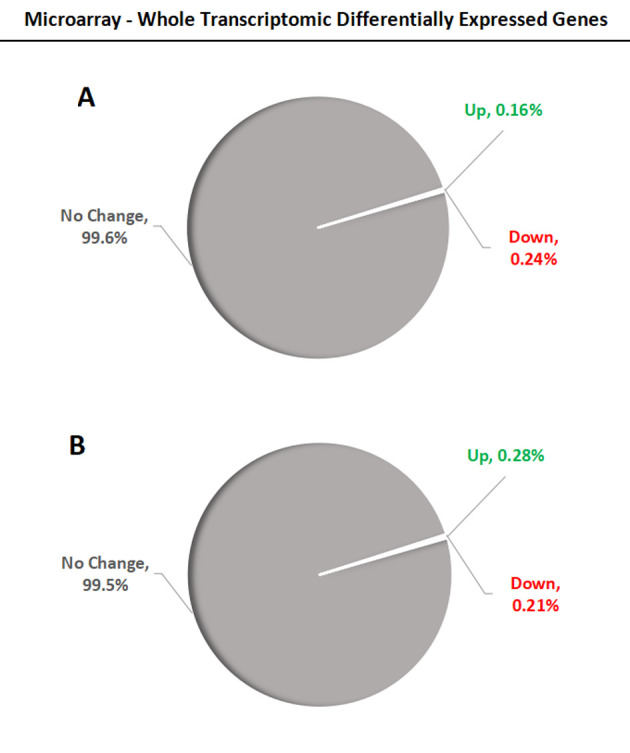
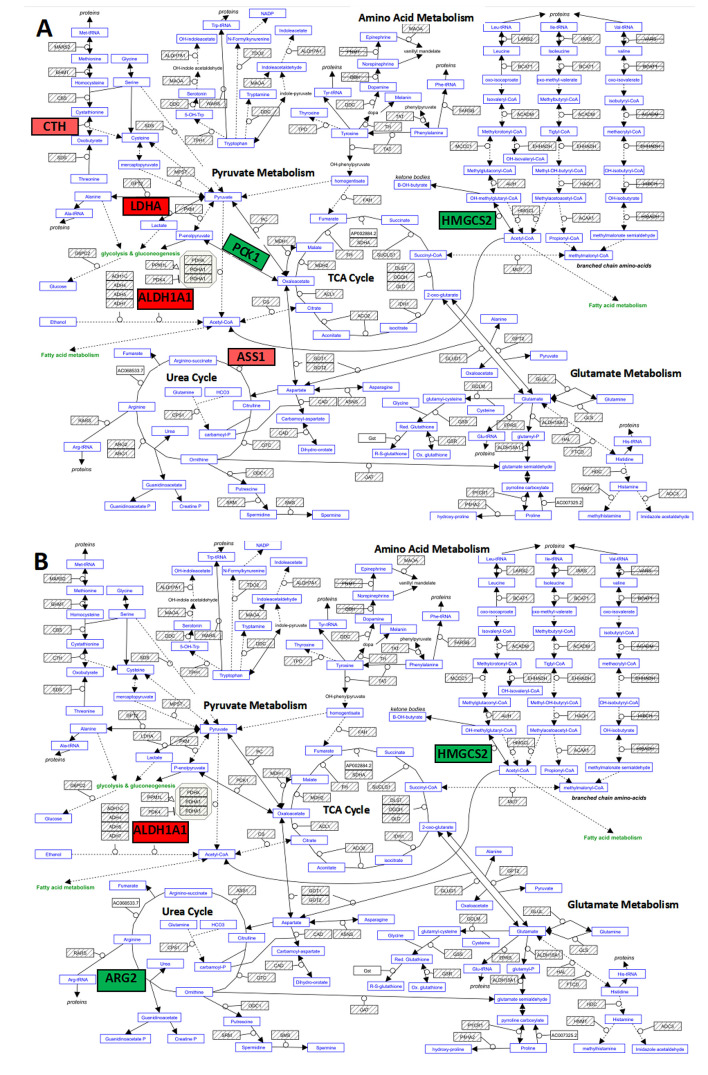
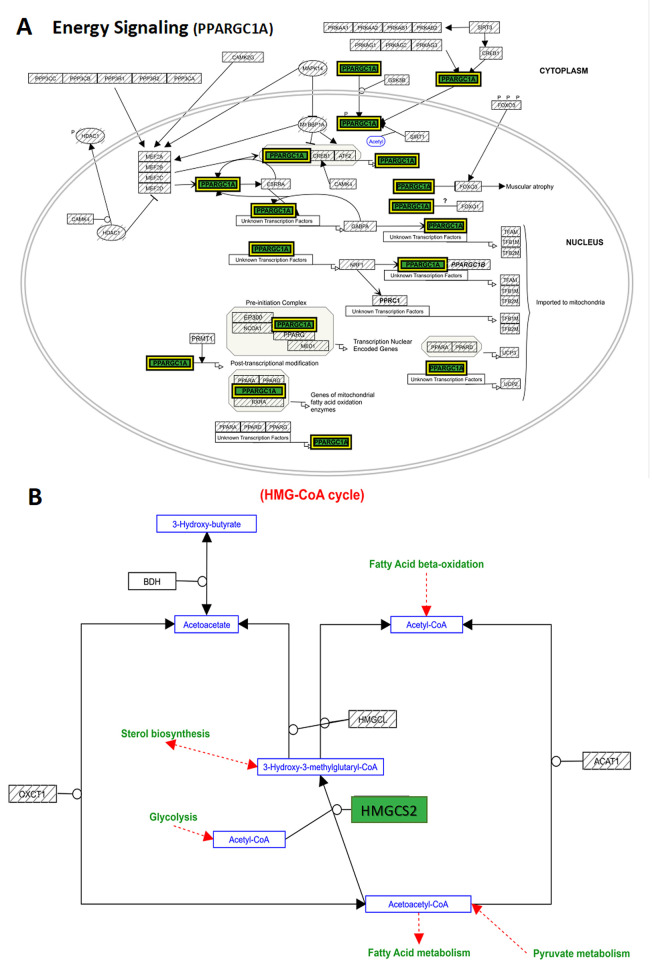
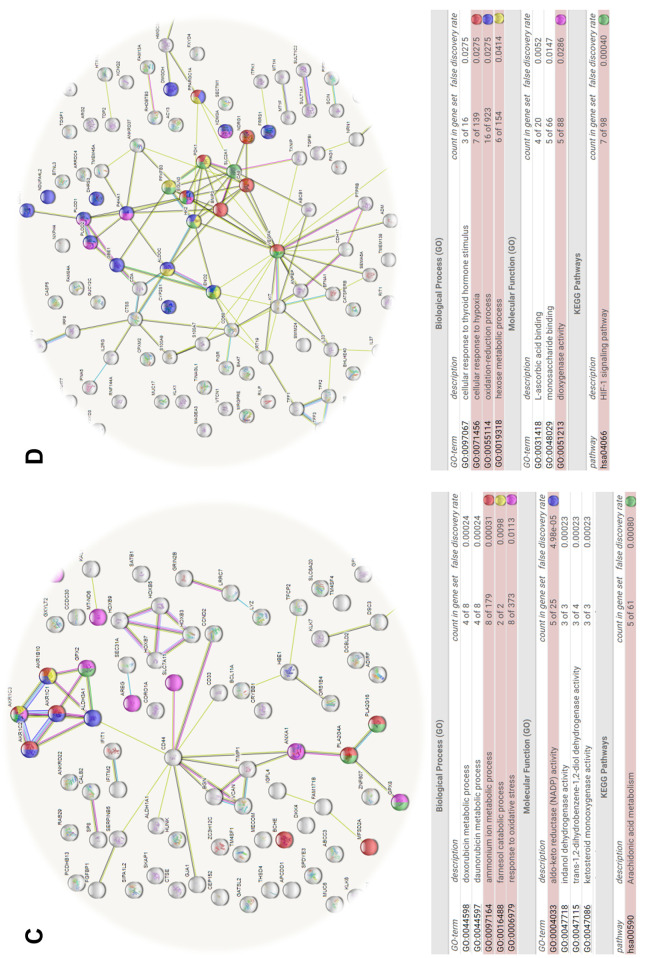
Results: The metabolic biochemical profiles corroborate that relative to wild type (WT), LDHA/B DKO produced no lactic acid, (GPI KO) produced minimal lactic acid and both KOs displayed higher mitochondrial respiration, and minimal use of glucose with no loss of cell viability. These findings show a high biochemical energy efficiency as measured by ATP in glycolysis-null cells. Next, transcriptomic analysis conducted on 48,226 mRNA transcripts reflect 273 differentially expressed genes (DEGS) in the GPI KO clone set, 193 DEGS in the LDHA/B DKO clone set with 47 DEGs common to both KO clones. Glycolytic-null cells reflect up-regulation in gene transcripts typically associated with nutrient deprivation / fasting and possible use of fats for energy: thioredoxin interacting protein (TXNIP), mitochondrial 3-hydroxy-3-methylglutaryl-CoA synthase 2 (HMGCS2), PPARγ coactivator 1α (PGC-1α), and acetyl-CoA acyltransferase 2 (ACAA2). Other changes in non-ergometric transcripts in both KOs show losses in "stemness", WNT signaling pathway, chemo/radiation resistance, retinoic acid synthesis, drug detoxification, androgen/estrogen activation, and extracellular matrix reprogramming genes.

Conclusion: These findings demonstrate that: 1) The "Warburg effect" is dispensable, 2) loss of the LDHAB gene is not only inconsequential to viability but fosters greater mitochondrial energy, and 3) drugs that target LDHA/B are likely to be ineffective without a plausible combination second drug target.

Keywords: Cancer; GPI; LDHA; LDHB; Warburg effect; genes; metabolism.


Conflict of interest statement

The Authors declare that they have no conflicts of interest.

Figures

Figure 1
Figure 1. Metabolic parameters in the control WT (LS174T) cells, relative to LDHA/B double knockout (DKO) and GPI KO including: (A) basic viability [relative fluorescent intensity defined as 530 (ex)/590 (em)], (B) oxygen respiration (O2 consumed μM/ 24 h), (C) glucose consumption (media glucose concentrations as a % of WT controls with no defect in glycolysis), (D) lactic acid production (lactic acid produced as a % of WT controls with no defect in glycolysis) and (E) somatic ATP concentrations (relative luminescent values). The data was analyzed by a one way ANOVA, followed by a Tukey post hock test, where significant differences are represented by *p-Value <0.05 and significant differences established for the following: (A-B) WT versus KO clones, (C) glucose media versus consumption in the 3 clones, (D) lactic acid production in 3 clones versus media blank and (E) WT versus KO clones.
Figure 2
Figure 2. Whole transcriptome summary of deferentially expressed genes (DEG) in both clones (LDHA/B DKO and GPI KO) vs. WT Vector controls in the LS174T colon cancer cell line, and overlapping genes common to both KO clones. Analysis conditions: fold change >2 or p-Value<0.05. Total number of genes analyzed: 48226. Results: 273 DEGS (GPI KO) and 193 DEGS (LDHA/B DKO) and 47 DEGS common to both KO cell lines.
Figure 3
Figure 3. Whole transcriptome summary of DEGs in both clones (LDHAB DKO) (A) and (GPI KO) (B) versus WT vector controls in the LS174T colon cancer cell lines, with respect to the entire genome, also reflecting % of up and down DEGs in both clones. Analysis conditions: fold change >2 or p-Value<0.05. Total number of genes: 48226. (A) LDHAB DKO: Up-regulated 78 (0.16%) and Down-regulated 115 (0.24%), (B) GPI KO: Up-regulated 84 (0.28%) and Down-regulated 121 (0.21%).
Figure 4
Figure 4. (A) Wiki Pathway analysis of LDHA/B DKO DEF changes observed in glycolysis, gluconeogenesis and mitochondrial TCA cycle pathways. (B) Wiki Pathway analysis of GPI KO DEF changes observed in glycolysis, gluconeogenesis and mitochondrial TCA cycle pathways. In red are the down-regulated transcripts and in green the up-regulated transcripts. Filtered by fold change <-2 or >2, p-Value<0.05.
Figure 5
Figure 5. (A) Wiki Pathway analysis of LDHA/B DKO DEF changes observed in integrated amino acid metabolic pathways. (B) Wiki Pathway analysis of GPI KO DEF changes observed in integrated amino acid metabolic pathways. In red are the down-regulated transcripts and in green the up-regulated transcripts. Filtered by fold change <-2 or >2, p-Value<0.05.
Figure 6
Figure 6. (A) Wiki Pathway analysis of overlapping upregulated DEG changes observed in both LDHA/B DKO and GPI KO in energy pathways. The PPARGC1A differential transcript changes were as follows: WT versus LDHA/B DKO: (FC +3.43, FDR p-Value<0.001); WT versus GPI KO: (FC +3.39, FDR p-Value <0.001). (B) Wiki Pathway analysis of overlapping up-regulated DEF changes observed in both LDHA/B DKO and GPI KO in the HMG-CoA pathway. The HMGCS2 differential transcript changes were as follows: WT versus LDHA/B DKO: (FC +3.43, FDR p-Value<0.001); WT versus GPI KO: (FC +3.39, FDR p-Value<0.001). In red are the down-regulated transcripts and in green the up-regulated transcripts. Filtered by fold change <-2 or >2, p-Value<0.05.
Figure 7
Figure 7. String predicted protein-protein interactions assembled from microarray data specific to DEG down-regulated genes in the LDHA/B DKO clone set, (relative to WT controls). (A) The network nodes connected by a line represent protein-protein interactions, with colored nodes correspond to the String DB functional, molecular or pathway elements in the Table below. The interactions include direct (physical) and indirect (functional) associations; stemming from computational prediction, and knowledge of interactions aggregated from a large number of major (primary) databases. (B) The network nodes connected by a line represent protein-protein interactions, with colored nodes correspond to the String DB functional, molecular or pathway elements in the Table below. The interactions include direct (physical) and indirect (functional) associations; stemming from computational prediction, and knowledge of interactions aggregated from a large number of major (primary) databases. (C) The network nodes connected by a line represent protein-protein interactions, with colored nodes correspond to the String DB functional, molecular or pathway elements in the Table below. The interactions include direct (physical) and indirect (functional) associations; stemming from computational prediction, and knowledge of interactions aggregated from a large number of major (primary) databases. (D) The network nodes connected by a line represent protein-protein interactions, with colored nodes correspond to the String DB functional, molecular or pathway elements in the Table below. The interactions include direct (physical) and indirect (functional) associations; stemming from computational prediction, and knowledge of interactions aggregated from a large number of major (primary) databases.

Similar articles

Cited by

References

    1. Kroemer G, Pouyssegur J. Tumor cell metabolism: Cancer’s achilles’ heel. Cancer Cell. 2008;13(6):472–482. doi: 10.1016/j.ccr.2008.05.005. - DOI - PubMed
    1. Cassim S, Vucetic M, Zdralevic M, Pouyssegur J. Warburg and beyond: The power of mitochondrial metabolism to collaborate or replace fermentative glycolysis in cancer. Cancers (Basel) 2020;12(5) doi: 10.3390/cancers12051119. - DOI - PMC - PubMed
    1. Pillai SR, Damaghi M, Marunaka Y, Spugnini EP, Fais S, Gillies RJ. Causes, consequences, and therapy of tumors acidosis. Cancer Metastasis Rev. 2019;38(1-2):205–222. doi: 10.1007/s10555-019-09792-7. - DOI - PMC - PubMed
    1. da Silva VP, Mesquita CB, Nunes JS, de Bem Prunes B, Rados PV, Visioli F. Effects of extracellular acidity on resistance to chemotherapy treatment: A systematic review. Med Oncol. 2018;35(12):161. doi: 10.1007/s12032-018-1214-4. - DOI - PubMed
    1. Taddei ML, Pietrovito L, Leo A, Chiarugi P. Lactate in sarcoma microenvironment: Much more than just a waste product. Cells. 2020;9(2) doi: 10.3390/cells9020510. - DOI - PMC - PubMed

MeSH terms